N A N O E X P R E S S
Open Access
The Spatiotemporal Control of Osteoblast
Cell Growth, Behavior, and Function
Dictated by Nanostructured Stainless Steel
Artificial Microenvironments
Udesh Dhawan
1, Hsu-An Pan
1, Meng-Je Shie
1, Ying Hao Chu
1, Guewha S. Huang
1, Po-Chun Chen
2*and Wen Liang Chen
3*Abstract
The successful application of a nanostructured biomaterial as an implant is strongly determined by the nanotopography size triggering the ideal cell response. Here, nanoporous topography on 304L stainless steel substrates was engineered to identify the nanotopography size causing a transition in the cellular characteristics, and accordingly, the design of nanostructured stainless steel surface as orthopedic implants is proposed. A variety of nanopore diameters ranging from 100 to 220 nm were fabricated by one-step electrolysis process and collectively referred to as artificial microenvironments. Control over the nanopore diameter was achieved by varying bias voltage. MG63 osteoblasts were cultured on the nanoporous surfaces for different days. Immunofluorescence (IF) and scanning electron microscopy (SEM) were
performed to compare the modulation in cell morphologies and characteristics. Osteoblasts displayed differential growth parameters and distinct transition in cell behavior after nanopore reached a certain diameter. Nanopores with 100-nm diameter promoted cell growth, focal adhesions, cell area, viability, vinculin-stained area, calcium mineralization, and alkaline phosphatase activity. The ability of these nanoporous substrates to differentially modulate the cell behavior and assist in identifying the transition step will be beneficial to biomedical engineers to develop superior implant geometries, triggering an ideal cell response at the cell-nanotopography interface.
Keywords:Nanotopography, Osteoblast, Nanoporous, Stainless steel, Extracellular matrix, Artificial microenvironment
Background
Nanotopography modulates cellular behavior [1–3]. A plethora of nanotopographies such as nanodots [4, 5], nanoislands [2, 6], nanoridges [7], nanotubes [8, 9], and nanoconcave [10] have been known to dictate the cellu-lar behavior in the form of cell morphology, cell migra-tion, cell viability, and cell physiology [11]. A diversity of materials such as tantalum oxide [12], titanium dioxide [13], and mica [14] have been exploited to develop nano-surfaces with nanotopographies and nanonano-surfaces which the body may identify as “self,” thereby providing an
ideal environment for the cells to attach and grow. In the past, studies on fibroblasts [15], cardiomyocytes [16], osteoblasts [17, 18], and cancerous cell lines such as C33A, TOV-112D, and TOV-21G [19] have shown how the nanotopography can guide the cellular behavior in the form of cell area, focal adhesions, and microfilament bundles. Cells have been seen to respond favorably to a variety of nanotopographies between the size ranges of 20 to 100 nm [4]. Significant reduction in cell viability in addition to an elongated or an apoptotic morphology ac-companied with scarce focal adhesions has been ob-served for nanotopographies above 100 nm [20]. Modulation in the form of Integrins further elucidates how cellular behavior and ultimately the cell fate can be dictated in vitro by nanotopographies in different size range, at the genetic level [21].
* Correspondence:[email protected];[email protected]; [email protected]
2
Institute of Materials Science and Engineering, National Taipei University of Technology, Section 3, Zhongxiao E Road, Taipei City 106, Taiwan, ROC
3Department of Biological Science and Technology, National Chiao Tung
University, 1001 University Road, Hsinchu 300, Taiwan, ROC Full list of author information is available at the end of the article
Among all the materials exploited for applications as im-plants, metallic biomaterials such as stainless steel tend to be the first choice primarily due to their high strength and fracture and corrosion resistance for an extended period of time [25–27]. However, the number of studies utilizing stainless steel as a substrate to engineer nano-topographies for improved cell attachment, growth, and function are scarce. Engineering nanotopographies to elucidate the parameters causing a transition in the cell behavior may help the biomedical engineers to under-stand the modulation in the cellular behavior which may act as a cornerstone in designing implants with surface geometries which cause the cells to respond to them favorably.
The present study is based on the hypothesis that nanoporous topographies of different diameters may cause a transition in the cellular behavior and may guide osteoblast cell attachment, growth, function, and ultim-ately, the fate. Nanoporous topography ranging from 100 to 220 nm was fabricated by a simple electrolysis method in perchloric acid and ethylene-glycol monobu-tylether by varying the voltages. MG63 osteoblasts were used as a model for this study. In particular, the aim of this study was to engineer a nanotopography which
engineering nanoporous surfaces. The dimensions of surfaces were 25mm × 25mm × 2mm and provided with a thread for the electrical contact. The compos-ition of stainless steel substrates was (wt. %) chro-mium (Cr) 18.68%, nickel (Ni) 10.14%, manganese (Mn) 1.72, molybdenum (Mo) 0.35, copper (Cu) 0.15%, nitrogen (N) 0.072%, carbon (C) 0.018, and Fe balanced. First, the surfaces were mechanically polished with abrasive papers (grades 500, 1200, 2400, and 4000) followed by diamond pastes of decreasing grades (3, 1, and 0.25 m). Samples were ultra-sonicated in acetone, ethanol, and distilled water for 10 min each. Next, the electrolysis was carried out in an electrolytic bath. For the duration of electrolysis, the temperature of the bath was maintained between
−5 and 15 °C. Forty microliters of perchloric acid and 760 mL of ethylene-glycol monobutylether were mixed together and used as electrolytes. Perchloric acid was used to obtain a low PH to promote ionization of metallic atoms into cations instead of oxides. Ethylene-glycol monobutylether maintains the viscosity of the electrolyte. Voltage used for carrying out electrolysis was varied to control the diameter of nanopores. Electrolysis was carried out at 45, 60, 70,
[image:2.595.57.539.527.692.2]and 75 V to fabricate nanopores of 100, 180, 200, and 220 nm diameter. Nanopores of less than 100 nm could not be fabricated due to limitation of the fabrication set up resulting in inhomogeneity in the diameter of nanodots. The dimensions and homo-geneity of nanopores were analyzed with JEOL JSM-6500 TFE SEM. The diameters of the nanopores were well controlled and highly defined.
Cell Culture
MG63, osteoblast-like cells, originally isolated from human osteosarcoma, were seeded on the nanoporous substrates and cultured in Eagles’ minimum essential medium supplemented with 2 mM L-glutamine and
Earle’s BSS containing 1.5 g/l sodium bicarbonate, 0.1 mM non-essential amino acids, 1.0 mM sodium pyruvate, and 10% fetal bovine serum. Cell cultures were incubated in a humidified incubator with 5% CO2at 37 ° C. Cell culturing was performed in a class-10 clean room to ensure elimination of any possible contamination.
Morphological Analysis by Scanning Electron Microscopy
MG63 osteoblasts were seeded on the control (flat) and nanosurfaces with different pore diameter, harvested after days 1 and 3, and the transition in the cell morph-ology was observed. The culture medium was removed, and the wells were washed twice with Dulbecco’s phosphate-buffered saline (DPBS) followed by fixation in Fig. 2Scanning electron microscopy of cells cultured on various nanoporous stainless steel artificial microenvironments. Cells were harvested after days 1 and 3. Cells on 100 nm displayed a well-extended morphology, complemented by a large cell area as compared to a shrunken morphology on 200 and 220 nm. After day 1, a substantial amount of lamellipodia were observed in cells on 100-nm nanoporous surfaces in contrast to scarce or none on 200- and 220-nm nanoporous surfaces. After day 3, a greater number of cells were observed on 100 nm than on any other nanoporous surface, indicating that 100 nm provided an ideal environment for cell attachment and growth. Transition in cell characteristics was observed as the nanopore size became more than 100 nm. All images were taken at 300×.Scale bars= 100μm
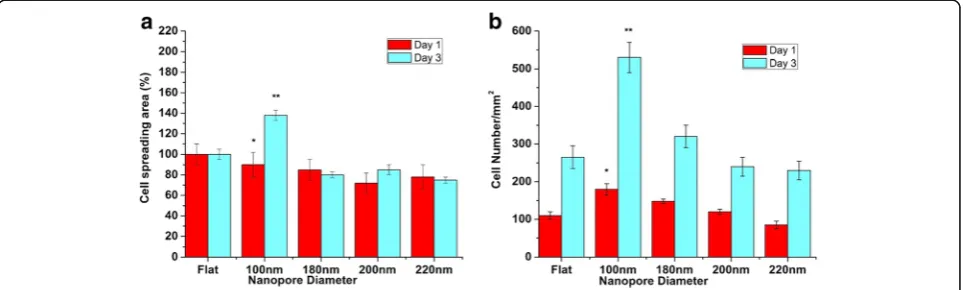
Fig. 3Statistical analysis of cell spreading area (%) and cell number (/mm2) on different nanoporous stainless steel artificial microenvironments.aAfter
[image:3.595.57.538.89.247.2] [image:3.595.58.540.509.654.2]ating voltage of 8 or 10 kiloelectron volts (KeV).
Immunostaining
MG63 osteoblasts were seeded on control (flat) and nanosurfaces with different pore diameter, harvested after days 1 and 3, and the transition in morphology, cell area, focal adhesions, and vinculin-stained area was ana-lyzed. The culture medium was removed, and the cells were washed twice with Dulbecco’s phosphate-buffered saline (DPBS) followed by fixation with 4% paraformal-dehyde for 15 min at room temperature. Samples were then washed thrice with PBS. The samples were then permeabilized in 0.1% Triton X-100 for 10 min followed by three washes in PBS. Blocking was performed in 2% BSA (Thermo Fisher Scientific, USA), prepared in PBS, for 1 h at room temperature on the orbital shaker, and followed by overnight incubation at 4 °C. Next day, samples were washed thrice with PBS followed by incu-bation with anti-vinculin antibody (Bioss USA), diluted in 2% BSA, for overnight at 4 °C. Next day, the samples were washed thrice with PBS and then incubated with goat anti-rabbit FITC-conjugated secondary antibody
sions/cell. Vinculin area was also analyzed and expressed as vinculin stained area/cell (μm2). Similar methodology was adopted for statistical analysis of cell cytoskeleton and expressed as cell cytoskeleton/μm2. All washes were performed in 1× PBS for 5 min each.
Measurement of Cell Growth and Cell Spreading Area
Cells were seeded on control (flat) and nanosurfaces with different pore diameter, harvested after days 1 and 3. The adhered cells were fixed in 1.25% glutaraldehyde (in PBS) for 20 min at room temperature, followed by three washes with PBS. The following steps for sample preparations are same as mentioned in “ Immunostain-ing” section. Finally, SEM was used to analyze which nanoporous surfaces promoted a greater cell growth. The number of cells were counted using ImageJ soft-ware. For statistical analysis, six different substrate fields were measured per sample, and three separate samples were analyzed. The mean was then normalized against the control (flat) surfaces and expressed as cell number/ mm2. To analyze which nanoporous surface promoted a greater cell spreading area, the area was measured using
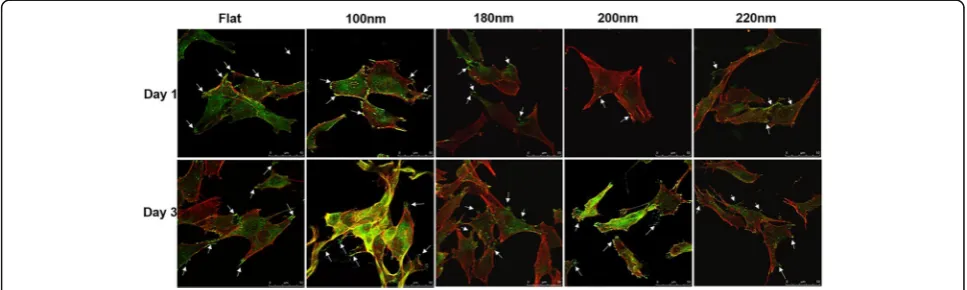
Fig. 4Immunofluorescence staining of cells cultured on various nanoporous stainless steel artificial microenvironments. Cells were seeded on different artificial microenvironments and harvested after days 1 or 3. Cytoskeletal arrangement was examined using phalloidin, and vinculin localization was examined using anti-vinculin antibodies (green dotsorgreen-stained area). After day 1, cells displayed an extended morphology on 100-nm nanoporous surfaces, which transitioned to an abnormal elongated or shrunken morphology on 220-nm nanoporous surfaces. A plethora of focal adhesions were seen in cells on flat, 100-nm nanoporous surfaces as compared to 200- and 220-nm nanoporous surfaces.Arrows
[image:4.595.56.540.509.654.2]ImageJ, normalized against cell spreading area on flat surfaces, and expressed as cell spreading area (%).
Measurement of Cell Viability
The procedure to calculate the cell viability was followed as described elsewhere [21]. Briefly, cells were seeded on control (flat) and nanosurfaces with different pore diam-eter, harvested after days 1 and 3. Samples were washed thrice with DPBS, fixed in 4% paraformaldehyde, and stained with 4′,6-diamidino-2-phenylindole (DAPI) (Thermo Fisher Scientific, USA). Samples were incubated for 20 min, in dark, followed by mounting on a glass slide and imaging with Leica TCS SP2 confocal microscope.
Alizarin Red S Staining
Cells were seeded at a density of 7 × 10³cells/cm2on con-trol (flat) and nanosurfaces with different pore diameter. Cells were harvested after days 7, 10, and 14, and alizarin red S staining was then performed to analyze the extent of calcium mineralization. Samples were fixed in 4% parafor-maldehyde, prepared in PBS for 10 min at room temperature, followed by soaking in 2% alizarin red S, pre-pared in DI water (PH adjusted to 4.2), at 37 °C for 20 min. Samples were then washed with DI water to remove any ex-cess stain. The samples were observed under a microscope. For statistical analysis, 50 cells were randomly picked and the area of stain per cell on each nanoporous surface, rela-tive to area of stain per cell on flat surfaces, was calculated. Fig. 5Statistical analysis of cell cytoskeletal area, number of focal adhesions, and vinculin-stained area on different nanoporous stainless steel arti-ficial microenvironments.aCells on 100 nm displayed the maximum number of focal adhesions from cells onto the nanoporous surfaces on both the days. One hundred nanometers acted as the factor in causing the transition in the number of focal adhesions.bMaximum vinculin-stained area was seen in cells on 100-nm nanoporous surfaces for both the days. A consistent decrement in the vinculin-stained area was observed with an increment in the nanopore diameter. One hundred-nanometer nanopore diameter was marked as the transition step for vinculin expression.c After day 1, maximum cell area was displayed by cells on 100 nm which decreased consistently with an increase in the nanopore diameter. After day 3, cells on 100 nm still displayed the maximum cell area. Least cell area was seen in cells on 200- and 220-nm nanoporous surfaces after both the days. One hundred-nanometer nanopore diameter was marked as the transition-inducing factor for cell area. * represents statistically signifi-cant values withp< 0.05, while ** represents highly significant values withp< 0.01
[image:5.595.58.539.87.222.2] [image:5.595.57.539.543.695.2]Alkaline Phosphatase Assay
Alkaline phosphatase activity was determined with alkaline phosphatase assay kit following the manufacturer’s instruc-tions (Abcam, Taiwan). Briefly, cells were seeded on control (flat) and nanosurfaces with different pore diameter. Alka-line phosphatase activity was analyzed after days 7, 10, and 14. First, the cells were lysed in 1× lysis buffer (Tris-Cl, PH 7.4, NaCl, EDTA, Triton X-100, PMSF, proteinase inhibitor cocktail tablet, and water), scraped, and centrifuged at 12,000gfor 2 min at 4 °C. Supernatants were removed and
then transferred to new Eppendorf tubes. UV/OD was used to define the protein concentrations. Twenty microliters of sample buffer and 100 μl of pNPP substrate were mixed and incubated in dark for 30 min. Measurements were taken at 405 nm on a multi-well plate reader.
Statistical Analysis
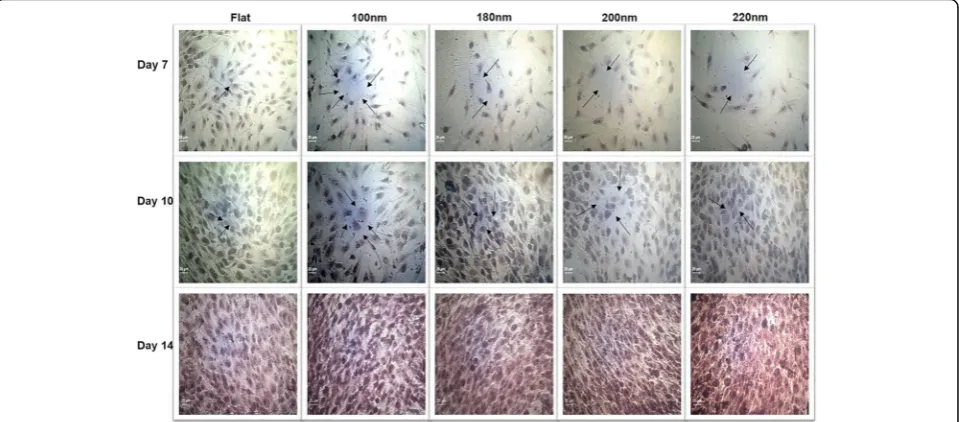
Results were expressed as the mean ± standard deviation ofn experiments (n≥3). For the statistical analysis, one-way analysis of variance followed by Tukey’s post-test Fig. 7Alizarin red S staining to visualize mineral calcium deposition. Cells were cultured on different nanoporous artificial microenvironments for 7, 10, and 14 days, and alizarin red S staining was then performed. Maximum staining intensity signifying maximum calcium mineral deposition was observed in cells on 100-nm nanoporous surfaces.Arrowspoint to the purple-stained sections on nanosurfaces. Mineral deposition maximized on day 14 in cells on 100-nm nanoporous surfaces.Scale barrepresents 25μm
Fig. 8Statistical analysis of alizarin red S staining and ALP assay in MG63 osteoblasts cultured over different nanoporous artificial
[image:6.595.59.539.89.300.2] [image:6.595.56.540.512.654.2](SPSS 13.0 software, Chicago, SA) was used, and the level of significance was set atP< 0.05. Highly significant values were expressed as ** with the level of significance <0.01.
Results
Fabrication of Nanoporous Surfaces
Nanoporous surfaces with a pore diameter of 98 ± 6, 180 ± 8, 197 ± 10, and 218 ± 12 were fabricated as de-scribed in “Fabrication of nanoporous surfaces” section. After electrolysis, the pore diameter was analyzed with the help of scanning electron microscopy (SEM) (Fig. 1a). Four nanoporous surfaces with different nanopore diam-eters were fabricated. The diameter of the nanopores was directly proportional to the bias voltage supplied during the fabrication procedure (Fig. 1b). For control surfaces, polished stainless steel substrates were used. The diameter of the nanoporous surfaces was well con-trolled and highly defined.
Nanoporous Surfaces Modulated the Osteoblast Cell Morphology, Spreading Area, and Growth
Osteoblast cells were cultured on different nanoporous surfaces having different pore diameter, for days 1 and 3, and the modulation in cell morphology was observed with the SEM. On day 1, the transition in cell morphology with the variation of nanopore diameter was identified (Fig. 2). Cells displayed a well-extended morphology with a pleth-ora of lamellipodia on the flat (control) and 100-nm nano-porous surfaces which transitioned to an abnormal/ shrunken morphology, accompanied with scarce lamelli-podia on the 200- and 220-nm nanopore surfaces (Fig. 2). On day 3, cells on 100 nm had comparatively more ex-tended morphology than on any other nanosurface (Fig. 2). However, no substantial difference was seen in the morph-ology as the nanopore size became more than 100 nm.
Transition in the cell spreading area corresponding to the nanopore diameter was identified. Cells on 100-nm nanoporous surfaces displayed more cell spreading area as compared to the cells on 200- and 220-nm nanopor-ous surfaces (Fig. 3a). The value of cell area on 100 nm nanoporous substrates was highly significant when com-pared to other nanoporous surfaces. A greater number of cells were observed on 100-nm nanoporous surfaces as compared to 200- and 200-nm nanoporous surfaces, indicating a greater cell growth on 100-nm nanoporous surfaces after days 1 and 3 (Fig. 3b). The amount of cell number on 100-nm nanoporous surfaces was also found to be highly significant (p< 0.01).
In summary, nanoporous surfaces induced a transition in the cell characteristics. The 100-nm nanoporous allowed the cells to have a well-extended morphology with a plethora of lamellipodia (Fig. 2), a greater cell spreading area (Fig. 3a) and promoted a greater cell growth (Fig. 3b).
Nanoporous Surfaces Modulated the Osteoblast Cell Cytoskeleton, Focal Adhesions, and Cell Adhesion
Transition in the number of focal adhesions from cells on to the various nanoporous surfaces was observed and identified by staining vinculin. Cells on 100-nm nano-porous surfaces stained vinculin at the point of contacts between cells and the surface (focal adhesions) as well as in the cytoplasm (Fig. 4). However, cells on 200- and 220-nm attenuated vinculin expression and thus stained vinculin primarily in the cytoplasm and displayed scarce focal adhesions (Fig. 4).
The number of focal adhesions per cell was counted, and transition step in increment or decrement with re-spect to control (flat) surfaces was identified and then plotted against the incubation time. After day 1, the number of focal adhesion was highest on cells grown on 100-nm nanoporous surfaces as compared to any other nanosurface (Fig. 5a). The values of focal adhesions on different days were found to be significant (p< 0.05). A consistent decrement was observed in the number of focal adhesion on cells cultured on 200- and 220-nm nanoporous surfaces (Fig. 5a). A similar trend yet a sig-nificantly greater difference was observed after day 3 (Fig. 5a). Cells on 100-nm nanoporous surfaces had twice the number of focal adhesions than the cells on flat surfaces. In addition, the focal adhesion number de-creased consistently with the increase of nanopore diam-eter. The number of focal adhesions on 200-nm nanoporous surface reached the control level (Fig. 5a). The vinculin-stained area per μm2 was also analyzed, and a trend consistent to the number of focal adhesions was observed (Fig. 5b). Vinculin-stained area was maxi-mized on 100-nm nanoporous surface. Nanopores with 100-nm diameter significantly promoted the expression of vinculin and the number of focal adhesions as com-pared to 200 and 220 nm (Fig. 5b).
A tight cytoskeleton representing a well-extended morphology was observed in cells cultured on 100-nm nanoporous surfaces but lost order in the cells cultured on 200- and 200-nm nanoporous surfaces after days 1 and 3 (Figs. 4 and 5c). In summary, a well-organized cell cytoskeleton with a plethora of focal adhesions was ob-served in cells cultured on 100-nm nanoporous surfaces. The 200- and 220-nm nanopore diameter retarded the cytoskeletal organization displaying an elongated or a shrunken morphology. Thus, the nanopore diameter played a vital role in the transition of vinculin expres-sion, focal adhesions, and cell cytoskeleton organization.
Nanoporous Surfaces Modulated the Cell Viability
tributed to the greater diameter of nanopores.
Nanoporous Surfaces Modulated the Osteoblast Mineralization
The extent of mineralization is an important factor to understand the osteoblast function. Alizarin red S stain-ing was used to study the extent of mineralization in os-teoblasts cultured on flat and nanoporous surfaces. Cells were harvested after days 7, 10, and 14, and quantitative measurement of mineralization was performed. The cal-cium deposits were stained purple. Nanopore diameter caused the transition in the extent of mineralization by the osteoblasts. After day 7, the amount of calcium de-posits were higher in cells cultured on 100-nm nanopor-ous surfaces than on 200- and 220-nm nanopornanopor-ous surfaces (Fig. 7). After day 10, mineralization extent was found to be highest on 100-nm nanoporous surfaces (Fig. 7). However, a consistent decrement was observed in cells cultured on 200- and 220-nm nanoporous sur-faces. Similar trend was seen after day 14 (Fig. 7). The highest mineralization amount was observed in cells seeded on 100-nm nanoporous surfaces. Thus, the nano-pore diameter was associated with causing the transition in the mineralization by the osteoblasts (Figs. 7 and 8a).
Nanoporous Surfaces Modulated the Alkaline Phosphatase Activity
A high concentration of phosphate is created at the mineralization front. Calorimetric alkaline phosphatase (ALP) assay was used to determine the modulation in the level of alkaline phosphatase secretion in response to nanoporous surfaces. Cells were cultured on different nanoporous surfaces for days 7, 10, and 14, and ALP ac-tivity was analyzed. ALP acac-tivity was measure at OD405nm. Nanopore diameter caused the transition in the ALP activity. After day 7, detectable quantity of ALP was observed on all nanoporous surfaces. However, significantly higher ALP activity was observed in cells cultured on 100 nm nanoporous surfaces than on any other nanoporous surface (Fig. 8b). After day 10, ALP activity was still the highest in cells cultured on 100-nm nanoporous surfaces. However, a consistent decrease was observed in cells cultured on 200- and 220-nm
the nanorealm should be the primary task for the aim of developing a biocompatible nanosurface. Multiple at-tempts have been made in the past by our research group to explore how different kinds of cells respond to different shapes and sizes of nanotopographies [4, 11]. We have shown that while cells respond favorably to tantalum oxide nanodots with size less than 50 nm, they display distinct characteristics of apoptosis such as an apoptotic morphology, scarce focal adhesions, and re-duced cell area when the nanodot size reaches 100 nm [5, 18, 20]. Thus, finding a suitable nanotopography shape and size or a particular application is rather hard. However, the choice of material on which nanotopogra-phies are engineered varies with its application. Stainless steel has been the primary choice of material for con-structing orthopedic, dental, or surgical implants due to the favorable combination of strength, fabrication prop-erties, and minimal in vivo cytotoxicity [28]. This is par-ticularly beneficial when compared to other materials such as alumina and zirconia which display undesirable surface properties, uncontrollable degradation, and utilizing un-common techniques for fabrication [29]. Another import-ant aspect which may help the biomedical engineers to develop more biocompatible geometries for applications as implants is identifying the transition step in the modulation of cell characteristics and behavior.
100 nm promoted cell growth while 200- and 220-nm nanoporous surfaces affected the cell growth negatively (Fig. 3b). These results were further confirmed when cel-lular cytoskeleton and focal adhesions (vinculin) were stained. Cellular cytoskeleton was ordered (Fig. 4) with cells displaying a plethora of focal adhesions (Fig. 5a, b) on to the nanosurface. Focal adhesions are important for cell attachment, and thus, growth [30]. It is therefore a reasonable conclusion that 100-nm nanoporous surfaces provided a friendly environment for the cells to attach and grow which led to their ordered, well-extended cyto-skeleton (Fig. 5c) and morphology while and 200-nm nanoporous surfaces caused cell death due to scarce focal adhesions (Fig. 5a). In addition, these results are consistent with our previous studies on nanodots where cells on 200-nm nanodots displayed an apoptotic morphology with very few focal adhesions [20]. Also, our studies on fibroblasts have proved that nanotopogra-phies with size 200 or more do not trigger the cells to activate integrins, necessary for focal adhesion formation [21]. Consequently, cells on 100-nm nanoporous sur-faces displayed maximum vinculin-stained area than on any other nanosurface.
For applications as implants, culturing cells over the material for an extended period of time is very crucial. Previous studies have shown that when the topography size became more than 50 nm, reduction in mineralization was observed [18]. While in the previous study nanodots were investigated as an appropriate material, [31–33] in this study, nanoporous topography was investigated. Thus, a small variation in the size of the nanotopography suit-able for orthopedic implant application is reasonsuit-able. The results of alizarin red staining (Figs. 7 and 8a) and the measurement of alkaline phosphatase activity (Fig. 8b) were not only consistent with our previous studies [18] but also with the other results of this study where cells displayed enhanced cell characteristics on 100 nm than on any other nanopore diameter. At the moment, the only possible explanation of why some nanosurface shapes and sizes trigger the cells to respond in a way as if they were growing in vivo can be the partially resemblance of the in vivo ECM components.
While the focus of this study was stainless steel, other materials such as titanium dioxide [34], tantalum oxide [18], nickel [35], nickel-titanium alloys [36], ceramics [37], polystyrene [38], glass [39], and plastic [40] have also been exploited to study the osteoblast behavior. However, the osteoblast behavior as a function of nano-pore diameter has never been studied before. Moreover, the effect of nanopore diameter in acting as a transition step to modulate the cell behavior has also never been identified. Of course, other nanosurface factors such as surface roughness and nanopore depth may also affect the cell behavior along with other possible application of
these nanoporous surfaces as cardiac implants, which will remain to be the subject of the future studies. Im-portantly, just as any biomaterial, stainless steel too pos-sesses certain disadvantages such as mild corrosion and mismatch of physical properties with the soft tissue adja-cent to the bone. However, these difficulties can be par-tially overcome by coating the substrates with oxides such as those tantalum. Therefore, overcoming these dif-ficulties to generate a highly biocompatible biomaterial will remain to be the focus of upcoming studies. Collect-ively, the results of this study demonstrate the role of nanoporous topography in modulating the osteoblast cell behavior, in addition to identifying the nanopore diameter causing the transition in the cell behavior. Spe-cifically, the results of this study can be utilized in the design of orthopedic implant nanosurface. In general, applications in the fields of biomedical, tissue engineer-ing, and cancer research are expected.
Conclusions
In the present study, the role of nanoporous stainless steel geometries in causing transition in osteoblast cell charac-teristics such as cell morphology, spreading area, growth, viability, focal adhesions, and function was investigated. Transition step causing the modulation in the osteoblast cell behavior was identified, and accordingly, an optimized nanosurface geometry for application as an orthopedic im-plant was proposed. According to the results of this study, nanoporous stainless steel surfaces with the nanopore diameter of 100 nm can serve as ideal orthopedic im-plants. The findings of this study may help the biomedical engineers to engineer nanotopographies which improve cell-nanosurface interactions, ultimately leading to opti-mized geometries for applications as implants. Addition-ally, applications in the fields of biomedical, tissue engineering, and cancer research are expected.
Abbreviations
ALP:Alkaline phosphatase; BSA: Bovine serum albumin; C: Carbon; Co2: Carbon dioxide; Cr: Chromium; Cu: Copper; Dapi: 4′ ,6-diamidino-2-phenylindole; DMEM: Dulbecco modified Eagle’s medium; ECM: Extracellular matrix; EDTA: Ethylene diamine tetraacetic acid; FBS: Fetal bovine serum; FITC: Fluorescein isothiocyanate; IF: Immunofluorescence; Mn: Manganese; Mo: Molybdenum; N: Nitrogen; NaCl: Sodium chloride; Ni: Nickel; OD: Optical density; SEM: Scanning electron microscopy; UV: Ultraviolet
Acknowledgements
The authors would like to thank Mr. Hoang-Giang, Cao for the artwork and Mr. Tahta Amrillah and Mr. Nguyen Van Chien for the technical assistance with the characterization.
Funding
This study was funded by the Taiwan Ministry of Science and Technology under grant numbers (MOST 105-2633-B-009-003 and MOST 105-2622-E-009-008-CC2).
Authors’Contributions
Zhongxiao E Road, Taipei City 106, Taiwan, ROC.3Department of Biological
Science and Technology, National Chiao Tung University, 1001 University Road, Hsinchu 300, Taiwan, ROC.
Received: 21 November 2016 Accepted: 23 December 2016
References
1. Curtis A, Wilkinson C (1999) New depths in cell behaviour: reactions of cells to nanotopography. Biochem Soc Symp 65:15–26
2. Dalby MJ, Gadegaard N, Oreffo ROC (2014) Harnessing nanotopography and integrin-matrix interactions to influence stem cell fate. Nat Mater 13(6):558–69 3. Kim DH, Provenzano PP, Smith CL, Levchenko A (2012) Matrix
nanotopography as a regulator of cell function. J Cell Biol 197(3):351–60 4. Lee CH, Cheng YW, Huang GS (2014) Topographical control of cell-cell
interaction in C6 glioma by nanodot arrays. Nanoscale Res Lett 9(1):250. 5. Mohiuddin M, Pan HA, Hung YC, Huang GS (2012) Control of growth and
inflammatory response of macrophages and foam cells with nanotopography. Nanoscale Res Lett 7:1–9
6. Lim JY, Hansen JC, Siedlecki CA, Runt J, Donahue HJ (2005) Human foetal osteoblastic cell response to polymer-demixed nanotopographic interfaces. J Roy Soc Interface 2(2):97–108
7. Driscoll MK, Sun XY, Guven C, Fourkas JT, Losert W (2014) Cellular contact guidance through dynamic sensing of nanotopography. ACS Nano 8(4):3546–55
8. Lu YL, Cheng CM, Leduc PR, Ho MS (2008) Controlling the mechanics and nanotopography of biocompatible scaffolds through dielectrophoresis with carbon nanotubes. Electrophoresis 29(15):3123–7
9. Teo BKK, Wong ST, Lim CK, Kung TYS, Yap CH, Ramagopal Y et al (2013) Nanotopography modulates mechanotransduction of stem cells and induces differentiation through focal adhesion kinase. ACS Nano 7(6):4785–98 10. Li JY, Wang M, Shen YB (2012) Chemical modification on top of
nanotopography to enhance surface properties of PDMS. Surf Coat Tech 206(8-9):2161–7
11. Dhawan U, Lee CH, Huang CC, Chu YH, Huang GS, Lin YR, et al (2015) Topological control of nitric oxide secretion by tantalum oxide nanodot arrays. J Nanobiotechnol 13
12. Pan HA, Hung YC, Sui YP, Huang GS (2012) Topographic control of the growth and function of cardiomyoblast H9c2 cells using nanodot arrays. Biomaterials 33(1):20–8
13. Park J, Bauer S, Schmuki P, von der Mark K (2009) Narrow window in nanoscale dependent activation of endothelial cell growth and differentiation on TiO2 nanotube surfaces. Nano Lett 9(9):3157–64 14. Wang J, Petefish JW, Hillier AC, Schneider IC (2015) Epitaxially grown
collagen fibrils reveal diversity in contact guidance behavior among cancer cells. Langmuir 31(1):307–14
15. Berry CC, Dalby MJ, McCloy D, Affrossman S (2005) The fibroblast response to tubes exhibiting internal nanotopography. Biomaterials 26(24):4985–92 16. Carson D, Hnilova M, Yang X, Nemeth CL, Tsui JH, Smith AS, et al. (2016)
Nanotopography-induced structural anisotropy and sarcomere
development in human cardiomyocytes derived from induced pluripotent stem cells. ACS Appl Mater Interfaces 8(34):21923–32.
17. Castro-Raucci LMS, Francischini MS, Teixeira LN, Ferraz EP, Lopes HB, de Oliveira PT et al (2016) Titanium with nanotopography induces osteoblast differentiation by regulating endogenous bone morphogenetic protein expression and signaling pathway. J Cell Biochem 117(7):1718–26
Biomaterials 31(6):1299–306
23. Ward BC, Webster TJ (2006) The effect of nanotopography on calcium and phosphorus deposition on metallic materials in vitro. Biomaterials 27(16):3064–74
24. Zhu BS, Lu QH, Yin J, Hu J, Wang ZG (2005) Alignment of osteoblast-like cells and cell-produced collagen matrix induced by nanogrooves. Tissue Eng 11(5-6):825–34
25. Bordji K, Jouzeau EY, Mainard D, Payan E, Delagoutte JP, Netter P (1996) Evaluation of the effect of three surface treatments on the biocompatibility of 316L stainless steel using human differentiated cells. Biomaterials 17(5):491–500
26. Martinesi M, Bruni S, Stio M, Treves C, Bacci T, Borgioli F (2007) Biocompatibility evaluation of surface-treated AISI 316L austenitic stainless steel in human cell cultures. J Biomed Mater Res A 80A(1):131–45 27. Roguska A, Hiromoto S, Yamamoto A, Wozniak MJ, Pisarek M, Lewandowska
M (2011) Collagen immobilization on 316L stainless steel surface with cathodic deposition of calcium phosphate. Appl Surf Sci 257(11):5037–45 28. Cadosch D, Chan E, Gautschi OP, Simmen HP, Filgueira L (2009)
Bio-corrosion of stainless steel by osteoclasts—in vitro evidence. J Orthop Res 27(7):841–6
29. Balamurugan A, Rajeswari S, Balossier G, Rebelo AHS, Ferreira JMF (2008) Corrosion aspects of metallic implants—an overview. Mater Corros 59(11): 855–69
30. Mitra SK, Hanson DA, Schlaepfer DD (2005) Focal adhesion kinase: in command and control of cell motility. Nat Rev Mol Cell Bio 6(1):56–68 31. Webster TJ, Siegel RW, Bizios R (1999) Osteoblast adhesion on nanophase
ceramics. Biomaterials 20(13):1221–7
32. Olivares-Navarrete R, Raines AL, Hyzy SL, Park JH, Hutton DL, Cochran DL et al (2012) Osteoblast maturation and new bone formation in response to titanium implant surface features are reduced with age. J Bone Miner Res 27(8):1773–83
33. Loty C, Sautier JM, Tan MT, Oboeuf M, Jallot E, Boulekbache H et al (2001) Bioactive glass stimulates in vitro osteoblast differentiation and creates a favorable template for bone tissue formation. J Bone Miner Res 16(2):231–9 34. Martin JY, Dean DD, Cochran DL, Simpson J, Boyan BD, Schwartz Z (1996)
Proliferation, differentiation, and protein synthesis of human osteoblast-like cells (MG63) cultured on previously used titanium surfaces. Clin Oral Implan Res 7(1):27–37
35. Dhawan U, Wang SM, Chu YH, Huang GS, Lin YR, Hung YC, Chen WL Nanochips of Tantalum Oxide Nanodots as artificial-microenvironments for monitoring Ovarian cancer progressiveness. Sci Rep 6:31998.
36. Dhawan U, Pan HA, Lee CH, Chu YH, Huang GS, Lin YR, Chen WL (2016) Spatial Control of Cell-Nanosurface Interactions by Tantalum Oxide Nanodots for Improved Implant Geometry. PLOS ONE 11 (6):e0158425. 37. Dhawan U, Pan HA, Chu YH, Huang GS, Chen PC, Chen WL (2016) Temporal
Control of Osteoblast Cell Growth and Behavior Dictated by Nanotopography and Shear Stress. IEEE Trans Nanobioscience 15(7):704–712.
38. Brammer KS, Frandsen CJ, Jin S (2012) TiO2 nanotubes for bone regeneration. Trends Biotechnol 30(6):315–22
39. Mikulewicz M, Chojnacka K (2011) Cytocompatibility of medical biomaterials containing nickel by osteoblasts: a systematic literature review. Biol Trace Elem Res 142(3):865–89