http://dx.doi.org/10.4236/cs.2016.78106
Design and Efficient Controller for Micro
Turbine System
G. Saravanan1, I. Gnanambal2
1Department of Electrical and Electronics Engineering, Sona College of Technology, Salem, India 2Department of Electrical and Electronics Engineering, Government College of Engineering, Salem, India
Received 18 March 2016; accepted 20 April 2016; published 7 June 2016
Copyright © 2016 by authors and Scientific Research Publishing Inc.
This work is licensed under the Creative Commons Attribution International License (CC BY). http://creativecommons.org/licenses/by/4.0/
Abstract
In this modern era, power generation seems to be a very demanding factor. New models and me-thods have been proposed to derive from various natural and manmade resources. In such in-stances, this paper gives a detailed report on the power generation from Micro Turbines. Micro turbine plays a very important role in electric power generation. Especially they are used in the combined cycle process power plants. The parameters of Rowen’s model 265-MW single shaft heavy duty gas turbines which are used in dynamic studies are estimated in this paper using the operational and performance data. These data are also used to briefly explain the extraction of parameters of the used model. Micro turbine parameters are approximated using simple thermo-dynamics assumptions. Micro turbine power generation seems to be an uprising and a promising source and an exact design with a perfect model is capable of producing the highest efficiency. Thus this paper is proposed on the aspects of social awareness to elaborate the control design of Micro Turbine Power Generation System. The parameters of micro turbine models are derived and the results of several simulated tests using Matlab/Simulink are presented.
Keywords
Dynamic Simulation, Micro Turbine, Control Design
1. Introduction
genera-tion. They also have secure and reliable operating systems. Micro turbine is widely used in distributed power and combined heat and power applications. Micro turbines are small gas turbines which burn gaseous or liquid fuels to create a high energy gas stream that operates an electric generator. Micro turbines are capable of burning number of fuels at high and low pressure levels. The pressure ratio over the compressor is low, around 4, com-pared to other gas turbines. The compressor and the turbine are 0.15 m in diameter and the entire enclosure is only 2.92 × 1.90 × 0.87 meters. This makes installation easy.
Micro turbine is small combustion turbine, which is approximately the size of a refrigerator, with outputs of 25 kW to 500 kW. It thus provides a variety of opportunities to meet the applications of distributed power sys-tems. Distributed generation provides a wide range of services to consumers and utilities, including standby generation, peak shaving capability, base load generation and co-generation. Our proposed system develops several models with different degrees of simplification for the representation of gas turbines in dynamic studies have introduced, amongst which the IEEE model for combined cycle power plants had deeper sight into internal processes. The paper is organized into existing systems, proposed system, implementation and its performance. Literature related with the proposed systems is discussed in Chapter 2. Chapter 3 deals with the working progress of micro turbine. Chapter 4 discusses the mechanism used for the control systems for a 265-MW Micro Turbine. The performance analysis is detailed in Chapter 5. Chapter 6 concludes with a few points as to the scope for future enhancement.
2. Literature Survey
[1] presents the results of an investigation regarding the electrical performance characteristics of a new, three-phase, 480 V (L-L), 30 kW, micro-turbine generator and its suitability as an electrical power source for applications at the electrical power distribution voltage level. In this work [2] discusses micro-turbine and fuel cell models, and the instanteous power issue. [3] presents simplified slow dynamic model for micro turbines and fuel cells. Their stand-alone dynamic performances are analyzed and evaluated. It is illustrated that micro tur-bines and fuel cells are capable of providing load following service, significantly enhancing their economic val-ue. Recently, more attention has been paid to the high-speed generator driven by micro-turbine due to its simple structure and high power density. In this work [4], a method to reduce harmonic current in high-speed generator for a distributed power system is presented. Because no additional hardware is needed, the proposed method can be used for various power systems. The detecting and eliminating method of harmonic current components based on hysteresis control strategy of the active power filter using start-up inverter are discussed in detail. In this work [5] develops the model of a PMSG wind turbine and then simulates short circuits to evaluate the per-formance of the system during short circuit fault.
Since PMSG wind turbine systems use a double conversion converter, this paper develops two methods for controlling the converter, a new protection method for capacitor over voltage is also evaluated in this paper [6]. The interconnection of MW scale micro-turbine as a set of small, modular generation system at the LV distribu-tion level has a significant impact on micro-grid performance.
According to the dynamic characteristics of the Micro-turbine system, a complete mathematic model which considers the Micro-turbine and other electrical components as a whole is established in PACAD/EMTDC. In [7], the parameters of rowan’s model for heavy duty gas turbines in dynamic studies are estimated by use of available operational and performance data. A 172-MW simple cycle, single shaft heavy duty gas turbine and its available operational data are also presented and studied for deriving the parameters of the model.gas turbine parameters are approximated by using simple thermodynamic assumptions, resulting in good corresponding with typical values. In this work presents modeling [8] and performance analysis of MTG system in grid connected and islanding modes of operation. The modeling of a single-shaft micro-turbine generation system suitable for isolated distributed generation applications has been discussed in [9]. Relative researches have also been done on the modeling of micro turbine system [10].
3. Micro Turbine
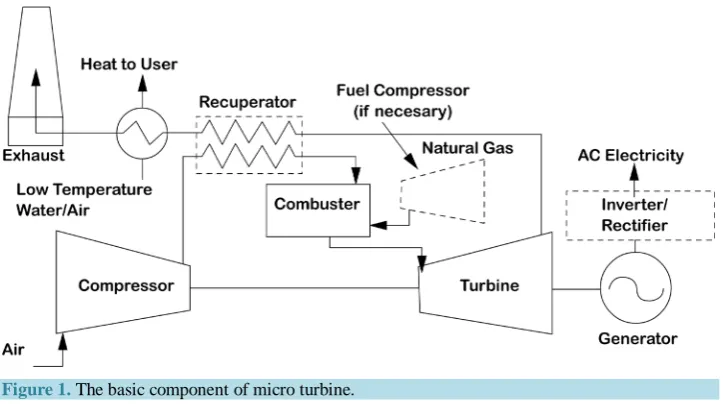
Figure 1. The basic component of micro turbine.
unit, which is commonly mounted on a single shaft along with the electrical generator.
The working progress of the micro turbine can be described as follows: air, at atmosphere pressure, enters the Micro turbine at the compressor inlet. When the air is compressed to achieve the most favourable conditions for combustion, fuel gas is mixed with the compressed air in the combustion chamber. This result in combustion of fuel and the hot exhaust gases are expanded through the turbine to produce the mechanical power.
The system is considered to operate under normal operating conditions and the fast dynamics of the micro turbine (e.g., start-up, shutdown, internal faults and loss of power) are neglected. Speed control is operated on the speed error, which is computed as the difference between a reference speed and the Micro turbine generation rotor speed. It is usually modeled by using a lead-lag transfer function; and is the primary means of control for the Micro turbine under partial load conditions.
The output of the governor goes to a low value select to produce a value for Vce, the fuel demand signal. If the
operating speed of the system is close to its rated speed, the acceleration control could be eliminated in the mod-eling. The output of low value selector represents the least amount of fuel required for that particular operating point and is denoted as “Vce”. The per unit value for “Vce” corresponds directly to the per unit value of
mechan-ical power on turbine base in steady state. The output of the low value selector is compared with maximum and minimum limits. The maximum limit acts as back up to temperature control and is not encountered in normal operation and minimum limit is more important dynamically. The output of the “Vce” limiter is multiplied by
0.77 and offset by no load fuel flow value to ensure the continuous combustion process. The fuel flow controls are represented by series of blocks including the valve position and flow dynamics.
The other signal into the low value select is from the temperature controller. The fuel flow, burned in the combustor results in turbine torque and in exhaust gas temperature measured by a thermocouple. The output from the thermocouple is compared with a reference value, which is usually higher. This enables the tempera-ture control output to remain on the maximum limit, thus resulting in uninhibited governor/speed control. When the thermocouple output exceeds the reference temperature, the temperature control output starts decreasing. When this output becomes lower than the governor output, the former value will pass through the low value se-lect to limit the output, and the unit will operate on temperature control.
4. Controller for Micro Turbine
heat release in the combustor, while the second delay is between the fuel combustion and exhaust temperature measuring system. A relatively higher time lag exists in the compressor discharge path to turbine inlet. The overall control model of the Micro turbine is shown in Figure 2. The values of the controller parameters ob-tained are in the range of the typical values which are usually used for Micro turbine dynamic models [11].
5. Model Simulation
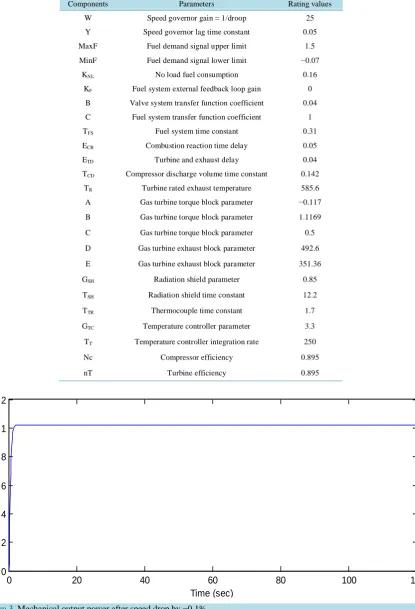
The derived and assumed parameters in previous section are used to simulate the behavior of 265-MW micro turbine. In Table 1,all parameters of model in Figure 2 are reviewed and listed again. All obtained values of the controllers parameters are in the range of the typical values which are usually used for Micro turbine dynamic models.
Results and Discussion
A 265-MW Micro turbine is simulated against two cases of −0.1% and −0.5% step decrease in speed, while op-erating in nominal conditions. The speed-governor droop of 4% is assumed for the simulation.
Considering the case of −0.1% step decrease in speed, the value of 1.02 p.u is observed for the mechanical power as shown in Figure 3. Figure 4 shows the exhaust temperature of the gas turbine which is measured by the thermocouple, where a final steady state temperature of 585˚C is observed and the temperature control is not activated. The Output of the frequency-load controller (FD) is all time lower than the output of the temperature
controller (Tc) as shown in Figure 5. The frequency-load controller (FD) output, which is the lowest value as
shown in Figure 6, is then given as input to the saturation block. The output of this block is shown in Figure 7. Therefore, the frequency-load controller output passes through the minimum gate and controls the fuel flow to the combustion chamber, which is shown in Figure 8.
Table 1. Parameters values of micro turbine controller.
Components Parameters Rating values
W Speed governor gain = 1/droop 25
Y Speed governor lag time constant 0.05
MaxF Fuel demand signal upper limit 1.5
MinF Fuel demand signal lower limit −0.07
KNL No load fuel consumption 0.16
KF Fuel system external feedback loop gain 0
B Valve system transfer function coefficient 0.04
C Fuel system transfer function coefficient 1
TFS Fuel system time constant 0.31
ECR Combustion reaction time delay 0.05
ETD Turbine and exhaust delay 0.04
TCD Compressor discharge volume time constant 0.142
TR Turbine rated exhaust temperature 585.6
A Gas turbine torque block parameter −0.117
B Gas turbine torque block parameter 1.1169
C Gas turbine torque block parameter 0.5
D Gas turbine exhaust block parameter 492.6
E Gas turbine exhaust block parameter 351.36
GSH Radiation shield parameter 0.85
TSH Radiation shield time constant 12.2
TTR Thermocouple time constant 1.7
GTC Temperature controller parameter 3.3
TT Temperature controller integration rate 250
Nc Compressor efficiency 0.895
nT Turbine efficiency 0.895
Figure 3. Mechanical output power after speed drop by −0.1%.
0 20 40 60 80 100 120
0 0.2 0.4 0.6 0.8 1 1.2
Time (sec)
M
ec
hani
c
al
P
ow
er
(
p.
[image:5.595.111.527.105.714.2]Figure 4. Temperature measurement after turbine speed step of −0.1%.
Figure 5. Temperature controller against −0.1% turbine speed deviation.
Figure 6. Frequency load controller −0.1% turbine speed deviation.
0 20 40 60 80 100 120
0 100 200 300 400 500 600 700
Time (sec)
M
eas
ur
ed E
x
ht
.T
em
p
0 20 40 60 80 100 120
0.95 1 1.05 1.1 1.15
Time (sec)
T
em
per
at
ur
e C
ont
rol
ler
(
p.
u)
0 20 40 60 80 100 120
1 1.005 1.01 1.015 1.02 1.025 1.03 1.035
Time (sec)
F
requenc
y
Load C
ont
rol
ler
(
p.
Figure 7. After saturation against −0.1% micro turbine speed deviation.
Figure 8. Fuel demand after turbine speed step of −0.1%.
Figure 9. Temperature controller against −0.5% turbine speed deviation.
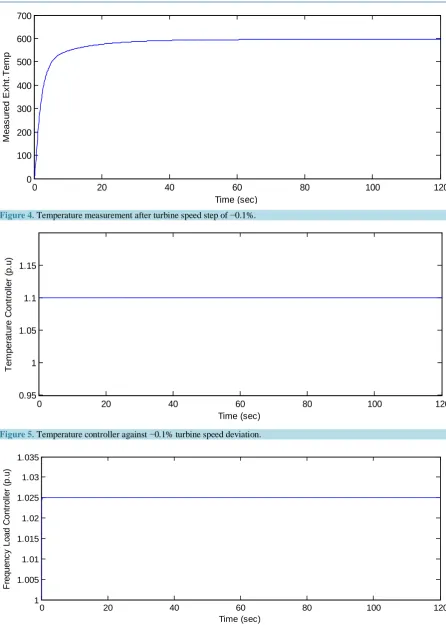
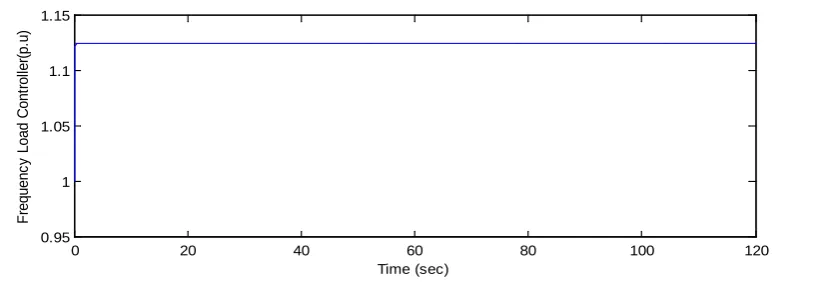
The second scenario with −0.5% step in turbine speed would lead to the activation of the temperature control, as shown in Figure 9. Figure 10 shows the mechanical output power, where a final value close to 1.08 p.u is noted. The power output remains constant until temperature control activation, i.e., until 50 sec. The measured exhaust increases during this period, which is ~50 s, until the temperature reaches a value of 625˚C. This is shown in Figure 11. The temperature control activation forces the exhaust temperature to decline to its rated value of 585˚C at the expense of decrease in the output power, which is illustrated in Figure 10. The behavior of the turbine speed deviation after saturation and that of fuel demand is illustrated in Figure 12 & Figure 13 re-spectively.Figure 14 ensures this meaning where the output of the frequency-load controller (FD).
0 20 40 60 80 100 120
1 1.005 1.01 1.015 1.02 1.025 1.03 1.035
Time (sec)
A
ft
er
S
at
ur
at
ion (
s
ec
)
0 20 40 60 80 100 120
0 0.2 0.4 0.6 0.8 1 1.2
Time (sec)
F
uel
D
em
and (
p.
u)
0 20 40 60 80 100 120
0.95 1 1.05 1.1 1.15 1.2
Time (sec)
T
em
per
at
ur
e C
ont
rol
ler
(
p.
Figure 10. Mechanical output power after speed drop by −0.5%.
Figure 11. Temperature measurement after turbine speed step of −0.5%.
Figure 12. After saturation against −0.5% turbine speed deviation.
Figure 13. Fuel demand after turbine speed step of −0.5%.
0 20 40 60 80 100 120
0.95 1 1.05 1.1 1.15
Time (sec)
M
ec
hani
c
al
P
ow
er
(pu)
0 20 40 60 80 100 120
0 200 400 600 800
Time (sec)
M
eas
ur
ed E
x
haus
t T
em
per
at
ur
e
0 20 40 60 80 100 120
0.95 1 1.05 1.1 1.15 1.2
Time (sec)
A
ft
er
S
at
ur
at
ion (
p.
u)
0 20 40 60 80 100 120
0.95 1 1.05 1.1 1.15 1.2 1.25
Time (sec)
F
uel
D
em
and (
p.
Figure 14. Frequency load controller against −0.5% turbine speed deviation.
6. Conclusion
This paper proposes a control design of micro turbine generation system. A 265-MW micro turbine model is considered and its parameters are extracted successfully after performing several simulation tests. These para-meters can be used in dynamic studies for many purposes. Simple physical law and simplifications can be used by trainers to learn the concepts or make simple numerical examples based on the data of existing units. The si-mulation tests are conducted using Matlab/Simulink and the results obtained are discussed. As an extension of this work the PI controller is to be replaced by Fuzzy logic controller in a Matlab/Simulink operating system.
References
[1] Etezadi-Amoli, M. and Choma, K. (2001) Electrical Performance Characteristics of a New Micro-Turbine Generator. 2001 IEEE Power Engineering Society Winter Meeting, Columbus, 28 January-1 February 2001, 736-740.
[2] Lasseter, R. (2001) Dynamic Models for Micro-Turbines and Fuel Cells. Power Engineering Society Summer Meeting, Vancouver, 15-19 July 2001, 761-766.
[3] Zhu, Y. and Tomsovic, K. (2002) Development of Models for Analyzing the Load Following Performance of Micro turbines and Fuel Cells. Electric Power Systems Research, 62, 1-11. http://dx.doi.org/10.1016/S0378-7796(02)00033-0 [4] Zong, M., Wang, F.X., Wang, Z. and Zhang, F.G. (2004) Research on Active Power Filter for Distributed Power
Sys-tem of High-Speed Generator Driven by Micro-Turbine Power SysSys-tem Technology. 2004 International Conference on Power System Technology, China, 21-24 November 2004, 788-791.
[5] Abedini, A. and Nasiri, A. (2007) PMSG Wind Turbine Performance Analysis During Short Circuit Faults. IEEE Canada Electrical Power Conference, Montreal, 25-26 October 2007, 160-165.
[6] Huang, W., Zhang, J.H., Wu, Z.P. and Niu, M. (2008) Dynamic Modelling and Simulation of a Micro-Turbine Genera-tion System in the Microgrid. 2008 IEEE International Conference on Sustainable Energy Technologies, Singapore, 24-27 November 2008, 345-350.
[7] Tavakoli, M., Vahidi, B. and Gawlik, W. (2009) An Educational Guide to Extract the Parameters of Heavy Duty Gas Turbines Model in Dynamic Studies on Operational Data. IEEE Transactions on Power Systems, 24, No. 3.
[8] Nayak, S.K. and Gaonkar, D.N. (2012) Modeling and Performance Analysis of Microturbine Generation System in Grid Connected/Islanding Operation. International Journal of Renewable Energy Research, 2, No. 4.
[9] de Mello, F.P. and Ahner, D.J. (1994) Dynamic Models for Combined Cycle Plants in Power Studies. EEE
Transac-tions on Power Systems, 9, 1698-1708. http://dx.doi.org/10.1109/59.336085
[10] Hannet, L.N. and Khan, A.H. (1993) Combustion Turbine Dynamic Model Validation from Tests. IEEE Transactions
on Power Systems, 8, 152-158. http://dx.doi.org/10.1109/59.221261
[11] Vahidi, B., Tavakoli, M. and Gawlik, W. (2007) Determining Parameters of Turbine’s Model Using Heat Balance Data of Steam Power Unit for Educational Purposes. IEEE Transactions on Power Systems, 22, No. 4.
http://dx.doi.org/10.1109/TPWRS.2007.907509
0 20 40 60 80 100 120
0.95 1 1.05 1.1 1.15
Time (sec)
F
requenc
y
Load C
ont
rol
ler
(p.