Munich Personal RePEc Archive
The Export Performance of the Euro
Area countries in the period 1996-2007
Cafiso, Gianluca
Univeristy of Catania, Economics Department
July 2009
Online at
https://mpra.ub.uni-muenchen.de/20263/
The Export Performance
of t he Euro Area count ries in t he period 1996-2007
Gianluca Cafiso
Abst ract
This paper st udies t he export performance of t he Euro Area and t he majorit y of t he Euro Area count ries t hrough a Const ant M arket Share Analysis. We keep a special focus on t he t hree largest count ries: Germany, France and It aly. The Const ant M arket Share Analysis provides a breakdow n of an economy’s export performance int o t he separat e component s t hat are due t o a St ructure Effect , result ing from t he product and dest inat ion market of it s export s, and a broad Compet it iveness Effect w hich is a residual cat egory assumed t o capt ure bot h price and non-price com pet it iveness.
JEL codes: F10, F14
Keyw ords: Const ant M arket Share Analysis, Export Performance, Specializat ion, Compet it iveness, Euro Area.
July 2009
[Preliminary Draft]
I. Introduction
The aim of t his paper is t o underst and how t he pat t ern of indust rial specializat ion has influenced
t he export performance of t he Euro Area (EAA) as a w hole and of t he single EAA count ries. We
keep a special focus on t he t hree largest EAA count ries: Germany, France and It aly.1 The analyt ical
t ool employed is t he Const ant M arket Share Analysis (CM SA) applied t o nom inal export flow s
out side t he Euro Area.2 The period t hat w e consider for t his st udy is t he closest in t ime w it h
available dat a: 1996-2007.
The general idea behind t he CM SA is t hat t he product and geographical st ruct ure of a count ry’s
export s can affect it s t ot al export grow t h. In simple t erms, if a count ry is more specialized in
export product s and dest inat ion market s w here demand is st rong in comparison t o ot her product s
and market s, t hen t he count ry’s aggregat e export market share w ill t end t o rise. The CM SA builds
on t his idea by providing a breakdown of a count ry’s export performance int o t he separat e
component s t hat are due t o a St ruct ure Effect (result ing from t he product and dest inat ion market
specialisat ion of it s export s) and a broad Compet it iveness Effect (ie, a residual cat egory w hich is
assumed t o be capt uring price and non-price compet it iveness). The analysis is carried out on
export s in value t erms, w hich is t he usual met hodology for CM SA given t hat t he necessary dat a
disaggregat ed by sect or and dest inat ion are usually only available in values but not in volumes.
2. M ethodology and Data
A Const ant M arket Share Analysis (CM SA) decomposes t he variat ion in t he aggregate export
market share (values) of a count ry int o t w o main component s: (a) t he st ruct ure of export s, and (b)
compet it iveness. Various met hodologies can be used t o carry out a CM SA (Simonis 2000), but t he
met hodology used here is t he same as ESCB (2005). In simple t erms, t he analysis explains t he
export grow t h-rat e different ial bet w een t he export s of a specific count ry (defined as “ E” ) and t he
export of a reference count ry or group of count ries (“ W” ).3 The different ial is called t he Tot al
Effect (TE), if t he TE is posit ive over t he chosen sample period, t hen count ry E’s export share has
increased.
Total Effect =
gTX
tE
gTX
tW,
1
We st udy t he ot her EAA countries as well, t he result s for these count ries are in appendix II. 2
Not e t hat in our analysis t he export-perform ance relat es t o t rade out side t he EAA (ie, int ra-EAA export flow s are excluded).
3
w here
gTX
tE is t he grow t h rat e of count ry E’s aggregate export ;gTX
tWis t he grow t h rat e of t hereference group’s export s (“ W” ).
The analysis consist s of a t w o-level decomposit ion: first , t he Tot al Effect is decomposed int o t he
St ruct ure and Compet it iveness effect s; second, t he St ruct ure Effect is decom posed int o t he
Product , M arket and M ixed Effect s.
Total Effect = Structure Ef + Competitiveness Ef
Structure Effect =Market Ef + Product Ef + Mixed Ef
The St ruct ure Effect is t he core calculat ion of t he CM SA. Indeed, t he St ruct ure Effect is t he amount
of t he grow t h rat e different ial t hat one w ould observe if count ry E’s export share remains
const ant in every product / dest inat ion market . The SE is t herefore a benchmark grow t h-rat e
different ial based on t he export st ruct ure (product / market specializat ion). The difference bet w een
t he Tot al Effect and t he St ruct ure Effect is t he Compet it iveness Effect (i.e., bet w een t he observed
and t he benchmark value). Accordingly, t he com pet it iveness effect is implicit ly a residual of t he
analysis w hose int erpret at ion is difficult given t he many fact ors w hich, in addit ion t o t he St ruct ure
Effect , det ermine a count ry’s export performance. The int uit ion for each effect is provided in t he
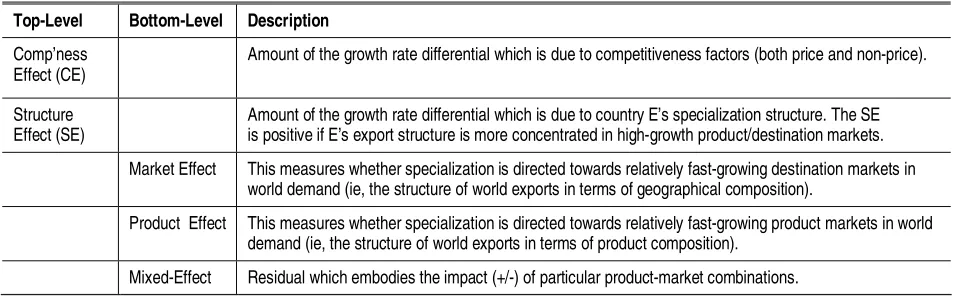
[image:4.595.50.534.480.628.2]follow ing t able.
Table 1. Explanation of the different effects
Top-Level Bottom-Level Description
Comp’ness Effect (CE)
Amount of the growth rate differential which is due to competitiveness factors (both price and non-price).
Structure Effect (SE)
Amount of the growth rate differential which is due to country E’s specialization structure. The SE is positive if E’s export structure is more concentrated in high-growth product/destination markets. Market Effect This measures whether specialization is directed towards relatively fast-growing destination markets in
world demand (ie, the structure of world exports in terms of geographical composition).
Product Effect This measures whether specialization is directed towards relatively fast-growing product markets in world demand (ie, the structure of world exports in terms of product composition).
Mixed-Effect Residual which embodies the impact (+/-) of particular product-market combinations.
Given t he follow ing export concept s:
i , jk t
x
, count ry i ‘s export of good k t o count ry j at t ime t (i=E,W; j=1,…,J; k=1,…,K; t =1,…,T), , ,
1
J
i i
k t j jk t
X
x
, count ry i’s t ot al export of good k at t ime t , , ,
1
K
i i
j t k jk t
X
x
, count ry i’s t ot al export t o count ry j at t ime t , ,
1 1
K J
i i
t k j jk t
, , 1 ,
, 1
i i jk t jk t i
jk t i jk t
x
x
g
x
, grow t h rat e of count ry i‘s export of good k t o count ry j at t ime t , 1 , , , , 1
,
, , 1
J i i
i i jk t jk t
j k t k t
i
k t i i
k t k t
g
X
X
g
X
, grow t h rat e of count ry i’s t ot al export of good k at t ime t , 1 , , , , 1
,
, , 1
K i i i i
jk t jk t j t j t
i k
j t i i
j t j t
g
X
X
g
X
, grow t h rat e of count ry i’s t ot al export t o count ry j at t ime t , 1
1
i i
i t t
t i t
TX
TX
gTX
TX
, grow t h rat e of count ry i‘s overall export at t ime t , , 1
,
1
i jk t i
jk t i t
x
TX
, share of “ export t o j of product k” in count ry i’s overall export at t ime t-1, , ,
1
J
i i
k t j jk t
, share of product k in count ry i’s overall export at t ime t-1, i, K1 i , j t k jk t
, share of market j in count ry i’s overall export at t ime t-1,t he equat ions of t he abovement ioned effect s are:
, ,
,
, ,
,1 1 1 1
Structure Effect Competitiveness Effect
Total Effect =
tEgTX
tE
gTX
tW
Jj kK
jk tE
jk tW
g
Wjk t
Jj Kkg
Ejk t
g
Wjk t
jk tE
, , , , , ,
1 1
Product Effect Market Effect
,
, , , , , ,
,
Structure Effect =
K J
E E W W E W W
t k k t k t k t j j t j t j t
W jk t
E W E W E W
jk t jk t k t k t W j t j t k t
g
g
, , 1 1 , Mixed Effect WJ K jk t W
jk t W j k j t
g
The CM SA calculat ions are performed using export s of goods dat a for t he aggregat e Euro Area, as
w ell as t he majorit y of t he individual Euro Area count ries, based on ext ra-Euro Area t rade dat a
(i.e. int ra-Euro Area t rade is excluded) disaggregat ed int o 46 sect ors/ product s and t he 15 m ost
import ant geographical dest inat ions. The analysis is carried out excluding export s of fuels in order
t o avoid dist ort ions result ing from highly volat ile oil prices. Export s are t hen separat ed out int o 12
broad product groups w hich are t hen allocat ed according t o t heir t echnological int ensit y (i.e. low ,
value t erms, hence development s in export market share are mechanically influenced by changes
in t he exchange rat e.
3. Overview of Results: Export Performance and Export Structure
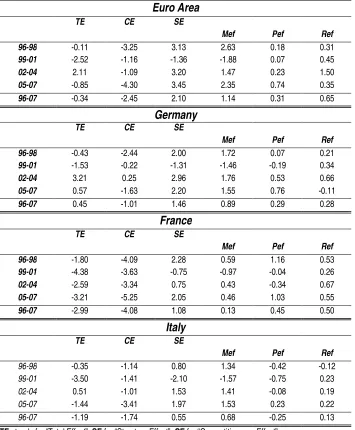
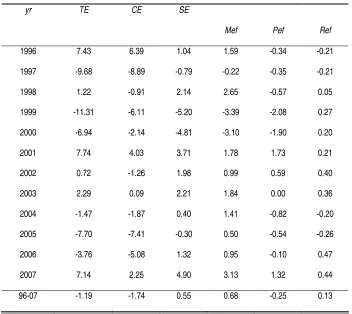
Table 1 show s t he CM SA result s for t he Euro Area, Germany, France and It aly. The bot t om row for
each economy show s t he result for t he w hole sample period (1996-2007),4 w hile t he ot her row s
show t he result s for four sub-periods. The Tot al Effect (TE) column show s t hat t he euro area,
France and It aly lost export market share over the w hole sample period, w hile Germany gained
market share (Sect ion 4 and t he Appendix show s result s for t he majorit y of t he ot her Euro Area
count ries). In t erms of t he sub-periods, t he Tot al Effect show s significant losses in export share
across t he board for 1999-2001. This is due t o a st rong decline in export -value share in 1999 and
2000, w hich recovers st rongly in 2001 and 2002 (see Chart 1 for t he Euro Area). The st rong
variabilit y in share over t he period 1999-2002 is largely explained by t he bilat eral exchange rat e of
t he euro vis-à-vis t he USD w hich first depreciat ed markedly before appreciat ing.5
One key result for t he w hole period, is t hat all four econom ies show a negat ive impact from t he
Compet it iveness Effect (CE), part icularly for France. M eanw hile, t he St ruct ure Effect (SE) is posit ive
for all four econom ies, implying t hat t he product and geographical composit ion of t he Euro Area
and it s t hree largest count ries had for t he m ost part a beneficial effect on t heir export market
shares. The one except ion is It aly w hich had a negat ive effect from t he product effect for t he
w hole sample period.
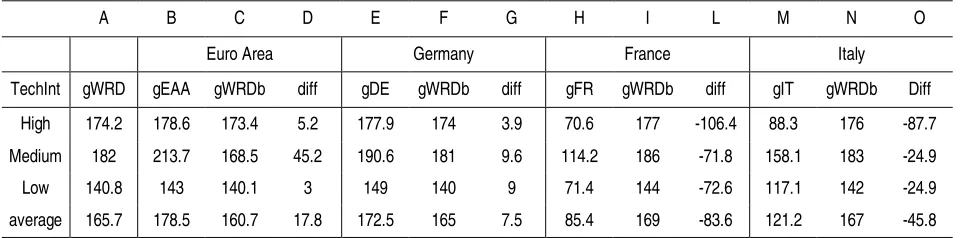
In Table 3 and Table 4 w e report specific grow t h rat es for t he Euro Area (EAA), France, Germany
and It aly bet w een 1995 and 2007. Table 3 includes t he grow t h rat es by dest inat ion market , t o w it ,
column D comprises t he grow t h-rat e different ials of export s t ow ards specific dest inat ion market s
bet w een t he Euro Area and t he World (less t he Euro Area: “ gWRDb” ). The EAA’s grow t h rat e
t ow ards t he Communit y of Independent St at es surfaces as t he low est , w hile t he EAA grow t h rat e
t ow ards China is t he highest (bot h w it h respect to “ gWRDb” ). In Table 4 t he grow t h rat es are w it h
respect t o sect ors w hich differ by t echnological int ensit y. The EAA’s grow t h rat e in t he “ low -Tech”
sect or is low , column D, w hile it is high in t he “ medium-t ech” sect or (bot h w it h respect t o
“ gWRDb” ). These grow t h-rat es can be used t o int erpret t he CM SA result s but need caut ion t o
4
The com plet e sample period for t he t rade dat a is 1995-2007, w hile CM SA result s are for t he period 1996-2007 as t hey are based on grow t h rat es.
avoid misunderst andings. On t his regard, one could come t o t he conclusion t hat a posit ive
different ial in one sect or ent ails a posit ive cont ribut ion from t hat sect or, but t his is not necessarily
t he case. For example, It aly’s grow t h-rat e different ial is negat ive in all sect ors w hile t he
cont ribut ion of t he Low and M edium-Tech sect ors t o It aly’s product effect is posit ive (Table 11),
t here’s no inconsist ency in t his. Indeed, even t hough It aly’s export s have grow n less t han t he
w orld’s, It aly’s specializat ion in t hese t w o sect ors has cont ribut ed posit ively t o it s St ruct ure Effect
because t he w orld demand of t hese goods has grow n very much (t his is recorded by t he World’s
grow t h rat e). On t he ot her hand, It aly’s lack of specializat ion in t he “ high-t ech” sect or causes t he
negat ive cont ribut ion of t his sect or t o it s product effect .
In t he next subsect ions w e comment on t he export performance of t he Euro Area, Germany,
France and It aly in great er det ail. We consider t he cont ribut ion of each sect or t o t he overall
performance of each count ry in order t o det ect in w hich sect or/ dest inat ion market a count ry has
Table 2. Constant Market Share Analysis Results
Euro Area
TE CE SE
Mef Pef Ref
96-98 -0.11 -3.25 3.13 2.63 0.18 0.31
99-01 -2.52 -1.16 -1.36 -1.88 0.07 0.45
02-04 2.11 -1.09 3.20 1.47 0.23 1.50
05-07 -0.85 -4.30 3.45 2.35 0.74 0.35
96-07 -0.34 -2.45 2.10 1.14 0.31 0.65
Germany
TE CE SE
Mef Pef Ref
96-98 -0.43 -2.44 2.00 1.72 0.07 0.21
99-01 -1.53 -0.22 -1.31 -1.46 -0.19 0.34
02-04 3.21 0.25 2.96 1.76 0.53 0.66
05-07 0.57 -1.63 2.20 1.55 0.76 -0.11
96-07 0.45 -1.01 1.46 0.89 0.29 0.28
France
TE CE SE
Mef Pef Ref
96-98 -1.80 -4.09 2.28 0.59 1.16 0.53
99-01 -4.38 -3.63 -0.75 -0.97 -0.04 0.26
02-04 -2.59 -3.34 0.75 0.43 -0.34 0.67
05-07 -3.21 -5.25 2.05 0.46 1.03 0.55
96-07 -2.99 -4.08 1.08 0.13 0.45 0.50
Italy
TE CE SE
Mef Pef Ref
96-98 -0.35 -1.14 0.80 1.34 -0.42 -0.12
99-01 -3.50 -1.41 -2.10 -1.57 -0.75 0.23
02-04 0.51 -1.01 1.53 1.41 -0.08 0.19
05-07 -1.44 -3.41 1.97 1.53 0.23 0.22
96-07 -1.19 -1.74 0.55 0.68 -0.25 0.13
Table 3. Growth rates of Export values by destination market (1995-2007, percent).
A B C D E F G H I L M N O
Euro Area Italy France Germany
par gWRD gEAA gWRDb diff gIT gWRDb diff gFR gWRDb diff gDE gWRDb diff AFR 182.2 109.7 221.9 -112.2 69.0 188.3 -119.3 20.1 216.1 -195.9 102.8 187.1 -84.3 AS1 119.5 79.5 124.7 -45.1 26.3 121.6 -95.3 36.4 121.8 -85.4 81.1 121.2 -40.1 AS2 294.8 302.0 293.3 8.7 227.3 297.2 -69.8 184.8 299.1 -114.3 202.7 302.5 -99.8 CIS 555.9 454.8 631.0 -176.3 410.7 566.5 -155.8 368.6 564.2 -195.6 471.8 574.0 -102.2 ENE 287.3 282.8 294.1 -11.3 269.5 288.6 -19.1 233.0 291.0 -58.0 261.3 297.3 -35.9 MET 260.0 216.0 279.3 -63.2 157.9 268.3 -110.4 126.3 269.7 -143.5 215.7 264.4 -48.7 OAC 160.9 109.5 172.6 -63.1 89.8 163.5 -73.8 19.9 168.1 -148.2 129.0 162.8 -33.8 OCN 141.7 153.0 139.2 13.8 147.0 141.5 5.5 118.0 142.6 -24.6 108.8 144.3 -35.5 OEC 266.4 255.3 277.4 -22.1 174.2 277.4 -103.2 223.8 268.9 -45.0 234.6 274.0 -39.5 CA 109.1 165.0 105.6 59.4 65.5 109.8 -44.3 85.9 109.4 -23.6 207.4 107.3 100.1 CH 103.1 100.3 109.6 -9.3 106.8 102.6 4.2 31.8 113.4 -81.6 74.2 118.1 -44.0 CN 373.7 452.2 363.7 88.5 206.3 377.5 -171.2 345.1 374.3 -29.3 570.8 363.9 206.8 JP 67.6 52.2 70.2 -17.9 13.2 69.0 -55.8 40.9 68.3 -27.4 37.6 69.6 -32.0 UK 117.6 136.2 96.9 39.3 95.4 119.0 -23.6 63.6 124.5 -60.8 122.1 116.6 5.5 US 129.8 185.4 120.4 64.9 98.8 130.6 -31.8 91.8 130.8 -39.0 167.0 127.4 39.6 average 211.3 203.6 220.0 -16.4 143.9 214.8 -70.9 132.7 217.5 -84.8 199.1 215.4 -16.2 Notes:
- “gX” is the growth rate in percent during 1995-2007, “X” is World (WRD), Euro Area (EAA), France (FR), Germany (DE), Italy (IT). - “gWRDb” is the growth rate of the World aggregate from which the country stated in the previous column is ruled out.
- “diff “ is the growth rate differential between “ gX” and “gWRDb.”
- the “gEAA-CN” cell is the growth rate of the Euro Area’s exports to China (CN)
Table 4. Growth rates of Export values by sector (1995-2007, percent).
A B C D E F G H I L M N O
Euro Area Germany France Italy
TechInt gWRD gEAA gWRDb diff gDE gWRDb diff gFR gWRDb diff gIT gWRDb Diff High 174.2 178.6 173.4 5.2 177.9 174 3.9 70.6 177 -106.4 88.3 176 -87.7 Medium 182 213.7 168.5 45.2 190.6 181 9.6 114.2 186 -71.8 158.1 183 -24.9 Low 140.8 143 140.1 3 149 140 9 71.4 144 -72.6 117.1 142 -24.9 average 165.7 178.5 160.7 17.8 172.5 165 7.5 85.4 169 -83.6 121.2 167 -45.8 Notes:
- “gX” is the growth rate in percent during 1995-2007, “X” is World (WRD), Euro Area (EAA), France (FR), Germany (DE), Italy (IT). - “gWRDb” is the growth rate of the World aggregate from which the country stated in the previous column is ruled out.
- “diff “ is the growth rate differential between “ gX” and “gWRDb.”
[image:9.595.55.536.496.615.2]3.1 Euro Area’s export performance.
The export -value share of t he Euro Area (EAA) over t he period 1995-2007 has declined only
marginally by around -2.21% (Chart 1), w hich is equivalent t o an average export grow t h-rat e
different ial of -0.34% vis-à-vis w orld export grow t h.6 Despit e t he fall in market share, t he
product / market specializat ion provided a posit ive cont ribut ion t o t he Euro Area’s export
performance, result ing in a St ruct ure Effect of + 2.1%. This w as more t han offset by a negat ive
cont ribut ion from t he Compet it iveness Effect (-2.45). Accordingly, t he Euro Area’s loss in export
market share occurred not because of specializat ion in sect or/ dest inat ion market s for w hich
demand is w eak, but because of fact ors w hich hampered it s competit iveness.
Alt hough t he Euro Area’s export market share in values (Chart 1) and in volumes (Chart 2) bot h
show a decline over t he sample period, t he volume indicat or show s a much larger fall. The
differences bet w een t hese indicat ors are due t o several fact ors, for example: t he volume indicat or
w eight s t he geographical export market s according t o t heir share in t he Euro Area’s t ot al export s,
w hile t he value indicat or is an unw eight ed measure of export share; t he value indicat or excludes
t rade in fuel product s, et c.7
Chart 1. EAA’s export-value share (percent). Chart 2. EA’s export volume market share (Index 2000 = 100).
Source: ECB monthly bulletin.
Note: Export-value share of the Euro Area as percentage of world exports to a selected group of partners.
Source: ECB monthly bulletin.
Note: Export market share, volume-based indicator (i.e., export volumes divided by a weighted average of import volumes of major export destinations).
As show n in Table 1, t he posit ive St ruct ure Effect is most ly due t o t he M arket Effect (1.1%) w it h a
smaller posit ive cont ribut ion from t he Product effect (0.3%).8 Alt hough t he Product Effect (Pef) is
posit ive, t his is only due t o t he medium-t ech sect or, w hile export s of high- and low -t ech product s
6
The Euro Area’s export share w as 25.7 % in 1995 and 25.1% in 2007, t he developm ent of t he share is show n in Chart 1.
7
cont ribut ed negat ively t o t he export performance of t he Euro Area (see sect or cont ribut ion t o t he
Pef in Table 5).
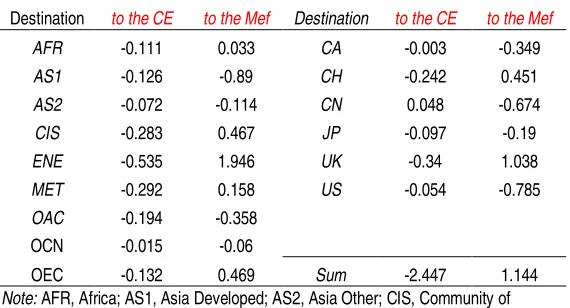
Overall, t he posit ive M arket Effect most ly comes from export s t o t he EU non-EA count ries (ENE),
t he UK and t he Ot her European Count ries (OCE), w hile export s t o t he Developed Asian Count ries,
t he Unit ed St at es as w ell as China cont ribut e negat ively (see dest inat ion cont ribut ion “ t o t he
M ef” , Table 3).9 As regards t he adverse impact of t he Compet it iveness Effect of –2.4%(Table 2),
t his most ly comes from t he low - and medium-t ech sect ors (see cont ribut ion “ t o t he CE” Table 2),
w hile t he cont ribut ion has been negat ive for all t he dest inat ions w it h t he except ion of China (see
dest inat ion cont ribut ion t o t he CE in Table 3). How ever, t he Compet it iveness Effect w as
part icularly adverse in export dest inat ions such as t he EU non-EA count ries (ENE), t he Communit y
[image:11.595.53.356.337.379.2]of Independent St at es (CIS), t he M iddle East (M ET) and Sw it zerland (CH).
Table 5. CMSA – Euro Area: Sector Contribution by Technological Content Low-tech Medium-tech High-tech Sum
to the CE -1.175 -1.051 -0.221 -2.447
to the Pef -0.157 1.562 -1.098 0.306
Table 6.: CMSA – Euro Area: Destination Market Contribution
Destination to the CE to the Mef Destination to the CE to the Mef
AFR -0.111 0.033 CA -0.003 -0.349
AS1 -0.126 -0.89 CH -0.242 0.451
AS2 -0.072 -0.114 CN 0.048 -0.674
CIS -0.283 0.467 JP -0.097 -0.19
ENE -0.535 1.946 UK -0.34 1.038
MET -0.292 0.158 US -0.054 -0.785
OAC -0.194 -0.358 OCN -0.015 -0.06
OEC -0.132 0.469 Sum -2.447 1.144
Note: AFR, Africa; AS1, Asia Developed; AS2, Asia Other; CIS, Community of
Independent States; MET, Middle East; OCN, Oceania; OAC, Other American Countries; OEC, Other European Countries; ENE, European Union non-Euro Area countries; CA, Canada; CN, China; JP, Japan; CH, Switzerland; US, United States; UK, United Kingdom.
8
Not e t hat a positive cont ribut ion from a sect or/ destinat ion m arket m eans t hat t he Euro Area is relat ively m ore specialized than it s com pet it ors in a relat ively fast er growing export sect or/ dest inat ion m arket .
9
[image:11.595.56.341.417.571.2]3.2 Germany’s Export Performance.
Germany’s export -value share increased in t he period 1995-2007 by about 4.70%, w hich is
equivalent t o an average posit ive export grow t h-rat e different ial of about 0.46% vis-à-vis w orld
export grow t h, w it h most of t his st rong export performance occurring mainly in t he last six years
of t he sample period (see Table 2). 10 Germany’s product / market specializat ion cont ribut ed
posit ively t o it s export performance recording an overall St ruct ure Effect of +1.46%, w hich w as
only part ially offset by a negat ive Competit iveness Effect of -1.01% (Table 1).
The direct ion of t he evolut ion of Germany’s export market share (in values) is in line w it h t he
volume-based indicat or (chart s 3 and 4 below ), alt hough t he rise in t he export volume share is
larger. Part of t he general reasons for differences bet w een volume and value shares has already
been explained, but anot her reason is t hat t he volume based indicat or includes bot h int ra- and
ext ra-Euro Area export s im plying t hat Germany has also regist ered a st rong export performance
w it hin t he area and vis-à-vis t he ot her Euro Area count ries.
Chart 3. Germany’s export-value share (percent). Chart 4. Germany’s export vol. market share (Index 2000 = 100).
Source: ECB monthly bulletin.
Note: Export-value share of the Euro Area as percentage of world exports to a selected group of partners.
Source: ECB monthly bulletin.
Note: Export market share, volume-based indicator (i.e., export volumes divided by a weighted average of import volumes of major export destinations).
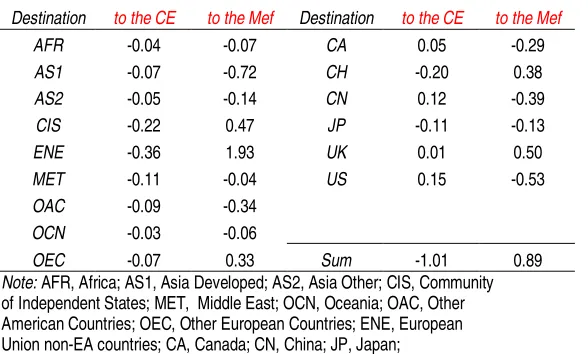
As show n in Table 1, t he posit ive St ruct ure Effect is most ly due t o t he M arket Effect (0.9%) w it h a
smaller posit ive cont ribut ion from t he Product effect (0.3%). In t erms of t he sect or cont ribut ion t o
t he Product Effect (Pef), Germany is more specialized in medium-t ech product s, w hile it is least
specialized in low -t ech product s (Table 4). As regards t he dest inat ion cont ribut ion t o t he M arket
Effect (M ef), Germany st rongly export s t ow ards t he EU non-EA count ries (ENE), t he UK and t he
10
CIS count ries, w hile it is relat ively less specialized t ow ards t he Developed Asian count ries, t he US
and China.
Turning t o t he sect orial explanat ion of t he negat ive Compet it iveness Effect of –1.0% (Table 2), t his
most ly comes from t he low - and medium-t ech sect ors (Table 4). In t erms of export dest inat ions,
Germany has been compet it ive in t he US and China, w hile losing share due t o compet iveness
fact ors in virt ually all of t he ot her geographical market s, part icularly in t he CIS count ries and t he
[image:13.595.56.364.256.297.2]EU non-EA count ries (ENE) as show n in Table 5.
Table 7. Constant Market Share Analysis - Germany: Sector Contribution by Technological Content
Low-tech Medium-tech High-tech Sum
to the CE -0.397 -0.421 -0.191 -1.009
to the Pef -0.821 1.872 -0.756 0.294
Table 8. Constant Market Share Analysis -Germany: Destination Market Contribution
Destination to the CE to the Mef Destination to the CE to the Mef
AFR -0.04 -0.07 CA 0.05 -0.29
AS1 -0.07 -0.72 CH -0.20 0.38
AS2 -0.05 -0.14 CN 0.12 -0.39
CIS -0.22 0.47 JP -0.11 -0.13
ENE -0.36 1.93 UK 0.01 0.50
MET -0.11 -0.04 US 0.15 -0.53
OAC -0.09 -0.34
OCN -0.03 -0.06
OEC -0.07 0.33 Sum -1.01 0.89
Note: AFR, Africa; AS1, Asia Developed; AS2, Asia Other; CIS, Community
[image:13.595.56.350.332.509.2]3.3 France’s Export Performance.
France’s export -value share decreased over t he period 1995-2007 by about -27.13%, which is
equivalent t o t o a negat ive export grow t h-rat e different ial of about -2.99% vis-à-vis w orld export
grow t h.11 France’s w eak export performance is fairly const ant in all of t he sub-periods, w hich is ent irely at t ribut able t o a negat ive Compet it iveness Effect of -4.1%, w hich w as only marginally
offset by a posit ive cont ribut ion from it s product / market specializat ion w hich result ed in a posit ive
St ruct ure Effect of +1.1% (Table 1). M eanw hile, t he evolut ion of France’s export-value share is in
line w it h t he export -volume share indicat or bot h in t erms of direct ion and magnit ude (Chart 5 and
Chart 6).
Chart 5. France’s export-value share (percent). Chart 6. France’s export volume market share (Index 2000 = 100).
Source: ECB monthly bulletin.
Note: Export-value share of the Euro Area as percentage of world exports to a selected group of partners.
Source: ECB monthly bulletin.
Note: Export market share, volume-based indicator (i.e., export volumes divided by a weighted average of import volumes of major export destinations).
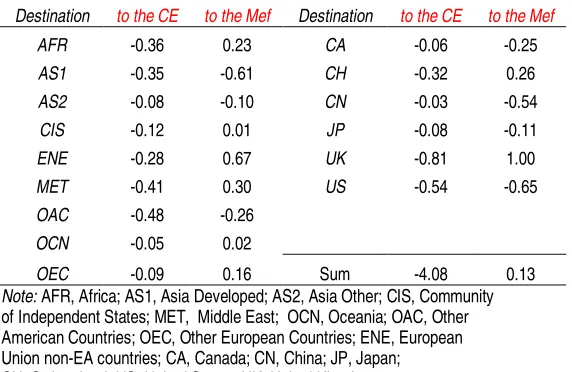
As show n in Table 1, t he posit ive St ruct ure Effect is most ly due t o t he Product Effect (0.5%), w hich
is due t o it s good performance in medium-t ech product s (see sect or cont ribut ion t o t he Pef, Table
9). As for t he dest inat ion market s, France’s specializat ion in export s t o t he UK, t he EU non-EA
count ries (ENE) and t he M iddle East (M ET) w as beneficial, w hile it is relat ively less specialized
t ow ards t he Developed Asian Count ries (AS1), China and t he US (see dest inat ion cont ribut ion t o
t he M ef, Table 10) – w hich is somew hat similar t o Germany.
As regards t he negat ive Compet it iveness Effect (-4.1%), t his w as spread across all t hree sect ors,
but w as part icularly evident in t he medium-t ech sect or in w hich France is more specialized (see
sect or cont ribut ion t o t he CE, Table 9). From t he geographical dest inat ion market perspect ive,
11
France experienced negat ive compet it iveness effect s in all of it s dest inat ion market s, w it h
part icularly pronounced negat ive effect s in t he UK and t he US (see dest inat ion cont ribut ion t o t he
[image:15.595.56.373.165.207.2]CE, Table 10).
Table 9. CMSA-France: Sector Contribution by Technological Content
Low-tech Medium-tech High-tech Sum
to the CE -1.028 -2.151 -0.899 -4.077
to the Pef -0.275 1.730 -1.005 0.451
Table 10. CMSA-France: Destination Contribution
Destination to the CE to the Mef Destination to the CE to the Mef
AFR -0.36 0.23 CA -0.06 -0.25
AS1 -0.35 -0.61 CH -0.32 0.26
AS2 -0.08 -0.10 CN -0.03 -0.54
CIS -0.12 0.01 JP -0.08 -0.11
ENE -0.28 0.67 UK -0.81 1.00
MET -0.41 0.30 US -0.54 -0.65
OAC -0.48 -0.26
OCN -0.05 0.02
OEC -0.09 0.16 Sum -4.08 0.13
Note: AFR, Africa; AS1, Asia Developed; AS2, Asia Other; CIS, Community
[image:15.595.56.342.244.430.2]3.4 Italy’s Export Performance.
It aly’s export -value fell during t he period 1995-2007 by about -13.0%, w hich is equivalent t o a
negat ive grow t h-rat e different ial of approximat ely -1.19% vis-à-vis w orld export grow t h. 12 As in
t he case of France, alt hough t o a lesser ext ent , It aly’s negat ive performance is due t o t he
Compet it iveness Effect of -1.7% w hich is part ly offset by a posit ive St ruct ure Effect of 0.6% (Table
1). Alt hough t he direct ion of t he evolut ion of It aly’s export-value share is t he same as t he
volume-based indicat or (chart s 7-8), t he decline in share is much great er for t he lat t er.
Chart 7. Italy’s export-value share (percent). Chart 8. Italy’s export volume market share (Index 2000 = 100).
Source: ECB monthly bulletin.
Note: Export-value share of the Euro Area as percentage of world exports to a selected group of partners.
Source: ECB monthly bulletin.
Note: Export market share, volume-based indicator (i.e., export volumes divided by a weighted average of import volumes of major export destinations).
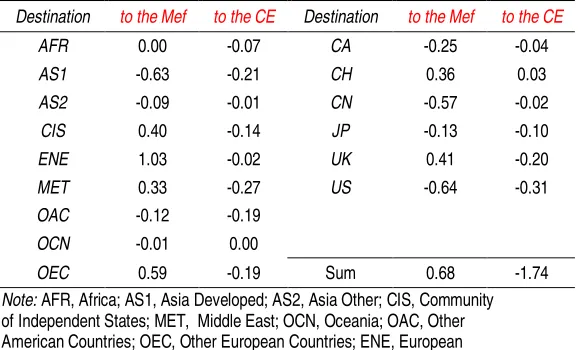
As show n in Table 1, t he posit ive St ruct ure Effect is only due t o t he M arket Effect (+0.68%) as t he
Product Effect is negat ive (-0.25%). The lat t er is comes about because It aly is relat ively more
specialized in Low -Tech product s, and less specialized in medium- and higher t ech product s t han,
say, France and Germany (see sect or cont ribut ion t o t he Product Effect , Table 11). As for t he
dest inat ion market s, It aly is specialized t ow ards t he EU non-Euro Area (ENE) and t he Ot her
European Count ries (OEC). Similarly t o France and Germany, It alian export s are less direct ed
t ow ards Asia.
In t erms of t he negat ive Compet it iveness Effect (-1.74%), t his is spread fairly evenly across all t he
sect ors (see sect or cont ribut ion t o t he CE, Table 11), w it h negat ive compet it iveness effect s
part icularly evident in geographical M arket s such as Asia (and China) as w ell as t he US (dest inat ion
cont ribut ion t o t he CE, Table 12 ).
Table 11. CMSA-Italy: Sector Contribution by Technological Content Low Medium High Sum
to the CE -0.713 -0.615 -0.416 -1.744
to the Pef 0.853 0.527 -1.634 -0.255
Table 12. CMSA-Italy: Destination Contribution.
Destination to the Mef to the CE Destination to the Mef to the CE
AFR 0.00 -0.07 CA -0.25 -0.04
AS1 -0.63 -0.21 CH 0.36 0.03
AS2 -0.09 -0.01 CN -0.57 -0.02
CIS 0.40 -0.14 JP -0.13 -0.10
ENE 1.03 -0.02 UK 0.41 -0.20
MET 0.33 -0.27 US -0.64 -0.31
OAC -0.12 -0.19
OCN -0.01 0.00
OEC 0.59 -0.19 Sum 0.68 -1.74
Note: AFR, Africa; AS1, Asia Developed; AS2, Asia Other; CIS, Community
[image:17.595.56.345.169.344.2]4. Export performance of the majority of the remaining Euro Area countries.
In t his sect ion, w e describe t he result s of t he const ant market share analysis for t he majorit y of
t he remaining Euro Area count ries.13 Chart 9 show s t he key result s for t he Euro Area and all of t he
count ries covered in t he analysis for t he sample period 1996-2007, w it h t he count ries arranged in
descending order of magnit ude of t he Tot al Effect (in ot her w ords, t hose count ries t ow ards t he
left of t he chart experienced gains in export market share, w hile t hose t ow ards t he right recorded
losses).14 St art ing from t he left , t he posit ive Tot al Effect s in many cases w as part ly due t o posit ive
St ruct ure Effect s, but for Aust ria, Net herlands, Ireland and Spain gain in export share w as most ly
due t o st rong posit ive Compet it iveness Effect s. How ever, it should be not ed t hat in m ore recent
years some of t hese count ries show negat ive Compet it iveness Effect s, part icularly Spain and
Ireland. When focussing on economies w hich lost export market share on t he right-side of Chart 9,
w e t end t o see significant ly larger posit ive St ruct ure Effect s – most ly driven by specialisat ion in
geographical market s w hich grew relat ively rapidly – w hich are more t han offset by subst ant ial
negat ive impact s from Compet iveness Effect s. This is part icularly apparent for Greece and Finland.
M eanw hile, Port ugal’s loss in export share is explained by a large negat ive Compet it iveness Effect
as w ell as a negat ive product effect , w it h t he lat t er due t o a relat ively high specialisat ion in slow er
grow ing low -t ech product market s.
Similar t o t he analysis in t he earlier sect ions, t he Euro Area count ries t end t o be specialising in
dest inat ion market s - and, in a significant number of cases, product market s - w hich have been
beneficial t o export performance. How ever, t he negat ive compet it iveness effect s of many of t he
Euro Area count ries in t hose same sect ors and geographical market s has out w eighed t his
advant age and caused losses in export share. Part of t he explanat ion for t he poor compet it iveness
is t he decline in price compet it iveness result ing from t he nom inal appreciat ion of t he euro t hat
occurred over t he lat t er part of t he sample period. How ever, non-price fact ors probably also
part ially explain t he negat ive compet it iveness effect s and may be relat ed t o claims t hat t he Euro
Area lags it s compet it ors in t erms of t echnological compet it iveness.15 Anot her fact or w hich may
be capt ured by t he compet it iveness effect is t he emergence of China as a major player in w orld
13
Not all of t he Euro Area count ries are shown due t o dat a problem s preventing a full analysis of all count ries. 14
The result s for t he relat ive export perform ance of t he individual countries, as w ell as t he est im ated relat ive im port ance of t he various effect s of t he CM SA, are similar to t hose report ed by t he European Comm ission in Box 1 “ Const ant M arket Share Analysis of Euro Area Countries’ Export s” pp. 21-22 of “ Broader M acroeconomic Surveillance – A Review of Com petit iveness Development s in t he Euro Area” (ECFIN/ C1 (2008) REP55742). 15
market s w hich by it s very nat ure has resulted in the shrinking of export market shares of advanced
indust rialised econom ies such as t he Euro Area.
Chart 9. CMSA for the Euro Area and the majority of the Euro Area countries 1996-2007
-5 .0 0 -4 .0 0 -3 .0 0 -2 .0 0 -1 .0 0 0 .0 0 1 .0 0 2 .0 0 3 .0 0
A T NL IE ES BE - LU DE EA GR IT FI PT FR
TE
CE
SE
Mef
Pef
Not es:TE " Tot al Effect " , SE " St ructure Effect " , CE " Competit iveness effect " , M ef " M arket effect " , Pef " Product effect " ; Count ries arranged in descending order of magnitude of Total Effect (TE) .
5. Concluding Remarks
Over t he sample period 1996-2007, t he Euro Area marginally lost export market share (in value
t erms) w hile France and It aly experienced great er losses in share, and Germany gained share. The
st ruct ure effect had a beneficial impact on t heir export performance as t hey specialised in
product s and dest inat ion market s w hich grew relat ively rapidly in comparison t o t he w orld
average (eg, medium-t ech product s and t o export dest inat ions such as ot her EU count ries).
M eanw hile, t hey are less specialized in high-t ech product s and fast grow ing dest inat ion market s
such as Asia and t he US. How ever, t he export s of t he Euro Area and t he majorit y of t he Euro Area
count ries experienced a subst ant ially negat ive compet it iveness effect. This negat ive impact from
compet it iveness is prevalent in almost all sect ors and dest inat ion market s, including t hose w here
t he Euro Area econom ies are highly specialised (eg, medium-t ech sect ors, and in geographical
market s such as ot her EU M embers). The w eak compet it iveness may be part ly explained by t he
decline in price compet it iveness due t o t he nominal appreciat ion of t he euro over t he sample
period, w it h non-price fact ors such as t echnological compet it iveness, as well as t he emergence of
In summary, t he Euro Area and t he majorit y of Euro Area count ries’ export s have specialised in
product s and dest inat ion market s w hich have been beneficial t o export performance, alt hough
w eak compet it iveness performance has more t han offset t hese posit ive effect s in many of t he
Bibliographical References
Andert on B. (1999), “ Innovat ion, product qualit y, variet y, and t rade performance: anempirical analysis of Germany and t he UK” , Oxford economic papers, 51: 152-167.
ECB (2005), “ Compet it iveness and t he Export Performance of t he EA” , European Cent ralBank Occasional Paper no. 30.
EC (2008) “ Broader M acroeconomic Surveillance – A Review of Com pet it ivenessDevelopment s in t he Euro Area” , European Comm ission (ECFIN/ C1 (2008) REP55742.
APPENDIX I. Features of the Sample and Dataset used.
The Const ant M arket Share Analysis discussed in t his paper uses nominal US$ export flow s
ext ract ed from t he UN Comt rade dat aset , t he t ime-span is 1995-2007, yearly frequency. The
export flow s are grouped int o 46 sect ors (SITC rev. 3, 2-digit ); w e consider almost all sect ors, but
w e int ent ionally exclude “ M ineral fuels, lubricant s and relat ed mat erials” in accordance w it h ECB
OP 30. The Sect ors are furt her classified int o Low , M edium and High Tech as in Andert on (1999).
The analysis considers 15 dest inat ion market s, of w hich 6 are single count ries and 7 geographical
aggregates. Alt oget her, t hese cover all t he dest inat ion market s of t he Euro Area count ries. A list of
t he sect ors and part ners included can be found in t he appendix. Int ra Euro Area export flow s are
excluded as w e st udy t he ext ernal performance of t he Euro Area and how t his is decomposed int o
Id_sec Commodity SITC Commodity Description Sector Technological
1 S3-00 live animals FOD low
2 S3-01 meat, meat preparations FOD low
3 S3-02 dairy products, bird eggs FOD low 4 S3-03 fish, crustaceans, mollusc FOD low 5 S3-04 Cereals, cereal preprtns. FOD low
6 S3-05 vegetables and fruit FOD low
7 S3-06 sugar,sugr.preptns,honey FOD low
8 S3-07 coffee,tea,cocoa,spices FOD low
9 S3-08 animal feed stuff FOD low
10 S3-09 misc.edible products etc FOD low
11 S3-11 beverages FOD low
12 S3-12 tobacco,tobacco manufact FOD low
13 S3-23 crude rubber CHE Medium
14 S3-51 organic chemicals CHE Medium
15 S3-52 inorganic chemicals CHE Medium
16 S3-53 dyes,colouring materials CHE Medium 17 S3-54 medicinal,pharm.products CHE Medium 18 S3-55 essentl.oils,perfume,etc CHE Medium 19 S3-56 fertilizer,except grp272 CHE Medium 20 S3-57 plastics in primary form CHE Medium 21 S3-58 plastic,non-primary form CHE Medium
22 S3-59 chemical materials nes CHE Medium
23 S3-61 leather, leather goods TEX low
24 S3-62 rubber manufactures, nes CHE Medium
25 S3-63 cork, wood manufactures WOD low
26 S3-64 paper,paperboard,etc. PAP low
27 S3-65 textile yarn,fabric,etc. TEX low 28 S3-66 non-metal.mineral manfct MNM low
29 S3-67 iron and steel BMI low
30 S3-68 non-ferrous metals BMI low
31 S3-69 metals manufactures,nes BMA low
32 S3-71 power generatng.machines MAI Medium 33 S3-72 special.indust.machinery MAI Medium
34 S3-73 metalworking machinery MAI Medium
35 S3-74 general industl.mach.nes MAI Medium 36 S3-75 office machines,adp mach MIO High 37 S3-76 telecomm.sound equip etc MEL High 38 S3-77 elec mch appar,parts,nes MEL High
39 S3-78 road vehicles MTR Medium
40 S3-79 othr.transport equipment MTR Medium
41 S3-82 furniture,bedding,etc. WOD low
42 S3-83 travel goods,handbgs etc TEX low 43 S3-84 clothing and accessories TEX low
44 S3-85 footwear TEX low
Country or aggregate code
Country or aggregate name
list of countries included if Aggregate
AFR Africa Algeria, Egypt, Libya, Morocco, Northern Africa, nes, Sudan, Tunisia, Western Sahara, Angola, Benin, Botswana, Br. Indian Ocean Terr., Burkina Faso, Burundi, Cape Verde, Comoros, Côte d'Ivoire, Dem. Rep. of the Congo, Djibouti, Eritrea, Ethiopia, Fmr Ethiopia, Fmr Rhodesia Nyas, Fmr Tanganyika, Fmr Zanzibar and Pemba Isd, Fr. South Antarctic Terr., Gambia, Ghana, Guinea, Guinea-Bissau, Kenya, Lesotho, Liberia, Madagascar, Malawi, Mali, Mauritania, Mauritius, Mozambique, Namibia, Niger, Nigeria, Other Africa, nes, Réunion, Rwanda, Saint Helena, Sao Tome and Principe, Senegal, Seychelles, Sierra Leone, Somalia, South Africa, Swaziland, Togo, Uganda, United Rep. of Tanzania, Zambia, Zimbabwe
AS1 Asia 1 (Developed) China, Hong Kong SAR, Indonesia, Malaysia, Philippines, Rep. of Korea, Singapore, Thailand
AS2 Asia 2 (Other Asian Countries, incl. India)
Bangladesh, Bhutan, Brunei Darussalam, Cambodia, Dem. People's Rep. of Korea, India, Lao People's Dem. Rep., Maldives, Mongolia, Myanmar, Nepal, Pakistan, Sri Lanka, Viet Nam
CIS Community of Independent States
Armenia, Azerbaijan, Belarus, Georgia, Kazakhstan, Kyrgyzstan, Rep. of Moldova, Russian Federation, Tajikistan, Turkmenistan, Ukraine, Uzbekistan
ENE Countries which are in the European Union but not in the Euro Area
Bulgaria, Czech Rep., Denmark, Estonia, Hungary, Latvia, Lithuania, Poland, Romania, Sweden
MET Middle East Afghanistan, Bahrain, Fmr Dem. Yemen, Iran, Iraq, Israel, Jordan, Kuwait, Lebanon, Oman, Qatar, Saudi Arabia, Syria, United Arab Emirates, Yemen
OCN Oceania Australia, Christmas Isds, Cocos Isds, Cook Isds, Fiji, Fmr Pacific Isds, French Polynesia, FS Micronesia, Kiribati, Marshall Isds, N. Mariana Isds, Nauru, New Caledonia, New Zealand, Niue, Norfolk Isds, Oceania, nes, Palau, Papua New Guinea, Pitcairn, Samoa, Solomon Isds, Tokelau, Tonga, Tuvalu, US Misc. Pacific Isds, Vanuatu, Wallis and Futuna Isds
OAC Other American Countries Anguilla, Antigua and Barbuda, Argentina, Aruba, Bahamas, Barbados, Belize, Bolivia, Br. Antarctic Terr., Br. Virgin Isds, Brazil, CACM, nes, Caribbean, nes, Cayman Isds, Chile, Colombia, Costa Rica, Cuba, Dominica, Dominican Rep., Ecuador, El Salvador, Falkland Isds (Malvinas), Fmr Panama, excl.Canal Zone, Fmr Panamá-Canal-Zone, French Guiana, Grenada, Guadeloupe, Guatemala, Guyana, Haiti, Honduras, Jamaica, LAIA, nes, Martinique, Mexico, Montserrat, Neth. Antilles, Neth. Antilles and Aruba, Nicaragua, Panama, Paraguay, Peru, Rest of America, nes, Saint Kitts and Nevis, Saint Kitts, Nevis and Anguilla, Saint Lucia, Saint Vincent and the Grenadines, Suriname, Trinidad and Tobago, Turks and Caicos Isds, Uruguay, US Virgin Isds, Venezuela
OEC Other European Countries Albania, Bosnia Herzegovina, Croatia, Gibraltar, Iceland, Norway, Serbia and Montenegro, Turkey
CA Canada
UK United Kingdom
CN China
CH Switzerland
JP Japan
APPENDIX II. Constant M arket Share Analysis output.
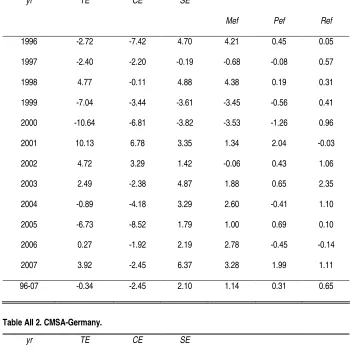
Table AII 1. CMSA-Euro Area Aggregate
yr TE CE SE
Mef Pef Ref
1996 -2.72 -7.42 4.70 4.21 0.45 0.05 1997 -2.40 -2.20 -0.19 -0.68 -0.08 0.57 1998 4.77 -0.11 4.88 4.38 0.19 0.31 1999 -7.04 -3.44 -3.61 -3.45 -0.56 0.41 2000 -10.64 -6.81 -3.82 -3.53 -1.26 0.96 2001 10.13 6.78 3.35 1.34 2.04 -0.03 2002 4.72 3.29 1.42 -0.06 0.43 1.06 2003 2.49 -2.38 4.87 1.88 0.65 2.35 2004 -0.89 -4.18 3.29 2.60 -0.41 1.10 2005 -6.73 -8.52 1.79 1.00 0.69 0.10 2006 0.27 -1.92 2.19 2.78 -0.45 -0.14 2007 3.92 -2.45 6.37 3.28 1.99 1.11
96-07 -0.34 -2.45 2.10 1.14 0.31 0.65
Table AII 2. CMSA-Germany.
yr TE CE SE
Mef Pef Ref
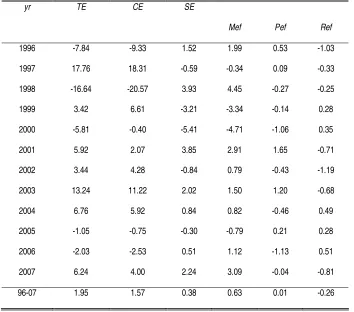
[image:25.595.54.406.460.774.2]Table AII 3. CMSA-France
yr TE CE SE
Mef Pef Ref
1996 -9.24 -10.94 1.70 -0.12 1.27 0.55 1997 -1.91 -2.02 0.10 -0.70 -0.09 0.90 1998 5.74 0.70 5.04 2.60 2.30 0.14 1999 -3.70 -0.44 -3.26 -1.94 -0.73 -0.59 2000 -13.75 -8.75 -5.02 -3.64 -2.92 1.56 2001 4.31 -1.70 6.01 2.68 3.53 -0.19 2002 -1.20 -2.09 0.89 0.12 0.64 0.12 2003 -0.64 -2.21 1.57 0.55 -0.29 1.31 2004 -5.92 -5.72 -0.19 0.63 -1.38 0.56 2005 -8.00 -8.52 0.53 -0.47 -0.12 1.10 2006 -0.70 -2.27 1.57 -0.17 1.11 0.63 2007 -0.92 -4.96 4.04 2.02 2.09 -0.07 96-07 -2.99 -4.08 1.08 0.13 0.45 0.50
Table AII 4. CMSA-Italy.
yr TE CE SE
Mef Pef Ref
[image:26.595.55.407.455.769.2]Table AII 5. CMSA-Spain.
yr TE CE SE
Mef Pef Ref
1996 10.50 9.40 1.26 0.58 -0.09 0.72 1997 1.35 -0.40 1.70 1.63 -0.38 0.45 1998 1.87 -2.17 4.04 3.93 0.77 -0.66 1999 -2.86 2.11 -4.97 -4.03 -0.74 -0.21 2000 -10.04 -4.43 -5.61 -3.43 -3.04 0.85 2001 4.37 0.37 4.00 2.19 2.45 -0.64 2002 6.94 6.12 0.83 -1.26 1.87 0.20 2003 8.45 7.25 1.21 -0.58 0.00 1.78 2004 -4.63 -6.04 1.42 0.80 -1.50 2.11 2005 -3.41 -2.60 -0.81 -0.91 -0.03 0.13 2006 -2.24 -3.40 1.16 0.08 0.46 0.61 2007 5.10 0.89 4.21 2.36 1.49 0.36 96-07 1.28 0.59 0.70 0.11 0.10 0.48
Table AII 6. CMSA-The Netherlands.
yr TE CE SE
Mef Pef Ref
[image:27.595.55.409.458.770.2]Table AII 7. CMSA-Austria
yr TE CE SE
Mef Pef Ref
1996 -0.71 -3.13 2.52 3.05 -0.30 -0.34 1997 -1.37 0.54 -1.91 -1.54 -0.39 0.01 1998 5.35 0.94 4.34 4.05 0.24 0.16 1999 -4.86 0.40 -5.32 -4.19 -1.16 0.11 2000 -6.23 -0.56 -5.57 -5.09 -1.45 0.82 2001 9.79 5.26 4.52 2.77 1.39 0.39 2002 6.38 3.44 3.00 2.29 0.86 -0.23 2003 11.19 6.07 5.22 4.31 0.34 0.41 2004 7.57 5.88 1.89 2.18 0.02 -0.59 2005 -6.78 -6.17 -0.54 0.44 -0.35 -0.71 2006 -0.63 -3.40 2.83 2.26 0.07 0.41 2007 5.37 -0.09 5.46 3.68 1.99 -0.20 96-07 2.09 0.76 1.37 1.18 0.11 0.02
Table AII 8. CMSA-Portugal
yr TE CE SE
Mef Pef Ref
[image:28.595.54.410.450.764.2]Table AII 9. CMSA-Greece.
yr TE CE SE
Mef Pef Ref
1996 9.20 1.90 7.36 6.27 0.92 -0.13 1997 -4.82 -3.70 -0.99 0.71 -1.75 -0.01 1998 -0.18 -1.39 0.76 3.08 -1.14 -0.95 1999 -8.60 -1.82 -6.45 -6.45 -2.23 2.10 2000 -4.50 2.12 -6.38 -3.93 -3.04 0.29 2001 14.47 8.43 5.95 3.91 2.31 -0.17 2002 -10.14 -12.93 2.79 3.18 -0.69 0.28 2003 14.81 7.39 7.71 6.00 -0.37 1.79 2004 -9.52 -10.80 1.77 3.05 -1.29 -0.53 2005 -0.56 -0.89 0.81 0.80 -0.24 -0.30 2006 -10.75 -16.14 5.92 2.09 1.68 1.77 2007 6.11 0.97 5.42 5.25 0.50 -0.74 96-07 -0.37 -2.24 2.05 2.00 -0.45 0.28
Table AII 10. CMSA-Finland.
yr TE CE SE
Mef Pef Ref
[image:29.595.54.410.450.764.2]Table AII 11. CMSA-Ireland
yr TE CE SE
Mef Pef Ref
1996 8.61 8.71 0.16 -0.08 1.20 -1.30 1997 8.18 6.59 1.61 0.34 1.03 0.21 1998 20.15 16.22 3.83 3.39 -0.07 0.66 1999 14.04 9.59 4.26 0.64 3.24 0.64 2000 1.70 5.33 -3.56 -3.90 0.42 -0.19 2001 16.87 15.98 0.95 0.44 1.20 -0.75 2002 -1.23 -1.26 0.06 -1.29 0.29 1.00 2003 -16.50 -17.19 0.85 -1.94 3.70 -1.14 2004 -9.63 -6.54 -2.89 -1.92 0.27 -1.52 2005 -8.97 -6.14 -2.76 -3.77 0.18 0.74 2006 -13.61 -10.98 -2.57 -2.98 -1.38 1.73 2007 1.08 6.00 -4.78 -2.91 -0.99 -1.04 96-07 1.72 2.19 -0.40 -1.16 0.76 -0.08
Table AII 12. CMSA- Belgium - Luxembourg
yr TE CE SE
Mef Pef Ref
1996 -1.81 -1.81 0.00 0.68 -2.82 2.14 1997 2.76 3.25 -0.50 -0.68 -0.44 0.62 1998 6.20 4.19 2.01 3.79 -0.75 -1.03 1999 -0.16 0.09 -0.25 -3.22 0.62 2.34 2000 -6.36 -1.54 -4.82 -4.82 -0.53 0.53 2001 5.48 3.48 2.00 3.30 2.67 -3.96 2002 12.05 2.59 9.46 0.72 1.74 6.99 2003 -1.32 -5.35 4.02 1.74 1.03 1.25 2004 -2.62 -2.56 -0.07 -1.03 -0.67 1.64 2005 -2.14 -0.93 -1.21 -0.91 -0.01 -0.28 2006 -6.27 -4.86 -1.42 1.12 -2.22 -0.31 96-06 0.53 -0.31 0.84 0.06 -0.13 0.90
[image:30.595.55.421.450.743.2]