A Toolkit for the Visualisation of CORBA
Applications
Robert Miller B.Sc.,
Department of Computer Science,
Trinity College Dublin.
A dissertation submitted to the University of Dublin,
in partial fulfillment of the requirements for the degree of
Master of Science in Computer Science
Declaration
I declare that the work described in this dissertation is, except where otherwise stated, entirely my own work and has not been submitted as an exercise for a degree at this or any other university.
Signed:___________________ Robert Miller September 2000
Permission to lend and/or copy
I agree that Trinity College Library may lend or copy this dissertation upon request.
Abstract
VEDA is a visualisation environment that allows the operation of distributed applications to be visualised graphically for the purposes of testing and education. It contains a visualisation package which enables distributed processes to present their flow of control to the user in a graphical manner. With VEDA's visualisation capabilities as a platform it is the aim of this dissertation to develop a toolkit which will support the automatic visualisation of CORBA applications. The toolkit will be designed with a pedagogical function in mind and with undergraduates as the target audience. Essentially the dissertation can be broken up into two distinct tasks:
The first phase of the dissertation will involve the modification an IDL compiler to enable the automatic generation of visualisation events. IDL specifies interfaces between CORBA objects. The IDL compiler generates small pieces of code known as client stubs and server skeletons which allow client processes to access remote server objects. The IDL compiler will be modified so as to produce instrumented stubs and skeletons. By instrumentation I mean the annotation of code with visualisation event calls. The event calls will convey pertinent information about the distributed object system to the visualisation engine. The visualisation engine in turn generates a graphical representation of application state and execution.
The second phase of this dissertation involves extending VEDA’s visualisation capabilities to accommodate the complexities of distributed object systems.
Acknowledgements
Thank you Jane for everything.
Thanks to my family and friends for their support and encouragement
throughout the year.
Thanks to my classmates and peers for their camaraderie through the
tough times.
Finally, Thanks to my supervisor Dr. Vinny Cahill for
his guidance
Contents
1. Introduction... 1
1.1 Distributed objects. ... 2
1.2 VEDA ... 2
1.3 Objectives ... 3
1.4 Achievements... 3
1.5 RoadMap... 3
2. Literature Review ... 5
2.1 Overview of software visualisation as a research area... 5
2.1.1 Defining software visualisation... 6
2.1.2 Taxonomies of software visualisation systems. ... 7
2.2 Visualisation Systems ... 9
2.2.1 Educational Systems ... 9
2.2.2 Visualisation Systems for Parallel/Distributed Programs ... 11
2.2.3 Visualisation Systems for object- oriented programs... 13
2.4 VEDA ... 14
2.5 Empirical testing of visualisations ... 15
2.6 Summary... 16
3. Design... 17
3.1 Introduction... 17
3.2 What Aspect of CORBA should be represented? ... 17
3.2.1 CORBA Overview ... 17
3.2.2 CORBA Implementation Overview... 19
3.2.3 Level of abstraction for visualisation... 20
3.3 Visual Design of CORBAvis ... 21
3.3.1 Visual Design Concerns... 21
3.3.2 Visual Vocabulary Design ... 23
3.3.3 Graphical User Interface Design... 25
3.4 Design of VEDA... 27
3.4.1 Veda Design... 27
3.5 The limitations of VEDA... 30
3.6 Overview of CORBAvis architecture. ... 31
3.7 CORBAvis component design ... 34
3.7.1 back-end component interaction ... 34
3.7.2 Front-End component interaction ... 36
3.8 Swing and AWT ... 39
3.8.1 The rational for converting VEDA to Swing. ... 39
3.8.2 Swing Components ... 40
4. Implementation ... 42
4.1 ORBacus and JIDL ... 42
4.2 Modification of the IDL compiler... 43
4.3 Modification of Compiler generated files ... 44
4.3.1 Skeleton modifications... 44
4.3.2 Stub modifications ... 45
4.3.3 Helper Modifications ... 46
4.4 CORBAvis Back-end... 46
4.4.1 The VisManager class... 46
4.5 CORBAvis Front-end ... 47
4.5.1 The CorbaSystemView class ... 47
4.5.2 The NodeView class ... 49
4.5.3 The ProcessView class... 49
4.5.4 The ObjView class... 49
4.5.5 The Message Manager. ... 50
4.5.6 The InterfaceManager class ... 53
5. Evaluation... 55
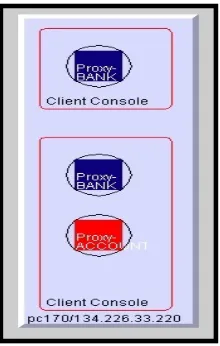
5.1 The bank example ... 55
5.1.1 Is it a good visualisation?... 57
5.2 Empirical testing of CORBAvis ... 59
6. Conclusion ... 61
6.1 Dissertation review ... 61
6.2 Future Work... 62
6.3 Concluding remarks ... 63
1. Introduction
The visualisation of computer systems is a common phenomenon. Most computer
practitioners use visualisation as a tool to compose a coherent mental model of a system. In this context a visualisation is constructed in each individual's minds eye, it is their abstract understanding of a system with which they rationalise.
Software visualisation and it's various constituent parts attempts to tap into this innate mental faculty by generating graphical representations of software systems. The developers of such systems hope that their representation of a given system substrate, will help users to develop more quickly a workable mental model. In general terms, it is hoped that visualisations will aid understanding.
1.1 Distributed objects.
" Distributed object computing is a computing paradigm that allows objects to be distributed across a heterogeneous network, and allows each of the components to inter-operate as a unified whole. To an application built in a distributed object environment, and as expressed in Sun Microsystems slogan, the network is the computer. Object orientation can radically simplify systems development. Distributed object models and tools extend an object-oriented programming system. The objects may be distributed on different computers throughout a network, living within their own dynamic library outside of an application, and yet appear as though they were local within the application." [29]
One of the leading technologies within distributed object computing is the Common Object
Request Broker Architecture (CORBA). CORBA is an open software standard, developed and maintained by the Object Management Group (OMG). " It enables invocations of methods on distributed objects residing anywhere on a network, just as if they were local objects. A CORBA implementation employs Object Request Brokers (ORBs), located on both the client and the server, to create and manage client/server communications between objects. ORBS are the key to the CORBA distributed object architecture. They allow objects on the client side to make requests of objects on the server side without any prior knowledge of where those objects exist, what language they are in, or what operating system they are running on."[29]
A major component of the CORBA standard, and a key element of this project, is the
Interface Definition Language. IDL is a language neutral, declarative language that is used to define the interfaces which CORBA objects support. An IDL compiler is used to generate files that enable client and server objects to communicate with the ORB.
1.2 VEDA
As a foundation this project uses work already carried out by a fellow student at Trinity College Dublin. VEDA, the Visualization Environment for Distributed Algorithms,
developed by Andreas Ulbrich [1], is a comprehensive framework for distributed algorithm visualization and network simulation. The algorithm visualization component of VEDA is an integral part of this project and is described as follows: "The visualization toolkit was
Veda uses the generic visual metaphor of space-time diagrams to depict distributed applications.
This project can be seen as an extension to VEDA to accommodate distributed object systems. As we shall see in Chapter 3, VEDA has certain limitations with regards to depicting CORBA applications. An analysis of these limitations resulted in the design of CORBAvis. CORBAvis is the self-explanatory name given to the software toolkit developed as part of this project.
1.3 Objectives
The central theme of this project is to develop, using VEDA as a foundation, a visualization toolkit for CORBA applications. Sub-objectives can be outlined as follows:
• To devise a suitable visual representation for CORBA applications. The visual
representation should show the dynamic behavior of an executing CORBA application.
• It is hoped that the application programmer can produce visualizations with little or no
intervention. In other words the visualizations will be produced automatically
• To explore the relevance of software visualization in general and in particular as a means
of teaching complex software systems.
1.4 Achievements
The achievements of this project are threefold. Firstly a graphical representation for CORBA applications was designed. Secondly, modifications were made to an IDL compiler so that it could generate files that can produce VEDA based visualization events. Thirdly, an extension to VEDA was developed to accommodate CORBA applications.
1.5 RoadMap
Chapter 2.
This chapter assesses the state of the art in the field. A number of software visualization taxonomies are presented. A broad range of visualization systems are discussed and
evaluated. Some empirical testing which has been carried out on visualization systems is also outlined.
Chapter 3.
This chapter examines every aspect of the design of CORBAvis. It explores which aspects of CORBA we should represent, then a visual representation of the chosen aspect is designed and VEDA's limitations are then explored with regards to the chosen design. Finally, there is an overview of CORBAvis's architecture and the design of CORBAvis components.
Chapter 4.
This chapter explains why ORBacus and JIDL were chosen for this project. It details the modifications made to the JIDL compiler and the files that the compiler generates. Lastly, CORBAvis implementation issues are investigated.
Chapter 5
This chapter introduces a demonstration application and it evaluates the visualization that is produced by CORBAvis under a number of criteria. An Empirical test for CORBAvis is also proposed.
Chapter 6
2. Literature Review
Developing a toolkit that will generate graphical representations of distributed object system behaviour is the central aim of this project (the distributed object system of choice is
CORBA)[29]. The VEDA system developed by Andreas Ulbrich [1] is the starting-point from
which this toolkit will be developed. VEDA provides a network simulator and visualisation toolkit for distributed applications.
The purpose of this chapter is to establish a context for this project in relation to previous work carried-out by researchers in the same area. Section 2 gives an overview of the software visualisation research area. Section 3 is concerned with detailing various systems that have been developed to date. The systems which have been studied can be divided into three distinct sections 1) systems concerned with visualising parallel/distributed programs 2) object-oriented program visualisations and 3) visualisation systems which where designed from a teaching perspective. Section 4 describes VEDA and it's constituent components. Section 5 outlines some empirical tests that have been carried out on visualisation systems. Finally, Section 6 is a summary of the chapter.
2.1 Overview of software visualisation as a research area.
Visually representing the internal states and actions of a computer is not a new idea. In 1826 Charles Babbage devised a notation to represent the internal workings of his Difference Engine.
"The difficulty of retaining in the mind all the contemporaneous and successive movements of a complicated machine, and the still greater difficulty of properly timing movements which has already been provided for, induced me to seek for some method by which I might at a glance of the eye select any particular part, and find at any given time it's state of motion or rest, it's relation to the motions of any part of the machine, and if necessary trace back the sources of it's movement through all it's successive stages to the original moving power. I soon felt the forms of ordinary language were far too diffuse to admit any expectation of removing the difficulty, and being convinced from experience of the vast power which
analysis derives from the great condensation of meaning in the language it employs, I was not long in deciding that that the most favourable path to pursue was to have recourse to the
Babbage was concerned with hardware and his notation was paper-based but the same ideas apply to software. Software visualisation makes use of the fact that the human brain is more suited to processing, manipulating and recognising visual images and structures. Reading of source-code/text is a special case of this visual processing. However, the detail involved is too great and the brain will abstract each character, word or sentence into an internal meaning or representation. Software visualisation attempts to aid the comprehension process by providing these abstractions in a visual form, thus reducing the interpretation load. In order to create a research context for the project we must try to define software visualisation and then explore the general characteristics of software visualisation systems.
2.1.1 Defining software visualisation
Software visualisation is an ambiguous term from which a number of interpretations can be derived. We must attempt to find a suitable definition. Other terms used throughout the literature include program visualisation, algorithm animation, program animation and visual programming. There is a certain amount of overlap in meaning between these terms and this can be illustrated by the following definitions found in the literature:
• “Software visualisation is the use of the crafts of typography, graphic design, animation
and cinematography to enhance the interface between the software engineer or the
computer science student and their programs”[3].
• “Software visualisation describes systems that use visual (and other) media to enhance one
programmer's understanding of another’s work”[4].
• “Program visualisation is a sub-set of the area known as software visualisation - the use of
graphics and animation to visually describe and illustrate software and it's function” [5].
• “Program visualisation deals with graphical presentation, monitoring and exploration of
programs expressed in textual form” [6].
• “Visualisation is the process of creating and manipulating a visual image that allows a
mental picture of some situation or phenomenon to be formed. These images can be either static or dynamic and need be graphical in nature, this allows the possibility of images
comprising of symbolic constructs” [7].
construct the algorithm. The animation aspect is significant; it implies depiction of an
algorithm using “smooth graphical transitions between algorithmic states”
[8]
. Historically,animation systems have been designed and used as teaching aids. Program visualization systems are primly concerned with the constructs that constitute a program lower, these constructs could be processes, objects, records, structures, loops, variables etc. Program visualization systems are primarily used in the areas of performance analysis and software maintenance. This project is concerned with visualizing a distributed object system with regard to the interaction of its objects so CORBAvis could be termed a program visualization system.
2.1.2 Taxonomies of software visualisation systems.
Several taxonomies have been developed in an attempt to define standard terms and to give a foundation to the research area; these taxonomies vary to a large extent. However, two
taxonomies that are predominant in the field are taxonomy by Myers [9] and a more recent
taxonomy by Price et al. [3].
Myers' classifies systems from two perspectives: the data that they are based on, such as code or algorithm visualisations; and whether the visualisations are static or dynamic. This
taxonomy covers many important aspects of a software visualisation tool; however, it fails to provide any scope for evaluating the effectiveness of systems [8].
The taxonomy presented by Price et al. categorise systems in a more formal manner and try to incorporate a certain degree of flexibility into their taxonomy to allow for future expansion and revision. Their taxonomy is divided into six sections. Each of these sections is then further subdivided into sub-sections called characteristics:
Scope
Scope is concerned with the general characteristics of the system:
Class of program: What type of program has the visualisation system been designed for? The class of program substrate can be described by attributes such as source language, operating system, environment or application.
Concurrency: Are concurrent programs supported by the system? Concurrent applications
require specialized support within the visualization tool.
[3]
Content
The content section relates to with what is actually visualised by the system:
Program visualization: Does the system produce visualizations of algorithms or programs? When the system is designed to inform the user about one particular implementation of an algorithm, it is usually a program visualization. On the other hand, if the system is teaching the user about a general algorithm, it is an algorithm visualization.
Compile/Run-Time: Does the system gather information for the visualisation at runtime or compile time?
Fidelity and completeness: Is it true that the visual metaphors generated by the visualization tool present a complete representation of the underlying system? Systems that are designed for an industrial context pose stronger demands than systems that are designed for educational purposes. Teaching systems may be simplified to produce more readily comprehendible
visual explanations.
[3]
Form
This section is concerned with what elements the visualisation is composed of.
Graphical Elements: What is the graphical vocabulary of the system. Colour: Is colour used in the systems visualisations?
Animation: Is the visualization animated or static?
[3]
Method
Method relates to the specification of the visualisation
.
Specification: Visualisations can be hand-coded or be produced automatically by analyzing the program structure.
Batch/Live: Visualization can be generated from a trace file or produced live as the program
Interaction
Interaction refers to whether or not the user has control over the visualization.
Navigation: Does the system allow the user to navigate through the visualization of a large program or dataset?
Elision: Is it possible to omit unwanted detail from the display?
[3]
Effectiveness
Are the visualizations that are produced by the system effective?
Appropriateness and clarity: Does the visualization communicate information about the
software effectively? How long does it take the visualizations to facilitate understanding?
[3]
The price et al. Taxonomy will be used as a framework within which the visualization toolkit developed as part of this project will be defined. For completeness sake it must be mentioned that other taxonomies exist, again using a different set of classifications. One such taxonomy
is by Stasko and Patterson [10], which introduces scaled dimensions into a four-category
taxonomy. These categories cover aspect, abstractness, animation and automation.
2.2 Visualisation Systems
A large number of visualisation systems have been developed, with the late-eighties and early-nineties a particularly productive period. In this section, a number systems and studies have been selected from the literature and are categorised under three headings in relation to their design objectives and functionality.
2.2.1 Educational Systems
BALSA
While BALSA is recognised as a landmark system in algorithm animation and as an important pedagogic tool, it has a number of drawbacks. Firstly, it is very programmer intensive. Secondly, the algorithm being evaluated is affected by integration with the BALSA
system.
[11]
Zeus
The first system to use colour and sound to impart information was the Zeus algorithm animation system. Zeus can also animate parallel as well as sequential algorithms. Some of the techniques incorporated into Zeus are important to the area of visualisation in general: 1) multiple views are used to reduce screen clutter and make the animation easier to
comprehend. 2) A history of previous algorithm states is presented to the user in order to put the current algorithm state in context. 3) A deeper understanding of an algorithm may be obtained by contrasting it with a different algorithm that performs the same function.
Developing the use of sound in algorithm animations is an interesting element in the Zeus system. However, it was found that sound is difficult to use but can be effective in
representing patterns of activity and signalling special cases [12].
Polka
The POLKA methodology is primarily concerned with the visualisation of object-oriented software. POLKA, developed using the X window system and motif, incorporates 2-D animation and colour. Different representations of the program being visualised can be created by using individual windows called views. A mapping from program operation to animation sequence is achieved by associating a POLKA graphical routine, called a "scene", with a program event. A view consists of a set of scenes. POLKA provides an API to its graphical capabilities allowing the easy construction of visualisations. An important
2.2.2 Visualisation Systems for Parallel/Distributed Programs
PAVENE
PAVENE concentrates on concurrent computations and is used to explore concurrent program behaviour. The system is comprised of three key components, which work concurrently. The program that is being visualised is the first component. The second component of the
visualisation system, the visualisation component, extracts information from the first component and translates it into a graphical form. The rendering component displays the images produced by the visualisation component, adding user interaction facilities.
The developers of PAVNE identified a number of limitations with BALSA. A very significant limitation is that interesting events need to be identified and the corresponding points in the code have to be instrumented. This limitation is particularly apparent when the visualisation is concerned with concurrent computations, as an arbitrary state change in a number of processes could be considered an event.
The declarative visualisation model used by PAVENE involves the mapping of the underlying program’s state to a visual image. The state of the underlying computation is accessed by the visualisation component. It is the responsibility of the visualisation developer to specify which elements of the computation's state are of interest to the visualisation. Mapping the specified program states to a collection of four-dimensional graphical objects then generates visualisations. An interesting aspect of PAVENE is its use of program
correctness properties in deciding what elements of a computation should be visualised [15].
ParaGraph
extensions to allow users to construct their own views which are specific to their applications. Developing these views is non-trivial, but once constructed, the new views can be used along
with the original views [16].
Jewel
Jewel is a distributed measurement system developed at the German national research centre for computer science. "Jewel consists of a flexible toolkit for low-interference on-line
performance measurement integrated with a powerful adaptable graphical presentation facility and a generic interactive experiment control system ". Jewels design considerations include: 1) flexibility with regard to the application which can be monitored 2) a central point of control for the experimenter 3) a high degree of precision with regards to the quantitative
results obtained. The property of interference has a direct impact on the precision of results.
Interference refers to the influence the measurement process has on measured quantities. Low-interference is identified as being very important in a distributed system where
instrumented code may produce completely different execution behaviour compared to a non-instrumented system. 4.) An accurate global time base with high-resolution. This global time should be implemented using synchronised hardware clocks 5) on-line visualisation of the System Under Test (SUT).
The jewel distributed measurement environment is composed of four functional blocks. "Measurement data is extracted from the SUT, collected, filtered and processed by the Data Collection and Reduction System (DCRS) and then passed to the Graphical Presentation System (GPS) for visualisation". The experimenter can influence the system by issuing experiment control requests through the Experiment Control System (ECS). The ECS and GPS are fully generic and can be configured for any distributed application. The DCRS has to be adapted per application and uses the combination of instrumented code and dedicated hardware support to extract data from the SUT.
A paper [17] related to the Jewel system discusses the concept of automatic instrumentation.
The structural information of program sources is used as input to the instrumentation process. A modified compiler uses the meta-data generated by the structural analysis of the code to place software triggers. Other options for automatically adding sensors to software include:
instrumented interfaces (e.g. RPC stubs) and instrumented libraries [18].
PARADE is an environment that facilitates the generation of visualisations for concurrent programs. This environment, which is designed for use by programmers, consists of three major components. The first component of the environment is responsible for monitoring the program that is being visualised. The second component maps the data gathered from the program onto graphical entities in the display component. The third component supports the animation system. PARADE uses the Polka animation system to generate its graphical displays; this is because Polka supports the animation of concurrent programs.
PARADE requires the instrumentation of source code for the extraction of data. Hand-annotation of source code is error-prone and labour intensive. The developers of PARADE attempted to address this problem by annotating the resident parallel communication library. PARADE uses the "post-mortem" mode of operation. This involves reading from a trace file, which is produced by the instrumented code. Other interesting elements of PARADE include: 1) the systems ability to visualise very large programs by using a concept called
semantic zooming[19] and 2) the different time perspectives from which an animation of a
program can be viewed i.e. logical clock ordering or global clock ordering.” [20]
2.2.3 Visualisation Systems for object- oriented programs
Jerding at al. State in their paper [5] " We believe that the object-oriented programming
paradigm is an especially natural foundation for visualisation because it fundamentally involves the manipulation of concrete "things": instances, messages, methods and so on. Undoubtedly, programmers will already have a mental model of their software in which entities have visual manifestations. Building visualisation tools for object-oriented systems follows naturally from their correspondence to a visual representation." They go on to specify three main objectives that a framework for the visualisation of object -oriented software must realise:
• Little or no programmer maintenance: The generation of visualisations must involve the minimum amount of work for the programmer otherwise the visualisation tool will not be utilised.
• Present the "right" things: Extraneous information should be omitted from the
visualisation. Only information relating to the dynamic execution of a program should be
portrayed.
The use of virtual reality to visualise object-oriented programs in an educational setting is
discussed in a recent paper [21]. A visualisation in a virtual environment offers four
dimensions, three spatial dimensions and time. The visualisations in this study where concerned with object-oriented design patterns. Class, object and interaction diagrams were identified as the most important paper-based diagrams, which could be represented in the virtual environment. Text descriptions describing entities within the virtual world are incorporated into the system to aid understanding. The paper also discusses the use of VR in visualising Java programs.
2.4 VEDA
VEDA [1] - the Visualisation Environment for Distributed Applications - consists of two
major components, a network simulator and a visualisation toolkit. The visualisation toolkit, which is of more interest to this project, was developed to provide an easy-to-use tool for the visualisation of program behaviour. Its main focus is the visualisation of distributed
algorithms. It provides mechanisms for the collection of visualisation data from distributed application processes dispersed over a number of network nodes. Hand-annotation of the application source-code is the preferred method of instrumentation. VEDA visualisations and the distributed applications that drive them execute concurrently. Visualisation data is transferred via a UDP connection to a centralised visualisation process. The visualisation process is responsible for generating graphical views of the visualised application. Graphical views are constructed from a generic visualisation library. The library contains commonly used graphical representations for distributed applications. The visualisation process operates by sequentially processing the events/data received from application processes. By controlling the processing of the event stream a user can control the visualisation. The event processing can be in one of three modes: stopped, running and single step. In the running mode events are processed as they arrive where as in the single-step mode the next event is only processed at a users request.
The second major component of VEDA is the network simulator [1]. The simulator models a
network may consist of the following components: nodes, broadcast networks, point-to-point networks and routers. The user specifics the behaviour of the network by configuring
individual network components. For example, a router may be set-up to discard packets at random intervals.
2.5 Empirical testing of visualisations
The majority of empirical testing that has been carried-out relates to the effectiveness of algorithm animations. It has been discovered through a series of tests conducted by Badre et
al. [22] that algorithm animations were not successful because the algorithm representations
were based on an expert’s understanding, not a novice’s perspective. This is a common feature of many visualisation systems. In their tests they used an interactive animation to teach a complicated algorithm to computer science graduate students. They also pointed out that students must understand the mapping from algorithm to visual representation. "For a student to benefit from the animation the student must understand both [the] mapping [from the algorithm to the graphics] and the underlying algorithm on which it is based...students just learning about an algorithm do not have a foundation of understanding upon which to
construct the visualisation mapping"
[23].
In other words the students must first understandthe visualisation system before getting any benefit from it
[24]
.Byrne [25] conducted a similar study concerning interactive animations and came to the
following conclusion "The result from the two experiments show an unreliable benefit of animations and predictions on students' ability to solve procedural and conceptual problems with algorithms. This weak effect of animations is inconsistent with the intuitions of many algorithm teachers. It seems clear that the sheer use of algorithm animation does not automatically enhance learning".
However, some algorithm animation studies have had encouraging results. In a recent paper,
Keogh [27] came to the following hypotheses: "Hypothesis 1: The pedagogical value of
algorithm animations will be more apparent in open, interactive learning situations (such as a homework exercise) than in closed exam-style situation" and " Hypothesis 2: animations enhance pedagogy by making an algorithm more accessible and less intimidating, thus
enhancing motivation". Lawerence [26] conducted an experiment that showed that in an
informal setting, where students have free reign over the visualisation system, positive
benefits could be accrued.
[24]
Empirical testing of visualisation systems concerned with performance analysis, software debugging and software maintenance is virtually non-existent. Most systems developed to date are small prototypes and have not been tested in industrial settings. The inability of software visualisation systems to scale is a major problem. When the prototype systems move out of the laboratory and into the real world an appropriate evaluation can take place.
2.6 Summary
The primary aim of this chapter was to study the general research area of software
visualisation and ascertain if there was a gap in the literature in relation to the visualisation of distributed object systems.
After an initial flurry of research and development in this area, the level of interest is now quite modest. A quick glance at the bibliography will bear this out. Many prototype systems have been developed and techniques discovered. However, these prototypes have not scaled and now gather dust as fragile toys. Essentially, there has been a lack of research into how to deal with the large amount of graphical data generated by industrial applications. There is after all only a certain amount of screen real estate.
Another point that should be made is that useful pictures are inherently difficult to draw. This problem is compounded by the fact that individual users of a system do not share common mental models. A given visualisation may appeal to one person and confuse another. Initially people believed the intuitive maxim that pictures are better than words. Visualisation systems where developed and not empirically tested. Empirical tests that have been carried out are nearly universally inconclusive. This is an obvious problem.
However, there have been some successes. The visualisation of small programs for use in the educational arena has produced some good results. Scale is not a problem and visualisations have been specifically tailored to suit student’s needs.
3. Design
3.1 Introduction
This chapter is broken up into the following sections. The first section examines what aspects of CORBA should be represented. The second section explores the visual design of
CORBAvis. The third section details VEDA's design. The fourth section seeks to discover the limitations of VEDA. The fifth section overviews CORBAvis architecture. The sixth section considers the design of CORBAvis components. The last section relates to Swing and AWT.
3.2 What Aspect of CORBA should be represented?
At what level of abstraction should a CORBA application be graphically represented? To facilitate the answering of this question a brief overview of CORBA is required.
3.2.1 CORBA Overview
[image:23.595.77.492.401.681.2]The following figure shows the primary components in the architecture. Descriptions of the components that are pertinent to this discussion are presented below the figure:
Fig 3.1 CORBA Overview
Servant -- " This is an implementation programming language entity that defines the operations that support a CORBA IDL interface. Servants can be written in a variety of languages, including C, C++, Java, Smalltalk, and Ada."[29]
Client -- " This is the program entity that invokes an operation on an object implementation. Accessing the services of a remote object should be transparent to the caller. Ideally, it
should be as simple as calling a method on an object, i.e., obj->op(args). The remaining
components in Figure 3.1 help to support this level of transparency. "[29]
Object Request Broker (ORB) --" The ORB provides a mechanism for transparently communicating client requests to target object implementations. The ORB simplifies
distributed programming by decoupling the client from the details of the method invocations. This makes client requests appear to be local procedure calls. When a client invokes an operation, the ORB is responsible for finding the object implementation, transparently activating it if necessary, delivering the request to the object, and returning any response to the caller."[29]
CORBA IDL stubs and skeletons -- " CORBA IDL stubs and skeletons serve as the ``glue'' between the client and server applications, respectively, and the ORB. The transformation between CORBA IDL definitions and the target programming language is automated by a CORBA IDL compiler. The use of a compiler reduces the potential for inconsistencies between client stubs and server skeletons and increases opportunities for automated compiler optimizations. "[29]
Object Adapter -- " This assists the ORB with delivering requests to the object and with activating the object. More importantly, an object adapter associates object implementations with the ORB. Object adapters can be specialized to provide support for certain object implementation styles (such as OODB object adapters for persistence and library object adapters for non-remote objects)."[29]
3.2.2 CORBA Implementation Overview
Given the infrastructure outlined above CORBA applications can be developed using a number of different techniques. CORBAvis is designed for CORBA applications that use the implementation-based approach to CORBA application development. What this means is that server objects extend or inherit the skeleton class to avail of its functionality. The Tie
implementation approach is not within the scope of CORBAvis. The type of object adapter which a CORBA application uses (Basic Object Adapter (BOA) or the Portable Object Adapter (BOA)) has no bearing on the functionality of CORBAvis.
The implementation of a CORBA application starts by defining an interface in IDL and placing it in a file. We can use a file named Hello.idl for the purposes of illustration. This
file contains an interface definition named Hello with a constituent method say_hello().
When the Implementation approach is specified an IDL compiler using the Hello.idl file will generate the following files:
Hello.java: The IDLtoJava mapping specifies that IDL interfaces are mapped directly to Java interfaces. The Hello.java interface extends org.omg.CORBA.Object, providing standard CORBA object functionality.
HelloHelper.java: This class provides ancillary functionality, namely the narrow method, which is required to convert CORBA object references to their correct types.
HelloHolder.java: This final class provides operations for OUT and INOUT interface arguments, which CORBA has but do not map easily to Java’s pass-by-value semantics.
StubForHello.java: This class provides CORBA functionality for the client. It implements the Hello.java interface
_HelloImplBase.java: This abstract class is the server Skeleton that provides basic CORBA functionality to the server.
within _HelloImplBase. Client processes wishing to avail of the services offered by a server object must obtain a CORBA reference for the said object. This can be done in a number of different ways. Briefly, object references can be obtained by 1) using the CORBA naming service 2) using stringified references where object references are placed in a file which can be accessed by both client and server processes 3) using URLs 4) using a vendor specific binding mechanism. Once the client process obtains the reference a stub or proxy is created with which to communicate with the server object. By calling a method on the proxy an invocation is made to the remote server. Remote method invocations are thus transparent to the application programmer.
3.2.3 Level of abstraction for visualisation
Given the outline above a key design decision of this project was to decide what aspect of the CORBA infrastructure should be visualised. The author considered three different
alternatives:
• The visual representation of the underlying CORBA communication mechanism.
This would involve instrumenting the ORB core. By instrumenting the ORB core the visualisation developer would be able to elicit and explore the complex workings of the ORB. While this would be a useful debugging tool for ORB developers it would have debatable benefits as a teaching aid. The ORB core is very much hidden from the application developer and of little real interest.
• A high-level algorithm animation.
As was discussed in the previous chapter, algorithm animation ignores specific
implementation details and concentrates on representing the algorithm that is being used to solve a problem. While this approach is beneficial in certain teaching contexts, it ignores implementation details. The distributed object system that is used to construct the algorithm would not be visualised.
• The CORBA Object Model.
implementation-independent way. In this model clients request services from objects (which will also be called servers) through a well-defined interface. This interface is specified in OMG IDL
(Interface Definition Language). A client accesses an object by issuing a request to the
object. The request is an event, and it carries information including an operation, the object
reference of the service provider, and actual parameters (if any). The object reference is an object name that defines an object reliably. ". [29]
Essentially the object model can be broken down into the following components: Client objects, Server objects and requests. Add to this list the processes which instantiated the objects and the nodes on which the processes reside and we have a comprehensive model of a CORBA application. This model was in fact chosen as the visualization model for CORBAvis for the following reasons:
• It provides a simple yet comprehensive representation of a CORBA application.
• The visualisation model can be automatically driven using the instrumented files
generated by a modified IDL compiler. By instrumenting the stubs and skeletons with visualisation events, object creation and method invocation can be depicted. Events relating to nodes and processes can also be generated.
3.3 Visual Design of CORBAvis
This section of the design chapter examines the design considerations that went into designing the visual capacities of CORBAvis. It then considers the design of a visual vocabulary that complements the visualisation model. The visual vocabulary is the collection of visual representations that match the visualisation model. Lastly it considers the design of CORBAvis's graphical user interface.
3.3.1 Visual Design Concerns
Simplicity
Simplicity in the context of a graphical model essentially means a reduction of screen clutter. There is only a certain amount of screen real estate available. Graphical entities should be designed to convey the underlying entities semantics in the simplest possible way.
Ease of implementation
The graphical engine that will be used to render the graphical entities is of key importance. Certain constraints may be imposed on the design of the visual vocabulary due to the limitations of the graphical engine. For instance, Java's Swing API cannot render 3-Dimensional shapes. Another consideration (in the opinion of the author) is the fact that graphics programming is a difficult and tedious task. Keeping the visual vocabulary simple reduces the programming effort
Genericness
The visual vocabulary used in the visualisation system should be familiar to users. A learning tool should have as shallow a learning curve as possible. For this reason CORBAvis's visual vocabulary is loosely based on the Unified Modelling Language UML.
Closely match the users mental model.
As has been discussed in previous chapter it is important to develop a visual vocabulary that is compatible with a user's mental model. This is a very difficult thing to do and would perhaps be more suited to a Ph.D. thesis. However, it is hoped that keeping the visual vocabulary as simple and generic as possible will go some way to achieving this aim.
Convey the dynamic aspect of system execution.
3.3.2 Visual Vocabulary Design
The visual representation for each component in the visualisation model is examined below:
[image:29.595.92.202.219.392.2]Nodes
Fig 3.2 Visual Representation of a Node
Nodes on which CORBA processes reside are depicted as solid quasi-3-Dimensional rectangles. The colour of the node has no real significance except in the role of a visual aid. Basically, colour is used to distinguish one node. There is a predefined set of colours that can be ascribed to nodes. The name of the node together with its Internet address is placed at the bottom of the rectangle.
Processes
Fig 3.3 Visual representation of a process
Object
Fig. 3.4 Visual representation of an Object
Server objects are represented by a black square enclosed within a black circle. The
interfaces that a server supports are represented as a projection from the server object ending in a filled circle. The colour of this circle represents the interface that is supported by the server. Black was chosen as a uniform colour for server objects so that the interfaces that they support may be highlighted. The black circle that surrounds the square is there for aesthetic reasons only. The server name is placed in the bottom left-hand corner. The name refers to the interface that the server supports.
Client objects have the same form as server objects except they do not have interface projections. The colour of client objects represents the interfaces for which clients are proxies. All client names are prefixed by the word "proxy-". Client proxy names can be specified by the user or generated automatically by the visualisation system.
Method Invocations
Method invocations are depicted using an animated directed line. Animation is used to convey the dynamic aspect of method invocation. The invocation line emanates from the middle-left of client objects and is directed towards the appropriate server object's invocation projection. The invocation line is retracted upon invocation return.
Object Creation
Annotation
The depictions of method invocations are accompanied with textual references called annotations. Annotations are employed to highlight method invocations to the user.
Annotations are also used to give more detailed information about server objects. Clicking on a server object will result in an annotation appearing, detailing the methods of the interface that the server supports.
3.3.3 Graphical User Interface Design
The graphical user interface is mostly inherited from VEDA. The two most important components of the GUI are examined below:
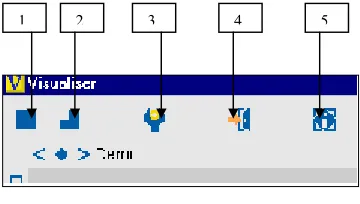
Toolbar
[image:31.595.193.373.389.491.2]The visualiser toolbar is inherited from VEDA and has the following functionality:
Fig 3.5 screenshot of toolbar
Button 1: This button is responsible for running the visualisation, stopping the visualisation and stepping through the visualisation.
Button 2: This button switches the visualisation into single step mode.
Button 3: This button is used to change the speed of the visualisation
Button 4: This button closes the visualisation.
Button 5: This button is redundant.
The Invocation Display
Fig 3.6 screenshot of Invocation panel
The invocation panel provides detailed information about the method invocations that are being and have been depicted in the visualiser. An entry in the invocation panel gives the following information about an invocation:
• Invocation Requests
A typical entry in the invocation panel for an invocation request would look like this:
Account.deposit( float [100.0] )
The name of the client-object together with the name invocation is detailed. Any parameters that the method may have are also represented with a parameter type and value.
• Invocation Return values
Invocation return values are added to the invocation list entry upon invocation return:
Account.deposit( float [100.0] ) == >> 0.0()
3.4 Design of VEDA
Before exploring the detailed design of CORBAvis it is necessary to take a look at VEDA’s design and assess it’s suitability with regard to generating automatic visualisations of
CORBA applications and supporting the visual vocabulary described in the previous section. Before assessing VEDA's suitability for the job at hand it is necessary to take a closer look at VEDA's design.
3.4.1 Veda Design
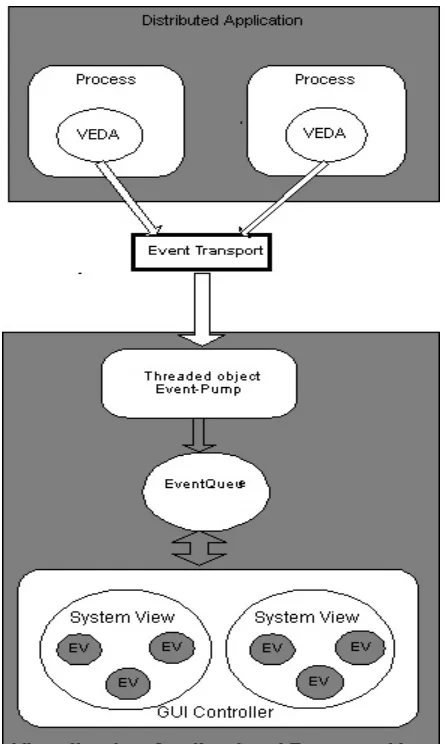
[image:33.595.179.402.314.686.2]The Veda visualization toolkit can be broken into two distinct components, the back-end and the front-end.
Veda Back-end Component
The VEDA back-end is responsible for gathering important events from the application that is being visualized. An application must be manually instrumented or hand-annotated with visualization event calls. There is a fixed set of twelve events that are defined within VEDA. The event calls are placed at points within the application source code that are of interest to the visualization developer. Events must be bound to entities within the application. An entity can be any computing construct. When the application executes, the back-end controller receives visualization events, adds some control information and passes them on to the visualization application.
Veda Front-end Component
The visualization application or front-end may reside on the local host or may be on a remote machine. Visualization events are passed to the visualization application from the back-end controller via UDP.
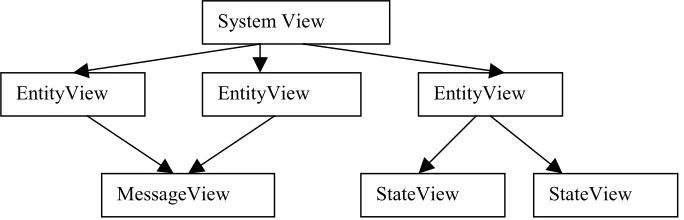
[image:34.595.122.464.536.646.2]Events arriving at the visualization application are queued. Alternatively, the events can be placed in a trace file that can be used for post-mortem [1] execution. The visualization engine is now presented with an unordered set of events to manipulate. Remember that these events are bound to entities or components within the visualized application. Entities defined within the visualized application have a graphical representation in the visualization application known as an EntityView. Veda defines a hierarchy of views:
Fig. 3.9 Graphical View hierarchy
The hierarchy is described as follows:
EntityView: " An Entity view is used to depict a component such as a component such as a process (or thread) or a machine in a network. These can be described as active components.
System View
EntityView EntityView EntityView
The major assumption for an entity is that at any time it must be in one state out of a finite set of states, thus the entity view uses state views."[1]
StateView: "A state View is a representation of one particular state of an entity."
MessageView: "A message View is a representation of a message that was sent by one entity to another entity." [1]
SystemView: " A system view is a container for a set of entity views (including their associated state views and the message views bound to them). Visualization consists of at least one system view. Entities can be represented by different entity views in different system views". [1]
A very important component of the front-end design is the GUI controller. The GUI controller is responsible for removing events from the event queue and passing them on to the
appropriate SystemView it also contains all the functionality for the Graphical User Interface.
Given the communication infrastructure which is responsible for transporting visualization events from instrumented application to the visualization application and the standard set of graphical views provided by VEDA it is now up to the visualization developer to configure the visualization. VEDA provides the visualization developer with two alternative strategies:
1. VEDA provides a standard visualization application, which can be configured using a configuration file. The configuration file details the names of the entities, which will be annotated in the application that is to be visualized. A standard set of entity views is used to represent these entities when events arrive at the visualization application. This method of configuration is very restrictive, as the application programmer must use pre-defined views.
3.5 The limitations of VEDA.
The Veda visualisation toolkit was designed to visualise distributed algorithms. This project is concerned with developing a framework for the automatic visualisation of CORBA
Applications. VEDA has a number of deficiencies in this regard:
• Manual instrumentation.
To produce visualisations the user must hand-annotate the source code that is to be visualised. A prospective user must learn about VEDA and in particular the visualisation events it supports. It is then assumed that the user knows where to place these events so as to produce a meaningful visualisation. This approach is not suitable for non-expert users.
• Space-time diagrams.
Veda uses space-time diagrams as a visual metaphor to depict the dynamic execution of distributed algorithms. While this is a reasonably generic approach it is unsuitable for CORBA applications. Veda provides a degree of configurability through the strategies outlined in the section above. Representations of an entity's state, variables and messages can be altered to suit a given application without modifying VEDA's source code. However, the space-time diagram representation employed by VEDA cannot be re-configured using either of the two strategies.
• Message Paradigm.
Veda is designed to represent a message-passing paradigm using send and receive primitives. CORBA's synchronous method invocations have different semantics. A client invoking a method on a remote server must wait for a reply. In the message passing paradigm it is up to the programmer where and when to block for a receive. This difference in messaging paradigms has consequences at implementation level.
• State and variables
• Animation
Veda does not have built-in animation capabilities. By animation I mean the smooth transition of a graphical entity from one state to another.
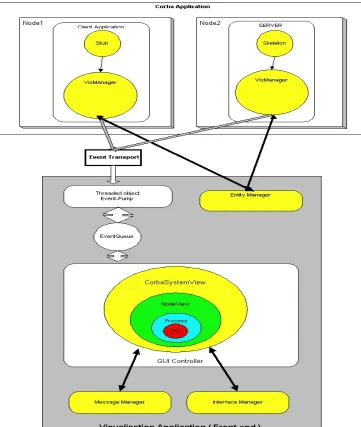
3.6 Overview of CORBAvis architecture.
[image:37.595.116.477.267.694.2]
CORBAvis was designed as an extension to VEDA to overcome the limitations outlined above and also adds some new functionality. The integration of CORBAvis into VEDA's existing visualization framework is depicted below:
Client stubs and server skeletons use the VisManager as a visualisation utility. CORBA objects use the VisManager for initialisation procedures and as a conduit for visualisation events. The VisManager communicates with the EntityManager, which resides in the Visualisation application, to obtain initialisation information. The existing VEDA
[image:38.595.93.509.214.524.2]communication infrastructure is used to transport events to the visualisation application. The GUI controller takes events off the event queue and passes them to the CorbaSystemView.
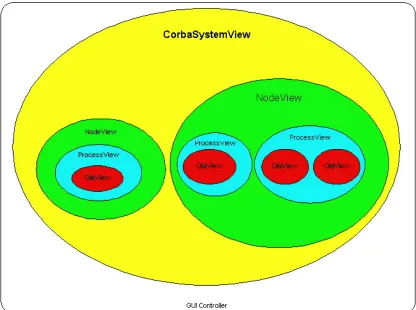
Fig. 3.11 Graphical view containment hierarchy
CorbaSystemView is one of a new set of views to been designed for CORBAvis. The new views: CorbaSystemView, NodeView, ProceesView and ObjView are arranged in the following containment hierarchy:
The CorbaSystemView can contain multiple NodeViews. NodeViews contain one or more ProcessViews. ProcessesViews accommodate one or more objects.
• VisManager
The VisManager acts as a CORBA wrapper for VEDA Back-end Functionality. It interacts with CORBA client and server objects, providing them with visualisation information and generating visualisation events on their behalf.
• CorbaSystemView.
CorbaSystemView extends the functionality of VEDA's front-end component SystemView. CorbaSystemView acts as the parent graphical entity for the other visual entities within CORBAvis, i.e. it acts as a container or canvas on which the other entities are placed. It also acts as a switch for visualisation events.
• NodeView
This component is primarily concerned with visually representing nodes. It also keeps track of the number of CORBA processes and objects that are contained within a given node
• ProcessView
The ProcessView component is responsible for rendering CORBA processes. It also
maintains a list of objects that are contained within a process. ProcessViews resize themselves to accommodate additional objects.
• ObjView
As the name suggests this component embodies the functionality required to visually depict and manage objects.
Utility functions
• MessageManager
The MessageManager is concerned with the management and depiction of method
invocations. It ensures that the stream of invocation events, which are in an arbitrary order, are filtered and organised so that the correct sequence of invocations is depicted on screen.
• InterfaceManager
This component maintains a repository containing all the interfaces known to the Visualisation Application.
• EntityManager
3.7 CORBAvis component design
This section details how the different components in the CORBAvis architecture outlined above interact with each other. Firstly, the back-end components are examined and then the CORBAvis front-end components are examined.
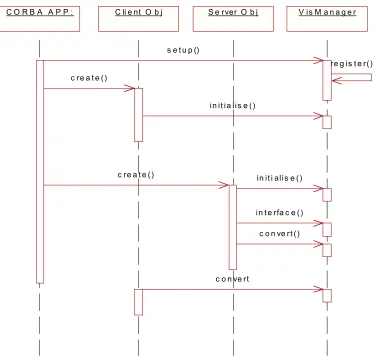
3.7.1 back-end component interaction
C O R B A A P P : C li e nt O b j S e rver O b j V is M a n a g e r
s e t u p ()
c re a t e ()
c re a t e ()
re g is t e r()
in it ia lis e ()
in it i alis e ()
in t e rfa c e ()
c o n ve rt ()
[image:40.595.109.482.254.615.2]c o n ve rt
Fig. 3.12 back-end component interaction diagram
• Visualisation set-up.
VisManager registers with the EntityManager and receives a visualisation identifier, which is used to uniquely identify the CORBA process that instigated the set-up call.
• Object Creation.
When a client or server object is instantiated it makes a request to the VisManager for a visualisation identifier. The object uses this identifier in subsequent visualisation events.
• Interface recording
Server objects pass details about the interface they support to the VisManager.
• String Conversion
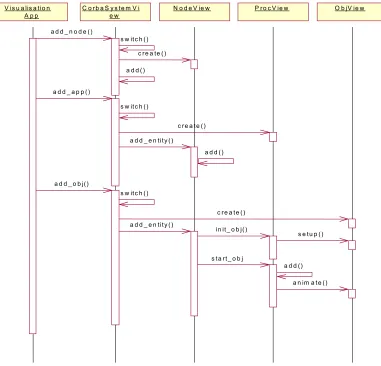
3.7.2 Front-End component interaction
C o rb a S y s te m V i e w
N o d e V ie w P ro c V ie w O b jV ie w V is u a lis a tio n
A p p
a d d _ n o d e ()
s w itc h () c re a te ()
a d d _ a p p ( )
s w itc h ()
c re a te () a d d _ e n tity ()
a d d _ o b j()
s w itc h ()
c re a te () a d d _ e n tity ()
in it_ o b j()
s e tu p ()
s ta rt_ o b j
a n im a te () a d d ( )
a d d ()
[image:42.595.112.493.106.472.2]a d d ()
Fig. 3.13 Visualization component interaction
CorbaSystemView, as was mentioned above, acts as a visualisation event switch. The visualisation application passes events to the CorbaSystemView, which in turn switches them internally so that the appropriate action is taken. The above figure deals with the addition of the defined entities to the visualisation i.e., nodes, processes and objects.
1. If a node entity is to be added to the visualisation, CorbaSystemView creates a NodeView object and adds it to its container.
2. If a process entity is to be added to the visualisation, CorbaSystemView creates a ProcessView object and passes it to the appropriate NodeView. The NodeView object then adds the ProcessView to its container.
The ProcessView prepares the object for rendering through a set-up method call and then adds the ObjView to its container and then starts the object’s growth animation by invoking the objects animate method.
Utility functions
CORBAvis contains a number of utility functions. Namely the MessageManager, InterfaceManager and the EntityManager. The design of the MessageManager and
InterfaceManager is outlined below. A detailed description of the EntiyManager is examined in the implementation chapter
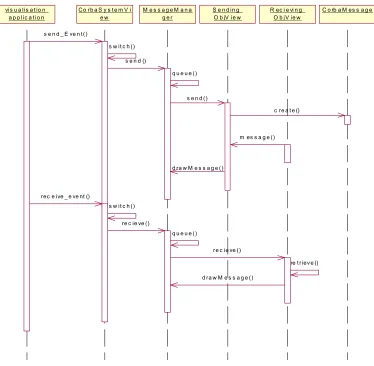
• Message Manager
The Message manager deals with send and receive visualisation events in the following way:
vis u a lis a t io n a p p lic a t io n
C o rb a S y s t e m V i e w
M e s s a g e M a n a g e r
S e n d in g O b jV ie w
C o rb a M es s a g e R ec i e vi n g
O b jV ie w
s e n d _ E ve n t ()
s w it c h ()
s e n d ()
s e n d () q u e u e ()
d ra w M e s s a g e ()
rec e ive _ e ve nt ()
c re a t e ()
s w it c h ()
re c ie ve ()
q u e u e ()
m es s a g e ()
re c ie ve ()
re t riev e ()
[image:43.595.110.484.332.698.2]d ra w M e s s a g e ()
Send_Event()
Send events are passed to the MessageManager from the CorbaSystemView. The MessageManager queues the event if it is out of sync with other messages related to the sending object. When the message is removed from the queue it is sent to the ObjView of the sending object. This ObjView creates a new CorbaMessage and sends it to the receiving ObjView, which stores the message. It then sends the message back to the MessageManager via the drawMessage Method.
Receive_Event()
Receive events are also placed on the MessageManager’s queue. When the event is removed from the queue it is passed to ObjView which represents the object that received the message. This object retrieves the original sent message which corresponds to this receive event and sends it to the messageManager for rendering
• The Interface Manager
GUI Controller CorbaSystem Vi ew()
InterfaceM anag er
ObjV iew
Interface_events()
visualise()
new_interace
[image:44.595.101.474.385.628.2]get_interface()
Fig 3.15 InterfaceManager component interaction
Interface events are passed to the InterfaceManager from the CorbaSystemView. The
3.8 Swing and AWT
Swing and AWT (Abstract Window Toolkit) allow the creation of Graphical User Interfaces (GUIs) for Java Applications and Applets. AWT provides the GUI functionality for JDK v1.0 and JDKv1.1. VEDA uses AWT to produce its graphical representations. For a number of reasons it was deemed necessary to convert elements of VEDA’s graphical components to Swing so as to provide a suitable foundation for CORBAvis. The following section looks at the reason for this design decision and this is followed by a look at the Swing components that are used in CORBAvis.
3.8.1 The rational for converting VEDA to Swing.
Sun Microsystems provided a number of standard reasons for converting AWT-based programs to Swing, the most salient being the fact that Swing components are implemented with no native code. This means that Swing components provide a lot more functionality because they do not have to be designed for a lowest common denominator platform i.e. Swing components run on the JVM platform [28]. In the context of CORBAvis the conversion was undertaken for three main reasons:
1. VEDA uses the AWT Canvas component to render visual entities. To implement the containment hierarchy outlined above in Section 3.6 a number of overlapping
components have to be added to a containing Panel. In AWT this results in the initially added component obscuring subsequent components preventing the containment hierarchy from being rendered. Swings' JPanel provides a solution to this problem. The JPanel can be used to render images but it is also a container. The containment hierarchy can be implemented by adding contained components to a JPanel.
2. AWT does not provide an elegant or easy solution for rendering method invocations once the containment hierarchy has been implemented. The rendering of method invocations requires that a line be drawn across component boundaries. By using a JFrame for the visualisation frame it's GlassPane can be used to draw a line free of component boundary considerations.
For the reasons outlined above certain AWT-based VEDA components had to be converted to Swing Components.
3.8.2 Swing Components
The JFC and Swing where introduced in JDK v1.2. JFC is short for Java Foundation Classes and contains the following features: 1) The Swing Components 2) Pluggable Look & Feel support 3) the accessibility API 3) the Java 2D API 4) Drag and Drop support. The Swing Components are the only element of the JFC that is of interest to the CORBAvis project. Swing components used in the CORBAvis project are described below:
[28]
Frame: “ Implemented as an instance of the JFrame class, a frame is a window that has decorations such as a border, a title, and buttons for closing and iconifying the window. Applications with a GUI typically use at least one frame. ” [28] A JFrame is used as the main window for the visualization application. The GUI controller implements it.
[28]
The glass pane: “Hidden, by default. If you make the glass pane visible, then it's like a sheet of glass over all the other parts of the root pane. It's completely transparent unless you implement the glass pane's paint method so that it does something.” [28]. The glass pane is used to provide an elegant solution to the problem of depicting method invocations.
The content pane: “The container of the root pane's visible components.” [28]
[28]
Panel: “The JPanel class provides general-purpose container for components. By default, panels don't paint anything except for their background, however, you can easily add borders to them and otherwise customise their painting.”[28] The JPanel is the most important graphical component in the CORBAvis GUI. SystemViews, NodeViews, ProcessViews and ObjViews are all implemented using a JPanel. This is because JPanels provide a customisable surface area on which to draw.
[28]
ScrollPane: "A Scrollpane provides a scrollable view of a component. When screen real estate is limited, use a scroll pane to display a component that is large or one whose size can change dynamically. " [28] CORBAvis employs a ScrollPane to provide the visualization application with a larger surface area on which to place graphical components.
[28]
Lists: "A List presents the user with a group of items to choose from. A list can have many items or can grow to have many items, so lists are often used in a scroll pane"[28].
4. Implementation
This chapter deals with the implementation issues involved in CORBAvis. The first section investigates the reasons for selecting ORBacus as the ORB for this project. The second section details the modifications that were made to ORBacus's IDL compiler. The third section examines the resulting modifications made to the IDL compiler's generated files. The fourth and fifth sections describe implementation details of CORBAvis.
4.1 ORBacus and JIDL
Once it had been decided to drive the visualisation from the stubs and skeletons generated by the IDL compiler, it was necessary to find a free ORB and more importantly the source code for a Java-to-IDL compiler. Initially I was interested in the ORB supplied as standard with Sun's JDK v1.2. The reason for this was ease of integration with CORBAvis that is implemented in Java. Source code for the JDK is freely available, however, the IdltoJava compiler is not bundled with JDK v1.2 and the source code for the compiler is not available. The latest version of the Java environment, JDK v1.3, incorporates the IdltoJava compiler (now named idlj) into the standard release. For two reasons I decided to look for a different solution: 1) The source code for the idlj compiler was uncommented and undocumented. 2) The complexity involved in the build process outweighed any gain there might have been from using the Java ORB.
Another possible technique that could have been used to instrument the stub and skeleton code was to use a Pearl script. A Pearl script could parse the files generated by the IDL compiler by looking for recognisable patterns such as method calls and then inserting the visualisation event calls. This technique was discounted for two reasons:
1. The authors lack of experience with scripting languages.
2. A user of the visualisation toolkit would have to run the script every time the IDL compiler re-generated files.