Munich Personal RePEc Archive
Estimating Demand for Nutrients in
Nigeria: A Vector Error Correction
Model
Ogundari, Kolawole
15 February 2011
Estimating Demand for Nutrients in Nigeria: A Vector Error
Correction Model
Kolawole Ogundari
Institute of Food Economics and Consumption Studies, University of Kiel, Johanna-Mestorf-Str. 5,
24098, Kiel, Germany
Email: [email protected]
Preliminary version
Abstract
This article is designed to investigate the existence of relationship between daily per capita demand for nutrients (calorie, protein, and animal fat intake) and economic growth indicator measured by per capita real Gross Domestic Products (GDP). Using annual time series data covering 1961-2007 from Nigeria, the study employed vector error correction model (VECM). The daily per capita demands for nutrients are analyzed as endogenous variables while real per capita GDP was taken as exogenous variable. These series are defined in logarithm. Preliminary investigation revealed that the series were found to be I (1) process at initial level while the series become I (0) after first differences. The trace statistics test shows that the pear of the series on the daily per capita demand for nutrients and per capita real GDP are co-integrated. Hence, the results of VECM shows that in the long-run, per capita real GDP positively and significantly impact per capita demand for nutrients in Nigeria over the years. Specifically, we observed that 1% increase in real GDP significantly increases the demand for calorie, protein and animal fat by 0.073%, 0.068%, and 0.059%, respectively. Also, the result of the short-run dynamics indicated that the speed of adjustment of the demand for calorie, protein and animal fat intake towards long-run equilibrium relationship associated with the shocks in the real GDP from the previous period is about 29%, 41% and 26%, respectively in the current period. Furthermore, we noted that the result of the impulse response function lend support to the observation that real per capita GDP increases the demand for calorie, protein, and fat intake in Nigeria. Our findings provide no support for the hypothesis that growth in real GDP is constrained by the nutrient intake in the same period.
Key words:Real per capita GDP, calorie, protein, fat, long-run relationship, short-run dynamics,
Nigeria
Introduction
Food policy analysts consider the level of nutrient intakes in particular calorie (energy) as an
important indicator of performance measure when it is related to labour productivity. In the
developing economies where agriculture accounts for most of the economic activities, this
observation is taking in high esteem. Stightz, (1976) pointed out the significant role of calorie as
one of the key drivers of productivity and health related issues in the economic development of
any given society.
According to Neeliah and Shakar (2008), nutrition is the fundamental prerequisite for human
welfare and contributes to human and social capita. However, lack of key nutrient intake such as
calories, protein, iron, calcium, and vitamin is a common phenomenon in most developing
countries. Inadequate nutrient can be used to describe dietary shortage or nutrient deficiency in
general. Berg (1981), revealed that there is distinction between nutrition and malnutrition. The
former relates to inadequate nutrient intake while the later refers to an inadequate intake of
specific nutrient.
The main economic determinants of food demand as stressed in the literature are price and
income (Angulo et al, 2001). But there growing resentment among the nutrition economist that
in addition to income and price, nutritional content also informed the demand for food. However,
if food choices are informed by their nutritional values, it is also meaningful to examine, the
demand for nutrients and its key determinants as impetus for effective nutritional policy and
consumer welfare in general.
The relationship between nutrition and consumer’s income has attracted interest among the
researchers for the past four decades. The cause and effect between nutrition and income runs
either ways. Because as income enhances nutrition security, healthy active and nourished citizens
are important precondition for sustained income growth (Benson, 2004). In fact, there are two
lines of inquiries with regards to the relationship between calorie (nutrient) intake and household
income level in the literature as revealed by Bouis (1994). First, does calorie intake rise with
income? Second, is income generation affected by calorie intake? The former underscores policy
relevance of increasing income on the nutritional status of a given population while the later is at
efficiency of workers as a function of their wages through nutrition their income allows them to
purchase.
The econometric analysis of the demand for nutrient vis-à-vis calories has previously been linked
to macroeconomic indicator implied by real per capita GDP (e.g., Bouis 1994; Dawson and
Tiffin 2002; Mushtaq et al., 2007; Neeliah and Shakar 2008; Tiwari and Zaman 2010) and
microeconomic indicator such as the per capita household income ( e.g., Abdulai and Aubert
2004; Bocoum and Dury 2009; Orewa and Iyangbe 2009) around the globe. For example, recent
studies using household survey data from Nigeria (Aromolaran 2004; Babatunde and Qaim 2010;
Ayinde et al. 2010; Babatunde et al 2010) provided empirical nexus between calorie intake and
household’s per capita income with the evidence that per capita income significantly increase
calorie intake in the country. However, the crucial question is that at the national level using
macroeconomic variable, do daily per capita demand for nutrients respond positively and
significantly to economic growth indicator such as per capita real GDP in the long-run in
Nigeria?
Providing answer to this question is important because the estimated nutrient-income elasticities
could be explored as critical parameters needed to determine impacts of any policy change either
in the short or long term period on the consumer welfare in the country. In fact, as pointed out by
World Bank (1986), a good knowledge of how income growth impact the demand for calorie
intake can be used as a guide to alleviate and eventually eliminate inadequate calorie intake
around the globe.
The present study builds on the earlier work by Dawson and Tiffin (1998), Dawson (2002),
Tiffin and Dawson (2002), Neeliah and Shakar (2008), and Tiwari and Zaman (2010) where the
authors investigated the long-run relationship between demand for calorie intake and real per
capita national income represented by real GDP in India, Pakistan, Zimbabwe and developing
countries, respectively using aggregated annual time series data from respective countries.
Therefore, contrary to these studies, the study seeks not only to understand how real per capita
national income response to calorie intake but also to examine how real per GDP respond to
other nutrient intake vis-à-vis daily per capita protein and fat intake by using annual time series
curves which is defined to investigate the long-run and short run dynamics relationship between
daily per capita nutrient and real per capita national income (GDP) in Nigeria over time.
To the best of our knowledge, there is dearth of study relating economic growth indicator
implied by real GDP and the demand for nutrients in Nigeria. This observation, however,
motivated this study. Hence, we envisage that the study will contribute to the existing literature
on the food demand analysis in the country. Specifically, it is envisaged that the outcome of the
study will be useful as an important planning tools for food policy design in Nigeria.
The rest of the article is structured as follows. Section 2 discusses theoretical framework. Section
3 describes the methodology vis-à-vis the data, estimation method and model specification, and
empirical model. Section 4 focuses on the results and discussion. The final section offers the
conclusions and policy implications.
2 The theoretical model
The theoretical framework for the present study is defined to enable us understand how per
capita nutrient intake respond to its key determinants in Nigeria. Hence, the demand for
nutrients NTt is assumed to depend on quantity of food consumed (FCt) and level of per capita
income in a given period “t” as specified below.
(
)
t t t
NT = f FC ,Y 1
where f represents connecting function. In the present framework, we assumed that at
equilibrium, quantity of food consumed (FCt) equate the quantity of food produced (FPt)1
ceteris paribus. Conversely, FPt is assumed to depend on a number of factors which includes; national population (Nt), food price (Pwt), and taste (Tt) as:
(
)
t t wt t
FP = f N ,P ,T
2
Substituting equation 2 into 1 gives
(
)
t t wt t
NT = f N ,P ,T ,Y 3
1 This assumption seems plausible in the developing economy like Nigeria where subsistence agriculture characterized food production with zero
Dividing equation 3 all through by Nt gives per capita value of the variables in the equation 3
which yields
(
NT N = f P ,T , Y Nt t)
(
wt(
t t)
)
4The economic interpretation of equation 4 is that, per capital nutrient intake NT Nt t depends on
price of food (Pwt), taste (Tt), and per capita income Y N ceteris paribust t . Because taste (Tt) is
difficult to measure while large changes in consumption patterns create difficulties in choosing
appropriate weights for food prices (Pw), we follow Reuthger and Selowsky (1976), Dawson
(2002), Dawson and Triffin (1998), Triffin and Dawson (2002) and Mustaq et al (2007)
framework where sole determinant of per capita nutrient intake
(
NT Nt t)
is real per capitanational income
(
Y Nt t)
specified as2:(
NT N = f Y Nt t)
(
t t)
5By taking the logarithm of equation 5 gives a specification that is consistent with aggregated
Engel’s curve when
(
NT Nt t)
is regressed on(
Y Nt t)
as:(
t t)
(
t t)
tlog NT N = + log Y N + μ β ε 6
The estimated coefficient β is regarded as nutrient-income elasticity. μ is the intercept. εtis
the traditional white noise error assumed with mean zero and constant variance.
Because the study covers three different nutrients vis-à-vis calories, protein and fat intake in
Nigeria, the study elicit
(
NT Nt t)
as daily per calorie intake in kcal represented byCt, daily per capita protein intake in gram represented Pt and daily per capita fat consumed in gramrepresented byFt. To avoid tedious exposition, we dropped
(
NT Nt t)
simply as NTt and(
Y Nt t)
as Yt in the subsequent section.
2 Specifically, Dawson and Triffin (1998), Triffin and Dawson (2002) and Mustaq et al. (2007), respectively observed that inclusion of weighted
3. Methodology
3.1. The data
The data used for the study represents the annual series for 1961-2007 (47 years) which covered
daily per capita calorie intake in kilocalories, daily per capita protein intake in gram and daily
per capita fat intake in gram from Nigeria. The data are derived from the national food balance
sheets based on food supply which is the annual residual from the total food supply less feed,
seed, industrial uses and waste (FAOSTAT, 2010). The food nutrient data was also
supplemented from the World Development Indicators dataset obtained from the World Bank
website on the current per capita Gross Domestic Product-GDP expressed in million Nigerian
Naira (World Bank, 2010). The per capital GDP was later deflated by using GDP deflator also
obtained from the World Development Indicators dataset.
The use of real per capita GDP as a proxy for consumer income is less than an idea. According
to Tiffin and Dawson (2002), changes in the real GDP which arise for different reasons, may
affect calorie consumption of different consumers in different ways. For example, incident of
drought may have possibility of distorting food production and affect per capita GDP. Hence, our
approach fits within a body of literature which examines the calorie-income relationship at the
aggregate level (see Dawson, 1997; Dawson and Tiffin 1998; Dawson 2002; Tiffin and Dawson
2002; Mushtaq et al, 2007; Tiwari and Zaman 2010).
However, as stressed by Harris (1995), many economic time series are non-stationary and such
ordinary least squares (OLS) regression between non-stationary data will lead to spurious results.
Hence, the data generating process (DGP) for time series data require that we check for the
property of the series such as presence of unit root and existence of co-integration relationship
between the pair of series available prior the empirical analysis. This is essential because the
presence of unit root in the autoregressive representation of a time series data leads to
non-stationary, and such series is referred to as being integrated of order one (i.e., I (1)). The
implication of this is that I (1) series must be first-differenced to render the series stationary or
being integrated of order zero (i.e., I (0)). Intuitively, where I (1) series move together and their
linear combination stationary, the series are co-integrated and the problem spurious regression
Also, existence of co-integration relationship between series is important to establish whether
there is an evidence of a meaningful long-run relationship between series. This is because
co-integrating relationship cannot exist between two variables which are integrated of a different
order. In view of this, we make attempt to test for the order of integration of the variables using
Johansen (1988) trace test approach.
3.2. Estimation method and model specification
The employment of a particular econometric model depends on the relationship between the
economic time series (Labys, 2006). Economic theory highlights the bi-directional causality
effect between the demand for nutrient and per capital income (Triffin and Dawson 2002). That
is better nutrition could lead to increase income known in the literature as efficiency wage
hypothesis developed by Stightz (1976). Conversely, increase income could improve nutritional
status of an individual in a given society.
In light of this, we specify the econometric analysis of the relationship between the demand for
nutrient (NTt) and real per capita income (Yt) using Vector Auto-regression (VAR) framework
as:
1 1 2 2 1 1
t t t k t k + t
Z = +A Zμ − + A Z− +... + A−Z− + ε 7
where Ztis a vector of I(1)) endogenous variables such that Z = NT ,Yt
[
t t]
′ which is a (2x1) vector ; μ is a (2x1) vector parameters; εtis a (2x1) vector of white noise errors with[ ]
tE ε = 0. k is the number of lags. By including lagged values for both NTt and Yt implies that
the specification will allow for a wide variety of dynamic patterns in the series.
Because Vector Error Correction Model (VECM) adds error correction terms (ECT) to a
multi-factor model such as Vector Autoregression (VAR) above; such that VECM could be explore to
develop a refined dynamic model which has a focus on short-run adjustment in addition to the
long-run equilibrium relationship between any pair of series. Like VAR, VECM could be used to
simultaneously investigate effect of income on the demand for nutrient as well as effect of
nutrient on the per capita income. Both VAR and VECM do not require the specification of
The study employed VECM and a typical VECM can be written as:
{
1 1 2 2 1 1
t t t k t k + t k t
lo ng run equilibrium short run dynamics
Z = + μ ω Z− + ω Z− +... + ω − Z− + πZ− + ε
− −
Δ Δ Δ Δ
14444444244444443 8
1
t t t
Z = Z Z−
Δ − while Δ is difference operator; ω and π are (2 x2) matrices of parameters with
(
1 1 2)
k = A A ... Ak
ω − − − − − ,
(
k = 1, 2,....K)
and π = ...− −1 π1−π2− πk.Equation 8 provides short run adjustment dynamics and long-run relationship to changes in Zt
through ωkand π, respectively while information about the long run equilibrium relationship
between the variables in Ztis provided by πZt k− . The number of co-integrating relationship
among the variables in Ztis provided by the rank of πdenoted by r. If πis of reduced rank, the
model is subject to a unit root; and if 0 < r < k, πcan be decomposed into π αβ = ′with a two (k
x r) matrices α andβ , where β′Zt k− is stationary. Hence, α =
[
α α1 , 2]
is an adjustment matrixotherwise known as error correction term (ECT) which measures the speed of adjustment in ΔZt
while β =
[
β β1 , 2]
is the co-integrating vectors with r distinct co-integrating vectors whichmeasures co-integrating relationship between non-stationary variables in Zt. Therefore when
equation 8 is re-written in full matrix it becomes:
(
)
11 12 1
1 1
1 2
1 21 22
2 2 1
K
k , k ,
t t k t k t
k k , k ,
t t k t k t
NT NT NT
= + +
Y Y Y
ω ω ε
μ α
β β
ω ω
μ α ε
− −
= − −
Δ ⎛ ⎞ Δ
⎛ ⎞ ⎛ ⎞ ⎛ ⎞ ⎛ ⎞ ⎛ ⎞ ⎛ ⎞
+
⎜ ⎟
⎜Δ ⎟ ⎜ ⎟ ⎜Δ ⎟ ⎜ ⎟ ⎜ ⎟ ⎜ ⎟
⎝ ⎠ ⎝ ⎠
⎝ ⎠
∑
⎝ ⎠⎝ ⎠ ⎝ ⎠ ⎝ ⎠ 9To simultaneously ascertain the effect of per capita income on the demand for nutrient and effect
of nutrient on the per capita income, Lütkepol’s (1993) orthogonalise impulse response analysis
is used in the present study. Impulse response according to the author gives a better picture of the
relationship between pair of series for further policing. Besides, impulse response could as well
be used to assess adjustments to long-run equilibrium between the pair of series. Specifically, if
two co-integrated variables let say A and B are in a meaningful long-run equilibrium (i.e., π
-matrix is of the rrank determined by the trace statistics), what impulse response analysis does is
to show how shocks from one variable let say A impact another individual variable B or better
deviation from the long-run equilibrium are believed to be stationary, therefore, any shock to the
system will generate time paths which eventually return to a new equilibrium provided no further
shocks occur. In summary, each impulse response is the response of a variable to a shock of one
standard error in another variable.
3.3. Empirical model
Modeling long-run relationship between demand for nutrient and real per capita GDP:
Following the work of Dawson (1997), Dawson and Tiffin (1998), Tiffin and Dawson (2002)
and Mustaq et al. (2007), the empirical model to investigate the long-run relationship between
nutrient intake and level of real per capita GDP in Nigeria using aggregated Engel curve is
specified as follows:
1 2
1 0
K K
t k t k k t k t
k k
NT = + μ β NT− + β Y− + ;t = 1961,1962,...2007ε
= =
∑
∑
10where NTt=
[
C , P , Ft t t]
′ is a vector of endogenous variables which represents nutrient intake considered in the present study. The nutrients; Ct= daily per capita calorie intake, Pt= daily percapita protein intake and Ft= daily per capita fat intake.
Modeling the short-run dynamic between demand for nutrient intake and real per capita GDP:
The essence of short-run dynamics analysis is to investigate the length of time it will take change
in the demand for nutrient ΔNTt to adjust in case there is any disturbance away from the equilibrium as a result of change in real per capita income ΔYt in order to restore the long-run
equilibrium relationship between them. Specifically, the short-run speed of adjustment α1shown
in the equation 11 measures how fast deviations from the long-run equilibrium are eliminated
following changes in the demand for nutrient and real per capital income.
A typical short run dynamic model for the relationship between nutrient intake and per capita
1 1 2 1 1 1
1 1
K K
t k t k k t k t t
k k
NT = μ + ω NT− + ω Y− + α ECT +− ε
= =
Δ
∑
Δ∑
Δ 111
t
ECM − represents the error correction term derived from the long-run co-integrating relationship
of equation 10. The α is the speed of adjustment for the dependent variables usually expressed
in percentage when the endogenous variables are in logarithm form.
The JmulTi software (http://www.jmulti.org) was used to estimate the parameters of the equation
10-11 using Johansen (1988) reduced rank regression in a single stage with r =1.
4. Results and Discussion
4.1. The trends in the demand for nutrient and real GDP in Nigeria, 1961-2007
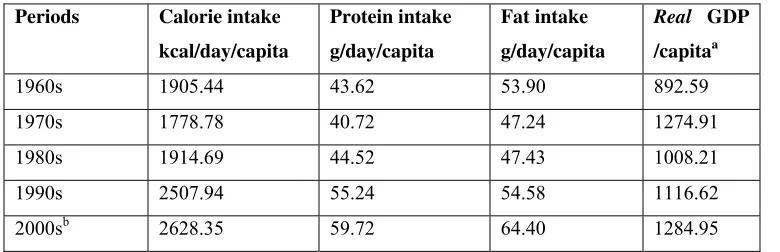
Table 1 presents the result of a 10 years average in the demand for nutrient and real per capita
GDP in Nigeria from 1961-2007. Also, presented in Figure 1 is the plot of the demand for
nutrients and real per capita GDP within the same period under scrutiny.
Although not presented in table format to conserve space, the summary statistics of the series
showed that an average daily per capita calorie of 2,116 kcal was obtained which varied between
1,947 kcal in 1961 to 2,741kcal in 2007 with an average annual growth rate of about 0.87%. The
growth rate is comparatively higher than 0.6% obtained in Pakistan by Mushtaq et al., (2007).
The average calorie intake of 2,116 k cal in Nigeria was found to be lower to the FAO
recommended 2500kcal/day for an adult in Nigeria. Likewise, we observed an average daily
protein intake of about 48g which varied between 46g and in 1961 to about 63g in 2007 with an
annual average growth rate of about 0.84%. An average daily fat intake of about 53g was
observed which varied between 56g and 66g in 1961 and 2007, respectively with an annual
growth rate of about 0.41%3. The estimated average 48g of crude protein from the data is far
below the minimum recommended daily requirement for an adult in Nigeria which varies
between 65-85g per person per day (Omotosho 2004)
3
Table 1 shows that there is evidence of increasing trend in the demand for nutrient in Nigeria for
the period 1961-2007. For example, using the 10 years average data presented in Table 1, we
observed that the per capita calorie, protein and fat intake decreased by about 7%, 7% and 12%,
respectively between 1960s and 1970s. Further analysis indicated growth of about 8%, 9%, and
0.4% in the consumption of calories, protein and fat, respectively between 1970s and 1980s.
Also, growth rate of about 31%, 24% and 15% in the demand for calorie, protein and fat,
respectively was noted from the analysis between 1980s and 1990s. Although still increasing, but
at slow rate, our series show growth increase of about 5%, 8% and 0.4%, respectively for the
demand for calorie, protein and fat intake between 1990s and 2000s. The real current per capita
GDP expressed in the local currency (Naira) was found to have an annual growth rate of 1.45%
between the same periods from 1961-2007.
An intrinsic part of Table 1 is the fact that, daily per capita calorie intake in Nigeria was found to
be highest in the 2000s with an average energy intake of 2,628 kcal which is quite above the
FAO recommended daily calorie intake of 2500kcal for an adult. Similar observation was noted
for protein and fat intake for the same period. A plausible argument for this could be attributed
to various policies and reform initiated by the Nigeria government to improve consumption and
equitable income distribution in Nigeria. A significant example of these polices is National
Economic and Empowerment Development Strategy (NEEDS) introduced since 2001.
The plots of the real GDP and the demand for nutrients in Figure 1 revealed that the nutritional
status of Nigerian increased with real GDP while the trend analysis on the bottom right of the
figure shows that the demand for nutrients and real GDP trend upward which is an indication of
a positive correlation between them. This observation is contrary to observation of Deaton and
Dreze (2009) that per capita calorie and protein intake in India is declining despite the rise in the
Table 1: Trends in Nutrient intake in Nigeria, 1961-2007
Periods Calorie intake kcal/day/capita
Protein intake g/day/capita
Fat intake g/day/capita
Real GDP /capitaa
1960s 1905.44 43.62 53.90 892.59 1970s 1778.78 40.72 47.24 1274.91 1980s 1914.69 44.52 47.43 1008.21 1990s 2507.94 55.24 54.58 1116.62 2000sb 2628.35 59.72 64.40 1284.95 aThe real GDP is expressed in the local currency Unit (LCU)-Naira; bthe 2000s covered 2000-2007; source: FAO data base
4.2. Unit root and co-integration test
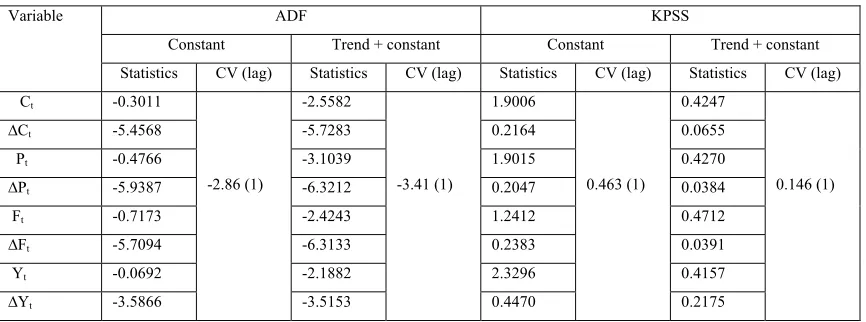
In testing for the presence of unit root in the series in logarithm, we employed both the
Augmented Dickey-Fuller (ADF) test (Dick and Fuller, 1981; Said and Dickey 1984) and the
KPSS tests (Kwiatkowski et al. 1992) presented in Table 2 with lag equals 1. The ADF test is
under the null hypothesis of a unit root (i.e., I(1)) while the alternative hypothesis is stationarity
in the series (i.e., I(0). The KPSS test is under the null hypothesis of stationarity ( i.e., I(0))while
the alternative hypothesis is a unit root in the series ( i.e., I(1)). The number of the lags is guided
by the Akaike Information Criterion (AIC) to ensure that the series serial correlation in the series
is absent.
The test was carried with the specification of only constant on one hand and trend plus constant
on the other hand as presented in table 2. The result revealed, however, that the series are
non-stationary (i.e., the series are I (1) process) while the series become stationary after first
Table 2: Unit root tests
Variable ADF KPSS
Constant Trend + constant Constant Trend + constant Statistics CV (lag) Statistics CV (lag) Statistics CV (lag) Statistics CV (lag) Ct -0.3011
-2.86 (1) -2.5582 -3.41 (1) 1.9006 0.463 (1) 0.4247 0.146 (1)
∆Ct -5.4568 -5.7283 0.2164 0.0655
Pt -0.4766 -3.1039 1.9015 0.4270
∆Pt -5.9387 -6.3212 0.2047 0.0384
Ft -0.7173 -2.4243 1.2412 0.4712
∆Ft -5.7094 -6.3133 0.2383 0.0391
Yt -0.0692 -2.1882 2.3296 0.4157
∆Yt -3.5866 -3.5153 0.4470 0.2175
CV implies critical value at 5% level of significance
Following the result of the unit root tests, we sought to determine the existence of co-integration
relationship between the pair of the series using the Johansen (1988) trace statistics. The trace
statistic is designed to test the null hypothesis of at most r co-integrating vectors against the
alternative that the number of co-integrating vectors is greater than r.
Table 3 presents the result of the trace statistics for non-trended model with only constant
included in the series. The LR-tests in the table revealed that the null hypothesis of no
co-integration vector (i.e., r = 0) between the pair of the series is rejected with p-value of 0.000
while null hypothesis of one co-integration relationship (i.e., r=1) between the pair of the series
[image:14.612.71.444.513.612.2]could not be rejected at p-value ranges between 0.11-0.18.
Table 3: Trace statistics
Equation tests Ho H1 Trace statistics CV of Trace p-value
Ct,Yt
r=0 r=1 r=1 r=2 38.80 6.21 20.16 9.14 0.0000 0.1810
Pt,Yt
r=0 r=1 r=1 r=2 42.66 7.45 20.16 9.14 0.0000 0.1067
Ft,Yt
r=0 r=1 r=1 r=2 44.03 6.39 20.16 9.14 0.0000 0.1679
CV implies trace statistics with critical value at 5% level of significance
In summary, the results of table 2 and 3 indicated that, the π -matrix in the equation 8 is of
level but there also existence of a single co-integrating vector between the pair of the series
which is an indication of a meaningful long run relationship between them.
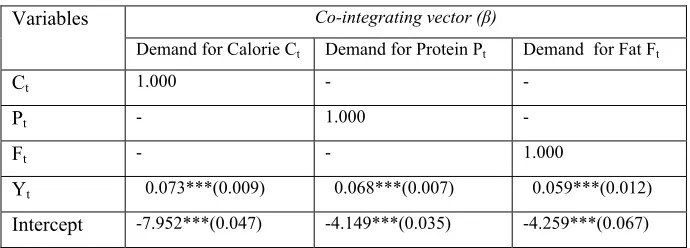
4.3. Estimates of Long-run co-integration relationship
Following the evidence of the single co-integration analysis between the pairs of the series,
presented in Table 4 is the result of the Co-integrating vectors β which depict the long-run
relationship elasticity between the demand for nutrient and real per capita national income
implied by the real GDP in Nigeria without trend.
The empirical estimates revealed that real per capita national income significantly and positively
increased the demand for calorie, protein and fat from 1961-2007 in Nigeria. Specifically, our
estimates revealed an income-calorie elasticity of 0.073, income-protein elasticity of 0.068, and
income-fat elasticity of 0.059. Economic interpretation of these figures is that over the years, 1%
increased in the real per capita national income increases the calorie, protein and fat consumption
in Nigeria by 0.073%, 0.068%, and 0.059%, respectively. One plausible hypothesis justifying the
positive relationship between real per capita national income and calories consumption in
Nigeria could be associated with the fact that increase in calorie intake is due to increase in the
level of physical activity in the country. Of course, this make sense considering the fact that
Nigeria being an agrarian economy with over 70% of her population engage in agriculture and
agricultural related activities with rudimentary farming tools that require a significant amount of
energy (Ogundari and Ojo, 2005). It may also be due to various polices aimed at improving
nutrition and increase income at household level in the country over the years by successive
governments.
A comparatively analysis of the estimated calorie-income elasticities in the present study with
previous studies indicated that, our estimate is far below 0.34, 0.31, and 0.12 obtained for India,
Zimbabwe, and Pakistan by Dawson and Tiffin (1998), Tiffin and Dawson (2002) and Mushtaq
et al. (2007), respectively.
The significant of the intercepts across the equations in table 4 suggests that even at zero income,
a minimum level of calorie, protein and fat intake are necessary to maintain healthy life in the
Table 4: Long-run equilibrium estimates for the demand for nutrient
Variables Co-integrating vector (β)
Demand for Calorie Ct Demand for Protein Pt Demand for Fat Ft
Ct 1.000 - -
Pt - 1.000 -
Ft - - 1.000
Yt 0.073***(0.009) 0.068***(0.007) 0.059***(0.012)
[image:16.612.76.421.100.224.2]Intercept -7.952***(0.047) -4.149***(0.035) -4.259***(0.067)
Figure in parenthesis are standard error; *** implies that the estimates are significant at 1%.
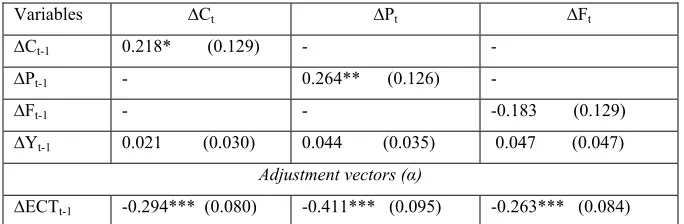
3.4. Estimates Short-run dynamics
Table 5 presents the result of the short run dynamics between the demand for nutrient and real
per capita GDP in Nigeria. The result revealed a positive and significant effect of previous
calorie demand on the current calorie intake while effect of the previous real per capita income
was found to be positive on current demand for calorie intake within a short-term. The later is
significantly not different from zero. This observation also applies to the demand for protein and
fat intake as presented in the second and third column of Table 5, respectively.
However, the result of the adjustment vectors have the correct sign and it is significantly
different from zero for each of the equations. Specifically, the size of the speed of adjustment α1
shows that the deviation of the change in the demand for calorie, protein and animal fat from
long-run equilibrium associated with the long-run value of the change in the real per capita GDP
in the previous year is corrected by about 29%, 41%, and 26%, respectively in the current period.
These estimates, however, indicated that there is evidence of slow adjustment to long-run
equilibrium as a result of shocks in the real per capital national income by the demand for
nutrients in Nigeria which call for attention. The demand for protein was found to have the
slowest adjustment, calorie and finally animal fat.
Typically, one would expect a five to ten years period for full adjustment by consumers to a
change in income, but our results prove otherwise. The slow adjustment of the demand for the
nutrients could probably associate with the nexus between general consumption pattern and
Although, it is evident that in the long-run relationship the demand for calorie response faster to
the rise in per capita national income in Nigeria, nonetheless, the short-run dynamics relationship
shows that the demand for protein adjust faster to deviation from long-run equilibrium associated
with the long-run value of the real per capita income in the previous year compared to the other
two nutrients considered in the present study. The implication of this is that, any policies
targeted at increasing per capita income within a short term might lead to increase in protein
consumption in the country while long term policies might favour calorie consumption in the
[image:17.612.75.417.277.389.2]country.
Table 5: Short-run dynamics and adjustment vectors
Variables ∆Ct ∆Pt ∆Ft
∆Ct-1 0.218* (0.129) - -
∆Pt-1 - 0.264** (0.126) -
∆Ft-1 - - -0.183 (0.129)
∆Yt-1 0.021 (0.030) 0.044 (0.035) 0.047 (0.047)
Adjustment vectors (α)
∆ECTt-1 -0.294*** (0.080) -0.411*** (0.095) -0.263*** (0.084)
Figure in parenthesis are standard error; *, ** and *** implies that the estimates are significant at 10%, 5%, and 1%, respectively.
3.5. Impulse response estimate
Impulse responses give a better picture of the relationship between co-integrated series as
stressed by Lükepohl (1993). In light of this, figures 2-4 demonstrate the response of the demand
for nutrients to increase in the real per capita GDP and vice versa to the unitary orthogonal
shocks in the series for 40 years horizon with 95% confidence bounds. Because the series are
expressed in logarithms, the responses are interpreted as annual percentage changes.
Hence, Figure 2 (left hand side) shows the response of calorie intake to one standard error shock
in the per capita income measured by real per capita GDP. The graph revealed initial response of
0.011% which decreased to -0.01% within the span of 3 years period. This later increased rapidly
to 0.04% for the next 23 years before returning back to the long-run equilibrium. That is within
in the next 23 years, the real per capita calorie intake respond positively to increase per capita
GDP before reaching long run equilibrium.
Economic interpretation of these estimates is that, increasing real per capita income in Nigeria
has a positive effect on nutritional status of Nigerians which also support earlier finding of the
long-run equilibrium relationship between calorie intake and per capita income of Table 4.
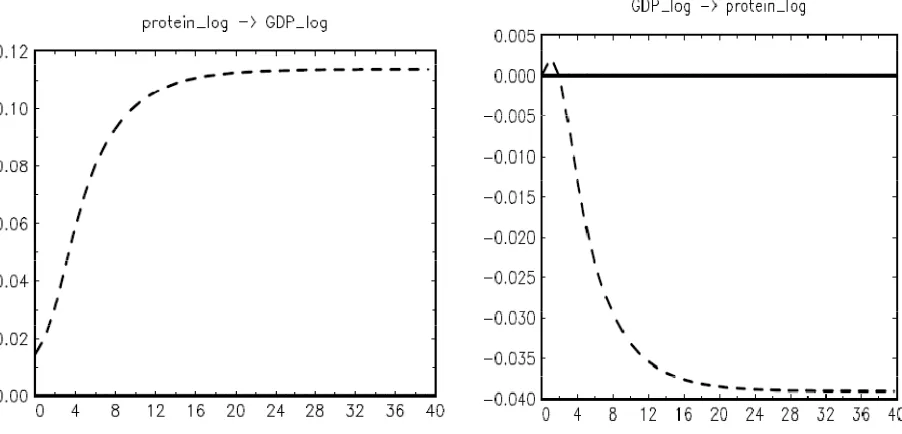
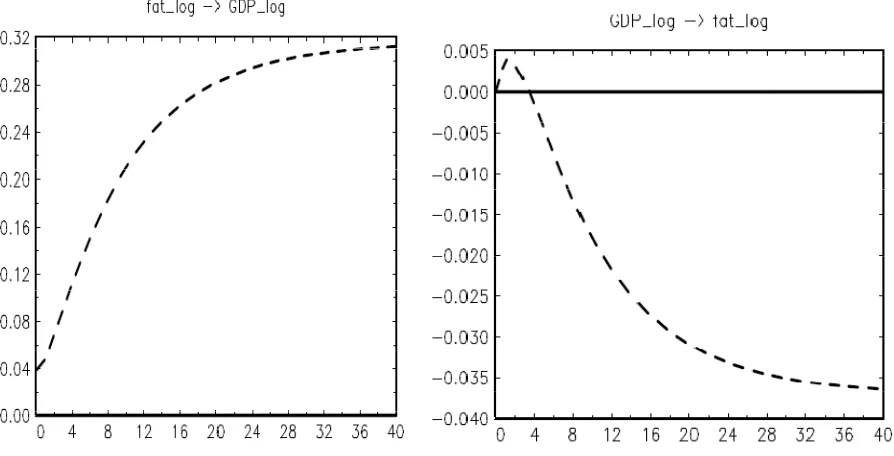
Similar observation was noted for responses of the demand for protein and fat intake to the
shocks from the real per capita income which is presented in the left hand side of figure 3 and 4,
respectively. For example, with initial effect of 0.018% and 0.04%, respectively for the demand
for protein and fat, respectively, the responses increased to 0.11% for protein and 0.38% for fat
before reaching equilibrium level in about 40 years and 31 years span. Meaning that, there is
evidence that increase in real per capita income has a positive effect on the demand for protein
and fat in Nigeria over the years. These results lend support to the conclusions of the work of
Dawson and Tiffin (1998), Tiffin and Dawson (2002) and Mostiq et al., (2007) that calorie
intake is determined by real per capita income in India, Zimbabwe and Pakistan , respectively.
Conversely, we found no evidence that one standard error shocks in the demand for calorie,
protein and fat presented in the right hand side of the figure 2, 3 and 4, respectively, have
significant effect on the real per capita GDP in the present study.
In summary, while there is evidence that economic growth indicator implied by real per capita
national income influences the demand for calorie, protein and fat in Nigeria, there is no
evidence that real per capital national income is constrained by nutritional status of Nigerians as
also noted by Deolaiker (1998) and Dawson and Tiffin (1998) for Indian datasets. This
observation substantiates theory underlying Engel curve relationship.
4. Conclusions
This paper made attempt to estimate the long-run equilibrium relationship and short- run
adjustment parameters between the demand for nutrients (i.e., calorie, protein, and fat intake) and
economic growth indicator denoted by the real per capita Gross Domestic Product (GDP) from
Nigeria. Using annual time series data covering 1961-2007, the study employed a vector error
The result of the long-run equilibrium relationship between the pair of the series revealed that
real per capita GDP positively and significantly impact the demand for calorie, protein and fat
intake in Nigeria over the years. Specifically, we found evidence that 1% increase in real per
capita national income raises the daily per capita calorie, protein, and fat intake significantly by
0.073%, 0.068%, and 0.059%, respectively. This, however, is an indication that in the long-run,
economic growth indicator enhances nutritional status of Nigerians.
Also, the result of short-run dynamics indicated that, adjustment of the demand for calorie,
protein and fat intake towards long-run equilibrium relationship associated with short-run shocks
in the real per capita GDP (economic growth indicator) from the previous period is about 29%,
41% and 26%, respectively in the current period. Meaning that in the short term, the demand for
the consumption of fat respond faster to any increase in the real per capita national income.
Besides this, we observed that all estimated speed of adjustment parameters indicated slow
adjustment to long run equilibrium.
The economic implication of these findings suggest that, in the long term, the real per capita
GDP have a significant positive effect on the demand for the nutrient in Nigeria whilst the
demand for consumption of fat was found to respond faster to shocks in real per capita GDP in
the short-term. Of course, these observations implied that, economic policies aimed at increasing
per capita national income in the short-term might possibly induce the demand for the
consumption of animal fat relative to other nutrients. In a related development, policies aimed at
increasing per capita national income in the long term might favour calorie consumption in the
country.
A Further confirmation of the earlier observation that, real per capita GDP positively impact the
demand for nutrients is the result of the estimated impulse response function. The result clearly
shows that, one standard error shocks in real per capita GDP increased the demand for calorie,
protein, and fat take rapidly to 0.04%, 0.11%, and 0.38%, for a period of 23 years, 40 years, and
31 years, respectively before the system returns back to long-run equilibrium. These estimates
unfortunately are further indication of slow adjustment to long-run equilibrium between the
demand for nutrients and real per capita income as earlier noted in Nigeria.
In conclusion, our findings: First lend support to the economic theory that increase in the real
per capita national income is capable of increasing nutritional status of Nigerian ceteris paribus;
inadequate nutrient intake with capability to minimize food-poverty incidence in Nigeria;
Thirdly, we found no evidence that one standard error shocks in calorie, protein and fat intake
have a significant positive effect on the real per capita national income in the study.
Acknowledgement
The author gratefully acknowledges the financial support of the Alexander von Humboldt (AvH) Foundation towards his postdoctoral fellowship at the Institute of Food Economics and Consumption Studies, University of Kiel, Germany.
References
Aromolaran A.A.(2004). Household income, women’s income share and food calorie intake in
south western Nigeria, Food Policy Vol.29:507-530.
Ayinde. I.A., D.Akerele and A.O. Dipeolu (2010). Socio-economic determinants of calorie
intake among members of farm households in Ogun state Nigeria. Journal of Food,
Agriculture & Environment Vol.8 (2):209-212.
Angulo. A. M., J. M. Gil and A. Gracia (2001). Calorie intake and income elasticities in EU
countries: A convergence analysis using co integration. Paper in regional Science 80:
165-187.
Babatunde, R. and M. Qaim (2010). Impact of off-farm income on food security and nutrition in
Nigeria, Food policy 35: 303-311.
Babatunde, R. O., A. O. Adejobi and S.B. Fakayode ( 2010). Income and calorie intake among
farming households in rural Nigeria: Results of parametric and Non-parametric analysis.
Journal of Agricultural Sciences, Vol. 2 (2): 135-146.
Benson, T (2004). Africa’s food and nutrition security situation: where are we and how did we
get there? 2020 Division paper No.37.International Food Policy Research Institute
(IFPRI), Washington DC.
Berg, A (1981): Malnourished people: A policy view. Washington DC, World Bank Poverty and
Bious, H. E. (1994). The effects of Income on demand for Food in Poor Countries: Are our
Databases giving reliable estimates? Journal of Development Economics, 44: 199-226.
Bocoum. I. and S. Dury (2009). Non-parametric and parametric analysis of Engel function for
calorie, dietary diversity and food shares in the calories, in rural and urban Mali. Paper
presented at the Journees Jeunes Chercheurs, INRA SAE 2, Montpeller, October 1-2.
Deaton, A and J Drèze (2009): “Food and Nutrition in India: Facts and Interpretations”,
Economic & Political Weekly, 14 February.
Dawson, P.J. (2002). Nutrition in Pakistan: Estimating the Economic Demand for Calories.
Pakistan Journal of Nutrition 1(1):64-66.
Dawson, P.J and R. Tiffin (1998). Estimating the demand for calories in India. American Journal
of Agricultural Economics, 80: 474-481.
Dawson, P. J. (1997). The demand for calories in developing countries. Oxford Development
Studies, 25(3): 361-369.
Deolaiker, A. B. ( 1998). Nutrition and Labour productivity in Agriculture: Estimates for Rural
India. Review of Economic Statistic, 70: 406-413.
Dickey, D. A and W.A. Fuller (1981). Likelihood ratio statistics for autoregressive time series
with a unit root, Econometrica , 49:1057-72.
FAO (2010) Food Balance sheet and Food supply.
http://faostat.fao.org/site/609/default.aspx#ancor. Accessed on the 16th November 2010.
Harris, R. (1995). Using Co-integration Analysis in Econometric Modeling. Prentice-Hall,
Harvester Wheatsheaf, London.
Johansen, S (1988). Statistical Analysis of Co integration Vectors, Journal of Economic
Dynamics and Control, 12; 231-254.
Kwiatkowski, D., P.C. B.Philip, P. Schmidt and Y. Shin (1992). Testing the null hypothesis of
Labys, W.C. (2006). Modeling Forest casting primary commodity prices. Asgate, Hampshire,
UK; ISBN 0-7546-4629-7.
Lütkepol, H (1993): Introduction to multiple Time series Analysis, Springer-Verg, New York.
Mushtaq, K., A. Gafor and A. Abedullah (2007). An examination of calorie demand relationship
in Pakistan. Pakistan Journal of Nutrition 6(2): 159-162.
Neeliah, H and B. Shankar (2008). Is nutritional improvement a cross or consequence of
economic growth? Evidence from Mauritius. Economic Bulletin, Vol.17 (8): 1-11.
Ogundari, K. and S. O. Ojo (2005). Determinants of technical efficiency in mixed crop food
production in Nigeria: A Stochastic Parametric Approach. East Africa Journal of Rural
Development Vol. 21(1): 15-22.
Omotosho, J. S (2004). Key note address proceeding of the FISON annual conference of
Fisheries society of Nigeria.
Orewa, S. I and C. O. Iyangbe (2009). Determinants of Daily Food Calorie Intake among Rural
and Low-Income Urban Households in Nigeria. Middle-East Journal of Scientific
Research 4 (4): 297-30.
Reuthinger, S and M. Selowsky (1976). Malnutrition and Poverty: Magnitude and Policy
options. Baltimore, World Bank/John Hopkins University.
Said, S.E and D.A. Dickey (1984). Testing for unit roots in Autoregressive-moving average
models of unknown order. Biometrika, 71: 599-607.
Stightz, J. E (1976). The efficiency wage hypothesis; surplus labor and distribution of income in
LDC. Oxford Economic papers 28(2): 185-207.
Tiffin, R and P.J. Dawson (2002). The demand for Calories: some further Estimates from
Zimbabwe. Journal of Agricultural Economics, Vol. 53 (2): 221-232.
Tiwari, S. and H. Zaman (2010). The impact of Economics Shocks on Global Undernourishment,
Policy Research Working Paper 5215, Poverty Reduction and Equity Unit of the World
World Bank (2010). Country specific World Bank Data Base.
http://data.worldbank.org/country/Nigeria. Access on the 16th November, 2010.
World Bank (1986). Poverty and hunger –issues and options for food security in Developing
Figure 2: Impulse response for the demand for calorie intake in Nigeria, 1961-2007
[image:25.612.90.541.381.598.2]