Reliability of Thyroid Imaging Reporting and Data System
(TIRADS) Classification in Differentiating Benign from
Malignant Thyroid Nodules
*
Boniface Moifo1#, Emmanuel Oben Takoeta1,2, Joshua Tambe1, François Blanc2, Joseph Gonsu Fotsin1
1
Department of Radiology and Radiation Oncology, Faculty of Medicine and Biomedical Sciences, The University of Yaoundé I,Yaoundé, Cameroon
2
Centre Hospitalier de Lagny, Marne La Vallée, France Email: #[email protected]
Received July 2,2013; revised August 2, 2013; accepted August 9, 2013
Copyright © 2013 Boniface Moifo et al. This is an open access article distributed under the Creative Commons Attribution License, which permits unrestricted use, distribution, and reproduction in any medium, provided the original work is properly cited.
ABSTRACT
Background: Ultrasonography (US) is the best diagnostic tool in the initial assessment of thyroid nodule. Giving its appropriateness and accessibility, ultrasound-based thyroid imaging reporting and data systems (TIRADS) classifica- tions have been developed with main goal to standardize reporting and facilitate communication between practitioners, and to indicate when fine-needle aspiration biopsy (FNAB) should be performed. Objective: To determine the reliabil- ity of Russ’ modified TIRADS classification in predicting thyroid malignancy. Materials and Methods: It was a cross sectional study carried out at Centre Hospitalier de Lagny, Marne La Vallée (France). Consecutive records of patients with focal thyroid nodules on ultrasound (US) for which US-guided FNAB was performed and pathology results were available, from January 2007 to August 2012, were selected for review. The risk of malignancy of each TIRADS cate- gory was determined and correlation with pathology assessed. Statistical performances of some US features were also assessed. The threshold for statistical significance was set at 0.05. Results: A total of 430 records of patients were eligi- ble. Twenty-three out of 430 (5.3%) nodules were malignant. The risk of malignancy of the TIRADS categories were as follows: TIRADS2 0%, TIRADS3 2.2%, TIRADS4A 5.9%, TIRADS4B 57.9%, TIRADS5 100% (Gamma statistic = 0.85; Spearman correlation = 0.30, Pearson’s R = 0.37, p < 0.001). Some US features were associated with a higher risk of malignancy: irregular contours (OR= 22.4), taller-than-wide shape (OR = 19.5), microcalcifications (OR= 15.2), and marked hypoechogenicity (OR = 12.7). Conclusion: Russ’ modified TIRADS classification is reliable in predicting thyroid malignancy. More evidence is nevertheless necessary for widespread adoption and use.
Keywords: TIRADS; Thyroid Nodule; Thyroid Cancer; Ultrasonography; Fine-Needle Biopsy
1. Introduction
Ultrasonography (US) is widely used in the assessment of the thyroid gland. Among the different pathologies that can be depicted and characterized by US are nodules. Nodules can be benign or malignant. Some studies have
shown that less than 10% of thyroid nodules are malig- nant [1,2] and that thyroid US depicts nodules in up to 50% to 67% of the population [3-5].
Some US-features are in favor of benignity or malig- nity, especially when grouped together. Suspicious nod- ules will require fine-needle aspiration biopsy (FNAB) for pathology analysis. When should FNAB be per- formed? Although some guidelines have been proposed [2,6-8], some confusion still exists as the same nodule may be classified differently using different guidelines implying different diagnostic or therapeutic attitudes.
*Competing interests: The authors declare that they have no competing
interests.
Authors’ contributions: BM conceived the study and participated in its design, review of the images, data collection and drafting of the manu-script. EOT participated in the study design, review of the images, data collection and statistical analysis. JT participated in the review of the images, statistical analysis and proof-reading of the manuscript. FB examined all the patients and participated in data collection. JGF par-ticipated in the study design and proofreading of the manuscript. All authors read and approved the final manuscript.
#Corresponding author.
understood by clinicians and also stratify the risk of ma- lignancy of a lesion based on the US features of the le- sion. Horvath et al. described 10 US patterns of thyroid nodules and related the rate of malignancy according to the pattern [9]. However, these US patterns were not ap- plicable to all thyroid nodules and appeared difficult to use in routine clinical practice. Park et al. [11] proposed an equation for predicting the probability of malignancy in thyroid nodules on the basis of 12 US features. Al- though this approach makes it possible to stratify nodules into categories, it can be difficult to assign every thyroid nodule into the equation proposed in clinical practice. To further achieve a practical tool in the hands of sonogra- phers in analysing thyroid nodules and to improve com- munication between radiologists and clinicians, Russ et al. [12] proposed a TIRADS classification that was fur- ther modified after feedback from those who used it [13].
It is therefore apparent that a highly reliable, repro- ducible and clinically practical TIRADS classification will greatly improve communication between clinicians and radiologists. This will even be more helpful in set- tings where FNAB is not readily available and so deci- sions will therefore be based to a great extent on the US features of the lesions and TIRADS classification as this implies the potential risk for malignancy. It is against this background that this study was designed to assess the reliability of the modified TIRADS classification pro- posed by Russ et al. [13] in risk stratification for malig- nancy in a group of patients who had FNAB performed on some focal thyroid nodules.
2. Materials and Methods
It was a cross-sectional descriptive and analytical study carried out at Centre Hospitalier de Lagny, Marne La Vallée (France) from July 2012 to January 2013 with retrolective data collection. Authorization for the study was obtained from the local hospital authorities. Con- secutive records of all patients from January 2007 to August 2012 with focal thyroid nodules on ultrasound (US) for which US-guided fine-needle aspiration biopsy (FNAB) was performed and pathology results were available were selected for review. All records without available digital thyroid US images and those with inde- terminate cytology/histology were excluded.
2.1. Imaging and Imaging Analysis [5]
All US scans of the thyroid gland and neck areas were performed using a linear-array transducer (5 - 12 MHz) on a Philips US scanner (iU22 Philips Medical Systems, Bothell, Wash) using an optimized gain. One radiologist
the internal component (solid, mixed or cystic), the mar- gins, echogenicity, evidence of calcifications and the shape. Margins were classified as well circumscribed, lobulated or irregular. Echogenicity was classified as “hyperecho- genicity”, “isoechogenicity”, “hypoechogenicity” and “marked hypoechogenicity”. Isoechogenicity was de- fined as an echogenicity similar to that of the adjacent healthy thyroid gland. A nodule was classified as “marked hypoechogenicity” if the echogenicity was less than that of the superficial surrounding neck muscles. When pre- sent, calcifications were categorized as micro-calcifica- tions (< 3 mm) and macrocalcifications (> 3 mm with acoustic shadowing). The shape of the nodule was cate- gorized as “taller-than-wide” (greater in its antero-poste- rior dimension than in its transverse dimension) and “wider-than-tall”.
Using the modified Russ classification [13], each nod- ule was classified into a TIRADS category (1, 2, 3, 4A, 4B and 5) based on the US features.
2.2. US-Guided FNAB
After US evaluation of the thyroid gland, US-guided FNAB was performed by the same radiologist who per- formed the US scan. US-guided FNAB was performed with a 23-gauge needle attached to a 10ml disposable plastic syringe. Materials obtained from aspiration biopsy were expelled onto glass slides, smeared and sent to the pathology laboratory. Cytopathologists of the hospital specializing in thyroid pathology interpreted the smears. During the study period, the cytology reports were clas- sified as benign, indeterminate, suspicious for carcinoma, malignant, or inadequate. Histology was performed if cytology was indeterminate or suggestive of malignancy.
TIRADS classification algorithm from Russ classifica- tion [13] is showed in Figure 1.
2.3. Data Collection and Analysis
Figure 1. TIRADS classification algorithm [13].
the malignant groups with respect to the TIRADS ca- tegories. The threshold for statistical significance was set at 0.05. All statistical analysis was performed using the software IBM SPSS 20.0 (SPSS Inc, Chicago, USA).
3. Results
A total of 430 records of patients who fulfilled the in- clusion criteria were selected for the study. Twenty-three out of 430 (5.35%) nodules were histologically proven to be malignant.
3.1. TIRADS Categories, Cytology Results and Risk of Malignancy
The US features of each thyroid nodule were character- ized and classified into different TIRADS categories, as shown in Figure 2. The TIRADS 3 category was domi- nant, accounting for 226 cases (52.6%).
The different TIRADS categories were confronted with the results of pathology and the risk of malignancy was calculated (Table 1). The risk of malignancy was found to increase from TIRADS 3 to 5. Computed sym- metric statistics for the strength of association between benign and malignant cytology results in the different TIRADS categories were found to be statistically sig- nificant (p < 0.001).
Combining TIRADS 2, 3 and 4A as probably benign US findings, and TIRADS 4B and 5 as probably malig- nant US findings as shown in Table 2, the sensitivity, specificity, positive predictive value and negative predic- tive value were respectively 98.03%, 52.17%, 97.32% and 60%. The overall accuracy of ultrasound was 95.58%.
[image:3.595.68.279.84.323.2]Figure 2. TIRADS categories of the study population.
Table 1. TIRADS categories and risk of malignancy.
Pathology TIRADS
category Benign Malignant Total
Risk of malignancy (%)
TIRADS 2 83 0 83 0
TIRADS 3 221 5 226 2.2
TIRADS 4A 95 6 101 5.9
TIRADS 4B 8 11 19 57.9
TIRADS 5 0 1 1 100
Total 407 23 430 -
[image:3.595.308.538.257.374.2]Symmetric measures: Gamma statistic = 0.85 (p < 0.001); Spearman corre- lation = 0.30 (p < 0.001); Pearson’s R = 0.37 (p < 0.001).
Table 2. TIRADS categories and diagnostic performance of US.
Pathology TIRADS category
Benign Malignant Total
TIRADS 2, 3, 4A 399 11 410
TIRADS 4B, 5 8 12 20
Total 407 23 430
3.2. “Major” Ultrasound Findings
The “major” US features suggestive of malignancy were analyzed with respect to TIRADS categories. Sensitivity, specificity, positive predictive value, negative predictive value and odds ratio were calculated for each feature. Tables 3 and 4 show the different statistical analysis of the major US features with respect to cytology/histology results, and their respective performance.
A summary of the major US features suggestive of malignancy are presented in Table 4 alongside their re- spective performance.
4. Discussion
[image:3.595.308.538.434.509.2]Benign Malignant
Present 2 8 10
Irregular margins
Absent 405 15 420
Present 0 1 1
Taller-than-wide
shape Absent 407 22 429
Present 5 7 12
Microcalcification
Absent 402 16 418
Present 2 3 5
Marked
hypoechogenicity Absent 405 20 425
Irregular margins: odds ratio for benign cytology: 0.21 (95%CI: 0.06 - 0.72). Odds ratio for malignant cytology: 22.40 (95%CI: 12.47 - 40.23).
Taller-than-wide shape: odds ratio for malignant cytology: 19.50 (95%CI: 12.98 - 29.25). Microcalcification: odds ratio for benign cytology: 0.43 (95%CI: 0.22 - 0.85). Odds ratio for cytology: 15.24 (95%CI: 7.74 - 30.02).
Marked hypoechogenicity: odds ratio for benign cytology: 0.42 (95%CI:
[image:4.595.59.286.102.257.2]0.14 - 1.23). Odds ratio for malignant cytology: 12.75 (95%CI: 5.54 - 29.35).
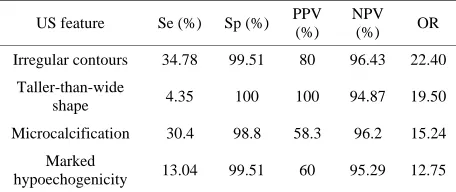
Table 4. Summary of the statistical performance of the ma- jor US features.
US feature Se (%) Sp (%) PPV (%)
NPV (%) OR
Irregular contours 34.78 99.51 80 96.43 22.40
Taller-than-wide
shape 4.35 100 100 94.87 19.50
Microcalcification 30.4 98.8 58.3 96.2 15.24
Marked
hypoechogenicity 13.04 99.51 60 95.29 12.75
Se = Sensitivity; Sp = Specificity; PPV = Positive Predictive Value; NPV = Negative Predictive Value; OR = Odd Ratio.
useful for routine clinical practice, it should be simple to use, reproducible and very reliable.
Thyroid cancer is a relatively rare entity, with an esti- mated prevalence of about 5% [4,5,14]. The proportion of malignant thyroid nodules obtained in this study was similar to this value. A high accuracy of any classifica- tion in predicting malignant thyroid lesions will be par- ticularly of help in resource-limited settings where patho- logical analysis is not routinely performed even when confronted with some suspiciously malignant lesions. The diagnostic accuracy of US in this study exceeded to that obtained by Moon et al. [15] in 2002.
From our results, the risk of malignancy significantly increased from TIRADS 3 to 5. This was zero for TI- RADS 2, and would be expected to be so since TIRADS 2 is considered ultrasonographically as a typically benign lesion. In his work, Horvath suggested a malignant risk of less than 5% for TIRADS 3, 5% to 10% for TIRADS 4A, 10% to 80% for TIRADS 4B and greater than 80%
malignancy of thyroid nodules. So if properly classified on US the probability of a particular nodule being ma- lignant can be inferred from the TIRADS category with a certain level of confidence and appropriate measures for management can be initiated.
Most cancers were found in the TIRADS 3, 4A and 4B categories. We can infer from this that most cancers will have US features that may seem probably benign ultra- sonographically, or have features that mimic a low or a high suspicion for malignancy. So very few cases of ma- lignancy will have the very typical ultrasound features that are consistent with malignancy. This further justifies the advocacy for FNAB when lesions are not typically benign ultrasonographically.
The presence of some US features had earlier been described as highly suspicious for malignancy, and they include marked hypoechogenicity, taller-than-wide shape, irregular contours and the presence of calcifications [5, 6, 12]. In our study, these features were found to be highly suspicious for malignancy as can be seen from the odds ratios, sensitivities, specificities, PPV and NPV. How- ever we did not assess the probabilities of malignancy of associated features, which was found to increase in a previous study [5]. In one study Hong YJ et al. [16] con- cluded that the three sonographic features that are mean- ingful findings in the diagnosis of thyroid malignancy were the presence of microcalcifications, marked hypo- echogenecity and a taller-than-wide shape. In a multicen- tre Korean retrospective study, the US features that were statistically significant for malignant thyroid nodules were hypoechogenicity, marked hypoechogenicity, non- parallel orientation, microlobulated or speculated margin, ill-defined margins and the presence of micro-calcifica- tions [17]. In the latest study, 7.3% of malignant nodules did not have suspicious-malignant features on US.
This study has not been void of limitations, which in- clude retrolective data collection and the fact that his- tology was not available for all of the thyroid nodules, as those with a benign cytology were not operated for ethi- cal reasons. However, this can be compensated by the high NPV of cytology.
5. Conclusion
[image:4.595.58.286.369.465.2]6. Acknowledgements
The authors wish to thank the team of the Pathology De- partment of the Centre Hospitalier de Lagny, Marne La Vallée (France) for helping with cytology/histology re- cords of patients in this study.
REFERENCES
[1] L. E. Koike, S. Noguchi, H. Yamashita, T. Murakami, A. Ohshima, H. Kawamoto and H. Yamashita, “Ultrasono- graphic Characteristics of Thyroid Nodules: Prediction of Malignancy,” Archives of Surgery, Vol. 136, No. 3, 2001, pp. 334-337.doi:10.1001/archsurg.136.3.334
[2] E. Papini, R. Guglielmi, A. Bianchini, A. Crescenzi, S. Taccogna, F. Nardi, C. Panunzi, R. Rinaldi, V. Toscano and C. M. Pacella, “Risk of Malignancy in Nonpalpable Thyroid Nodules: Predictive Value of Ultrasound and Color-Doppler Features,” The Journal of Clinical Endo-crinology & Metabolism, Vol. 87, No. 5, 2002, pp. 1941- 1946.doi:10.1210/jc.87.5.1941
[3] J. K. Hoang, W. K. Lee, M. Lee, D. Johnson and S. Far- rell, “US Features of Thyroid Malignancy: Pearls and Pitfalls,” Radiographics, Vol. 27, No. 3, 2007, pp. 847- 860. doi:10.1148/rg.273065038
[4] K. M. Kim, J. B. Park, S. J. Kang and K. S. Bae, “Ultra- sonographic Guideline for Thyroid Nodules Cytology: Single Institute Experience,” Journal of the Korean Sur- gical Society, Vol. 84, No. 2, 2013, pp. 73-79.
doi:10.4174/jkss.2013.84.2.73
[5] J. Y. Kwak, K. H. Han, J. H. Yoon, H. J. Moon, E. J. Son, S. H. Park, et al., “Thyroid Imaging Reporting and Data System for Ultrasound Features of Nodules: A Step in Establishing Better Stratification of Cancer Risk,” Radi-ology, Vol. 260, No. 3, 2011, pp. 892-899.
doi:10.1148/radiol.11110206
[6] E. K. Kim, C. S. Park, W. Y. Chung, K. K. Oh, D. I. Kim, et al., “New Sonographic Criteria for Recommending Fine-Needle Aspiration Biopsy of Nonpalpable Solid Nodules of the Thyroid,” American Journal of Roent- genology, Vol. 178, No. 3, 2002, pp. 687-691.
doi:10.2214/ajr.178.3.1780687
[7] M. C. Frates, C. B. Benson, J. W. Charboneau, E. S. Ci- bas, O. H. Clark, et al., “Management of Thyroid Nodules Detected at US: Society of Radiologists in Ultrasound Consensus Conference Statement,” Radiology, Vol. 237, No. 3, 2005, pp. 794-800.doi:10.1148/radiol.2373050220
[8] C. Capelli, M. Castellano, I. Pirola, D. Cumetti, B. Agosti, E. Gandossi and E. Agabiti Rosei, “The Predictive Value of Ultrasound Findings in the Management of Thyroid Nodules,” QJM: An International Journal of Medicine, Vol. 100, No. 1, 2007, pp. 29-35.
doi:10.1093/qjmed/hcl121
[9] E. Horvath, S. Majlis, R. Rossi, C. Franco, J. P. Nied-mann, et al., “An Ultrasonogram Reporting System for Thyroid Nodules Stratifying Cancer Risk for Clinical Management,” The Journal of Clinical Endocrinology & Metabolism, Vol. 95, No. 5, 2009, pp. 1748-1751. doi:10.1210/jc.2008-1724
[10] American College of Radiology, “Breast Imaging Re-porting and Data System. Breast Imaging Atlas,” 4th Edi-tion, American College of Radiology, Reston, 2003.
[11] J. Y. Park, H. J. Lee, H. W. Jang, H. K. Kim, J. H. Hi, et al., “A Proposal for a Thyroid Imaging Reporting and Data System for Ultrasound Features of Thyroid Carci- noma,” Thyroid, Vol. 19, No. 11, 2009, pp. 1257-1264. doi:10.1089/thy.2008.0021
[12] G. Russ, C. Bigorgne, B. Royer, A. Rouxel and M. Bien- venu-Perrard, “The Thyroid Imaging Reporting and Data System (TIRADS) for Ultrasound of the Thyroid,” Jour- nal of Radiology, Vol. 92, No. 7-8, 2011, pp. 701-713. doi:10.1016/j.jradio.2011.03.022
[13] G. Russ, “Thyroid Imaging and Reporting Database Sys- tem,” 2013. www.tirads.com.
[14] D. S. Dean and H. Gharib, “Epidemiology of Thyroid Nodules,” Best Practice & Research: Clinical Endocri-nology & Metabolism, Vol. 22, No. 6, 2008, pp. 901-911. doi:10.1016/j.beem.2008.09.019
[15] H. J. Moon, J. M. Sung, E. K. Kim, J. H. Yoon, J. H. Youk and J. Y. Kwak, “Diagnostic Performance of Gray- Scale US and Elastography in Solid Thyroid Nodules,” Radiology, Vol. 262, No. 3, 2012, pp. 1002-1013. doi:10.1148/radiol.11110839
[16] Y. J. Hong, E. J. Son, E. K. Kim, J. Y. Kwak, S. W. Hong and H. S. Chang, “Positive Predictive Values of Sono-graphic Features of Solid Thyroid Nodule,” Clinical Im- aging, Vol. 34, No. 2, 2010, pp. 127-133.
doi:10.1016/j.clinimag.2008.10.034
[17] J. Y. Kwak, I. Jung, J. H. Baek, S. M. Baek, N. Choi, Y. J. Choi, et al., “Image Reporting and Characterization Sys-tem for Ultrasound Features of Thyroid Nodules: multi-centrickorean Retrospective Study,” Korean Journal of Radiology, Vol. 14, No. 1, 2013, pp. 110-117.
![Figure 1. TIRADS classification algorithm [13].](https://thumb-us.123doks.com/thumbv2/123dok_us/7842445.734368/3.595.68.279.84.323/figure-tirads-classification-algorithm.webp)