Detection and Comparison of Power Quality
Disturbances using Different Techniques
Rajesh Ingale
1
stV.D.F.School of Engineering and Technology, Latur, India.Airport Road, New MIDC, Latur - 413 531
Laxman Tawade
2
ndV.D.F.School of Engineering and Technology,
Latur, India.Airport Road, New MIDC, Latur -413531
ABSTRACT
Poor power quality can cause serious problems causing malfunction, instability, short lifetime, memory loss and data errors of sensitive loads etc. Electric power quality has become an important issue now days. To improve the power quality, sources of disturbances as well as detection techniques must be known. The purpose of this paper is to present different detection techniques for sag, swell, harmonics and make comparison between them. Signal processing techniques are used to extract features from measured data and detect triggering points or transition segment of disturbances.
Keywords
Digital storage oscilloscope (DSO), Discrete Fourier transforms (DFT), Fast Fourier transforms (FFT), Root Mean Square (rms), single line to ground (SLG) fault, and Short Time Fourier transforms (STFT)
1.
INTRODUCTION
The term power quality is defined as the concept of powering and grounding sensitive equipment in a manner that is suitable to the operation of that equipment [1]. To prevent problems on utility and customer power system; power quality monitoring is necessary. Detection and classification of power quality disturbances assist in preventive and predictive maintenance. Detection of disturbances with the accuracy by using varies detection techniques is very much important work; newer mathematical techniques are continuously being applied to enhance the accuracy of these techniques. Once the disturbances are detected it is easy to classify these disturbances for finding sources of these disturbances. For the purpose of classification, artificial intelligence based different techniques are being used widely. Power quality is need for new automatic detection and classification methods. Especially voltage sag, swell and harmonics affect power quality. Semiconductor, chemical and mechanical industries are very sensitive to power quality problems. The diagnosis will ensure quality of power and will reduce the risk of interruption by reducing the diagnosis time and finding the problem. Using best signal processing technique and by continuous monitoring can identify failing component and reduces unscheduled outages.
Voltage sag is defined as a decrease in root mean square (rms) voltage at the power frequency for duration from 0.5 cycles to 1 min [2]. Voltage sag is measured from reduction of rms voltage below 0.9pu of nominal voltage to when it rises above 0.9pu of nominal voltage. Hence voltage sag is short duration reduction of rms voltage. Voltage sag may be caused by
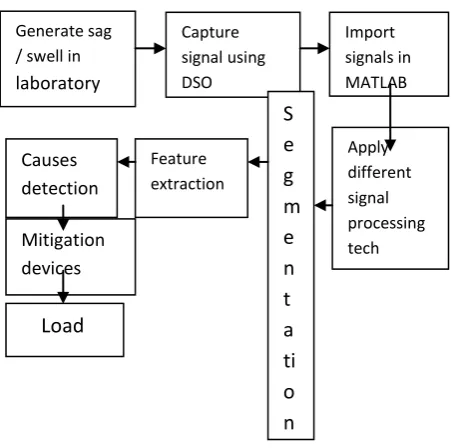
[image:1.595.315.541.510.734.2]system faults, switching on loads with heavy starting currents. A sag analysis can now be performed to determine at what sag levels equipment can and cannot operate. Voltage swell is the reverse from the sag, having an increase in rms voltage between 1.1pu and 1.8pu of nominal voltage for durations from 0.5 cycles to 1 min. voltage swells are not common as voltage sags. Swells are usually associated with system fault conditions e.g. temporary voltage rise on the unfaulted phases during an SLG fault [3]. Swells can also be caused by switching off a large load or energizing a large capacitor bank. Harmonics are sinusoidal voltages or currents having frequencies that are integer multiples of the frequency at which the supply system is designed to operate. Harmonic distortion which is periodic distortion of the sign wave originates in the nonlinear devices and loads on the power system such as, computers, variable speed drives, electronic ballast, UPS and electronic phone system [3]. Various solutions have been proposed by many papers to mitigate sag, swell and harmonics. Fig.1. shows a broad overview of the proposed mitigating process.Objective of this paper is to improve sag /swell detection time, Harmonic analysis in the disturbed signal. Detect type of fault and Improve hardware performance.
Fig 1: Overview of the proposed mitigating process.
Generate sag / swell in
laboratory
Capture signal using DSO
Import signals in MATLAB
Apply different signal processing tech
S
e
g
m
e
n
t
a
ti
o
n
Feature extraction
Causes detection
Mitigation devices
2.
METHODS OF SAG / SWELL
DETECTION:
There are many methods used to measure and detect sag and swell. e.g. Different types of filters, RMS, STFT, FFT, DFT, Peak voltage, Missing voltage technique, Kalman filtering method, wavelet analysis etc. Signal processing techniques extract features and information from measured digital signals. To extract information such as type and location of the fault that caused the sag / swell, both signal processing tools and power system knowledge are needed [4]. Some proposed DSP methods are described below.
A. High pass filter
It is simple triggering method. High pass filter followed by threshold can detect the quick changes caused by most underlying system events. If high pass filter is applied to measured signal, it finds two triggering points to show event period. This method does not work well, especially when the changes are not obvious. This method is also sensitive to noise [5].
B. RMS Method
The root mean square (RMS) method is the one which is applied most broadly in power system monitoring and measurement. A main advantage of this method is its simplicity, speed of calculation and less requirement of memory. The main drawback is the dependency on the window length and time interval for updating the values [6]. Moreover RMS method does not distinguish between fundamental frequency, harmonics or noise components. When using RMS technique phase angle information is lost. Voltage and Current measurements are often expressed in RMS values. According to definition the RMS voltage over one data window typically one cycle is done by using the discrete integral
Vrms= N1 Nn=1Vn2
Where N is the sample per cycle of the fundamental, Vn is the nth sample of the recorded voltage waveform. In practical application, the data window is sliding along the time sequence in specific sample interval [5].
C. STFT (short time Fourier transform)
Method
STFT is commonly known as sliding window version of FFT (fast Fourier transform). It gives better results in frequency selectivity. STFT is more suitable for harmonic analysis of voltage disturbances [7]. STFT is used for time frequency analysis of non stationary signals. STFT decomposes the time varying signals into time frequency domain components, low pass representation of complex band pass filter outputs
Xn (e j Wk
) = ∑m X(m) W(n-m) e -j Wk m
Where k = 1,...…N
X(n) is a given signal for frequency band k at time n
Wk = 2𝜋k/N is the frequency in radians, N is the number of frequency bands, W(m) is the selected symmetric window of size L L ≤ N if signal reconstruction is required. Output of Kth band
pass filter from STFT
(e j wk) = (e j Wk n ) x n (e j Wk ) = hk(n) * X(n)
Where hk(n) = (ej Wk n) W(n)
D. FFT (Fast Fourier Transform)
Fourier analysis is used to convert time domain waveform into their frequency component and vice versa. When the waveform is periodical, the Fourier series can be used to calculate magnitudes and phases of the fundamental and its harmonic components. More generally the Fourier transform and its inverse are used to map any function in the interval -∞ to +∞ in either the time or frequency domain into a continuous function in the inverse domain. DFT (discrete Fourier transform) is modification of Fourier transform. In practice data are always available in the form of sampled time function, represented by a time series of amplitudes, separated by fixed time intervals of limited duration. When dealing with such data a DFT is used. FFT is faster version of DFT. The FFT utilizes some clever algorithms to do the thing as the DFT, but in much less time.The finite or DFT of a complex vector y with n elements is another complex vector Y with n elements
Y
k =∑
n-1
w
jky
j,
j=0
Where w is complex nth root of unity:
w
= e
-2Πi / n.
As is well known, the results obtained using DFT are incorrect in the case of non stationary signals, as is the case of the voltage waveform in an event. A way to overcome this problem is the use of the Short Time Fourier Transform (STFT). The STFT partitions the signal into time segments where the signal is considered stationary, applying the DFT within each segment [6].
E. wavelets
Wavelets have been applied to non-stationary harmonics distortion in power system. This technique is used to decompose the signal in different frequency bands and study its characteristics separately. Much different type of wavelets has been applied to identify power system events such as Daubechies, Dyadic, Coiflets, Morlet, and Symlets wavelets. In dyadic wavelet, the center frequencies of band-pass filters are fixed once the number of scales is chosen which leads to inconvenient center frequencies for harmonic analysis [7].
3. EXPERIMENTAL SETUP
Contactor 10 A
5KVA 415 v 3ph Transfor mer with tapping's
Relay 1
Relay
2
Relay
3
DSO Tektronix
TPS2014 computer
Start/Stop
LOAD 3 ph I.M.1380 rpm 3.8 A,415 v,50 Hz
1.5 kw
R Y B
tap change switch dc supply
[image:3.595.53.270.82.244.2]12v
Fig 2: block diagram of experimental setup
The solid state mechanical relay:
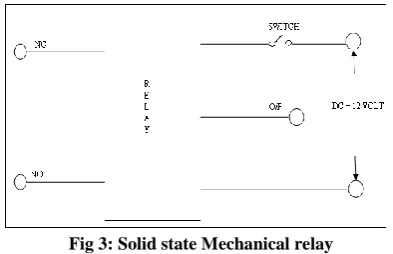
[image:3.595.336.515.338.496.2]It is used to act as a tap changer so that the voltage sag and swell conditions can be gate. The relay has rating of 230V/10A and the operating coil of the relay is provided with the +12V DC supply. Fig. 3. shows the Solid state relay terminals the relay has five terminals i.e. NO contact (normally open), NC contact (normally closed), two terminals for coil energization and last one is output.
Fig 3: Solid state Mechanical relay
The switch (Bell Push Type) is inserted in series with the supply terminal of the relay operating coil. When the switch is pressed, the NO contact closes and closed contact opens. To generate the voltage sag event, NC contact of the relay is always connected to the 100% rated voltage or to nominal voltage tapping of transformer, and the NO (normally open) contact of the relay is connected to the transformer tapping of required sag magnitude value. In case of swell the NC contact is connected to the transformer tapping less than nominal voltage, to get required amount of swell magnitude. The NO contact is connected to the 100% rated voltage tapping of transformer.
Induction Motor
Single phase induction motor of 3ph, 415V, 3.8A, 1.5 kW is used to simulate the voltage sag occurring due to the inrush currents.
DSO (data storage oscilloscope)
: Tektronix TPS2014 used to capture the sag/swell signals.
PTs
: are used to connect DSO and I.M. for capturing voltage waveform.To generate sag/swell, two tapping’s 415V & 370V of transformer are used. To generate sag, tapping of 415V connected to NC contact and tapping of 370V connected to
NO contact of solid state relay. By operating switch (bell push type) for short duration 45V sag will generate. To generate swell tapping of 370V connected to NC contact, and taping of 415Vconnected to NO contact of solid state relay. By operating switch (bell push type) for short duration 45V swell will generate. These generated sag/or swell signals are captured on DSO (digital storage oscilloscope) to get data. This data used for further analysis. Different signal processing techniques are used to analysis this sag/or swell manually generated disturbances.
4. GENERATION OF 3 PH VOLTAGE
SAG/SWELL
Sampling time: 0.0001 sec, sampling frequency: 10 kHz, Transformer is connected in star/star, supplied by the line rms voltage=415V, hence phase rms voltage will be=239.6V, the calculated peak value of voltage and generated peak value of voltage by running the MATLAB program are found to be similar that is peak voltage=338.8, as in fig. 4., it is clearly observed that the voltage reduces to a value=300V, for an interval of nearly 160ms (8 cycles). Hence it is concluded that voltage nearly reduces 0.88 pu from its nominal voltage, this clearly indicates that it is voltage sag.
Fig 4: Captured 3 ph voltage sag waveform.
Fig 5: Captured 3ph voltage swell waveform.
In fig. 5. observe that nominal voltage is nearly 300V and voltage increases up to 338.8V for an interval of 190ms (9.5 cycles). Hence it can conclude that voltage nearly increase 1.12 pu from its nominal voltage that is voltage swell.
5. RESULTS AND DISCUSSION
From above generated sag/swell waveforms information is extracted by using different signal processing techniques.
5.1 comparative study for sag
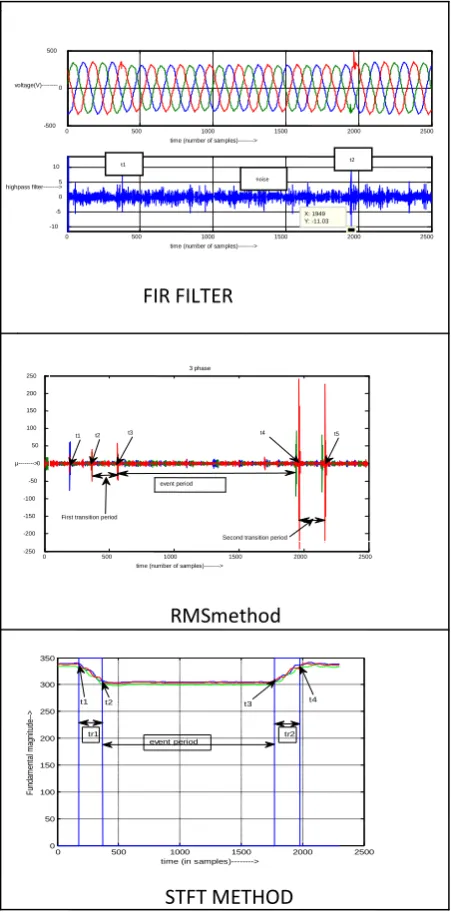
Triggering points using high pass filter, RMS, STFT are as given below in table1. Extracted information is useful to find type and location of the faults that caused the sag/swell. Comparative study for sag using high pass filter, RMS method and STFT method are as shown in fig. 6.
0 500 1000 1500 2000 2500
-400 -300 -200 -100 0 100 200 300 400 500
number of samples--->
v
o
lt
a
g
e
(V
)-
--->
0 500 1000 1500 2000 2500
-400 -300 -200 -100 0 100 200 300 400
number of samples--->
vo
lta
ge
(V
)--
[image:3.595.66.263.357.484.2]
Table1:Triggering points using high pass filter, RMS, STFT
High pass filter marks only two triggering points [5]. t1=376 and t2=1948 these points are nearly in between transition periods of STFT (tr1=164-372, tr2=1752-2008) and RMS method (tr1=365-564, tr2=1944-2165). Hence total period divided only in three periods.
FIR FILTER
RMSmethod
[image:4.595.48.286.107.171.2]STFT METHOD
Fig 6: Comparison for sag using high pass filter, RMS method and STFT method.
First is before event, second event period and third after event period. Hence in this method transition periods are not detected. As per result shown, further method is sensitive to noise. In case of RMS method we detect five triggering points. First triggering point t1 always shown after the completion of first cycle and it is not considered for dividing total period. This method divides total period in five periods as prevent period (period before second triggering point), first transition period, event period, second transition period, and post event period (period after fifth triggering point). In 3 ph measurement there is always a small difference in fault clearing time between the three phases, so in most cases that cannot be detected clearly on each phase from the RMS sequence which observed from RMS result. STFT method also divide total period in to five periods as in case of RMS method [5]. In STFT method there is no problem in fault clearing time between three phases and most advantage of this method is it detects transition characteristics from which we got the type of fault in the system. From the above comparison we also note that, STFT can achieve higher time resolution than that of the RMS sequences.
First transition period (tr1) using STFT is between samples 164-372, when in case of RMS sequence tr1 lies in between 365-564, means RMS method has lower time resolution. Similar results are for second transition period (tr2).
5.2 Comparative study for swell
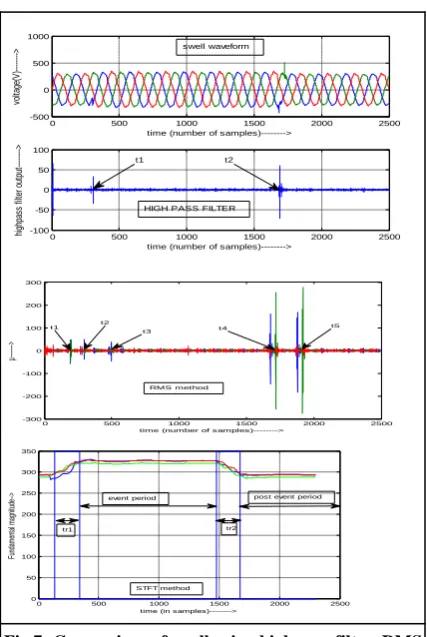
Similar results as sag are obtained for swell disturbance as shown in fig.7. High pass filter marks only two triggering points. t1=308 and t2=1689. Hence total period divided only in three periods. Prevent event, event period and third post event period. This method is sensitive to noise again for swell [5]. Detection time of event period by STFT (340-1480) is less than RMS method (498-1877). In transition periods (tr1-tr2) of STFT we observed characteristics of voltage magnitude from which we can find the type of fault, for example rectangular characteristics due protection operation, non rectangular due to transformer and motor dips, transformer saturation events are asymmetrical dips (different degree of saturation for each phase), motor events are symmetrical dips (balanced load), Transformer events present temporary high harmonic distortion due to saturation [9].Triggering points using high pass filter, RMS, STFT are as given below in table2
Table 2: Triggering points using high pass filter, RMS, STFT
High pass
filter
t1
308
t2
1689
RMS t1
196
t2
297
t3
498
t4
1877
t5
1974
STFT t1
136
t2
340
t3
1480
t4
1672
0 500 1000 1500 2000 2500 0
50 100 150 200 250 300 350
time (in samples)--->
F
un
da
m
en
ta
l m
ag
ni
tu
de
-->
t2
t1 t3 t4
event period
tr1 tr2
High pass filter
t1 376
t2 1948
RMS t1
196 t2 365
t3 564
t4 1944
t5 2165
STFT t1
164
t2 372
t3 1752
t4 2008
0 500 1000 1500 2000 2500
-250 -200 -150 -100 -50 0 50 100 150 200 250
time (number of samples)---> µ--->
3 phase
t1 t2 t3 t4 t5
event period
First transition period
Second transition period
0 500 1000 1500 2000 2500
-500 0 500
time (number of samples)--->
voltage(V)--->
0 500 1000 1500 2000 2500
-10 -5 0 5 10
X: 1949 Y: -11.03
time (number of samples)---> highpass filter--->
t1 t2
[image:4.595.51.277.239.696.2]Fig 7: Comparison of swell using high pass filter, RMS method and STFT method.
5.3 Harmonic analysis of sag/swell using stft
STFT used for analyzing a voltage sag/swell signal. From top to bottom measurement containing a voltage sag/swell, output magnitudes from complex band pass filters centered at 1,2,3,4,5,6,7. Fs=10 kHz or 200 samples per 50 Hz cycle. The center frequencies of band pass filters are set at the power system harmonics by choosing the total number of band N=200. Fig. 8. shows the output from 7 band pass filters of sag signal. This provides alternative way of analysis. The figure plots the magnitude of harmonic signals as a function of samples. Filter output are useful to detect sag initiation and voltage recovery [5], [9]. Large peaks in band 3 are higher due to the high frequencies presented in the voltage step at the sag initiation and voltage recovery. The harmonics distortion is somewhat higher before the event period (first transition period) than after the event period (second transition period). Fig. 9. shows the output from 7 band pass filters of swell signal. Results are similar as in case of sag.
[image:5.595.317.542.80.599.2].
no of samples---Fig 8: Harmonic components of sag
Fig. 9. harmonic component of swell
6.
CONCLUSION
Many of the mysteries of equipment failure, downtime, software and data corruption, are the result of problematic supply of power. There is also a common problem with describing power problems in a standard way. This paper discusses and analyses most common type of disturbances such as sag, swell, harmonics. The widespread use of electronics has raised the awareness of power quality and its affect on the critical electrical equipment that business use. However in order to understand and detect power disturbances use perfect method for particular type of disturbance, because each type has its own specifications (advantage and disadvantage). Sole objective of this paper was to detect and analyses most common power quality disturbances, sag swell and harmonic using efficient technique. In this paper
0 500 1000 1500 2000 2500
-500 0 500 1000
time (number of samples)--->
vo
lta
ge
(V
)--
--->
0 500 1000 1500 2000 2500
-100 -50 0 50 100
time (number of samples)--->
hi
gh
pa
ss
fi
lte
r o
ut
pu
t--
--->
t2 t1
HIGH PASS FILTER swell waveform
0 500 1000 1500 2000 2500 -300
-200 -100 0 100 200 300
time (number of samples)--->
µ-
---->
t2
t3 t4 t5
t1
RMS method
0 500 1000 1500 2000 2500
0 50 100 150 200 250 300 350
time (in samples)--->
Fu
nd
am
en
ta
l m
ag
ni
tu
de
--> event period
tr1 tr2
post event period
STFT method
0 500 1000 1500 2000 2500
-5000 500
s
ig
n
a
l
0 500 1000 1500 2000 2500
0 10 20
DC
0 500 1000 1500 2000 2500
300 350
2nd
0 500 1000 1500 2000 2500
0 10 20
3
rd
0 500 1000 1500 2000 2500
0 5 10
4
th
0 500 1000 1500 2000 2500
0 5
5
th
0 500 1000 1500 2000 2500
0 5 10
6
th
0 500 1000 1500 2000 2500
0 2 4
7
th
0 500 1000 1500 2000 2500 -5000
500
s
ig
n
a
l
0 500 1000 1500 2000 2500 0
20 40
DC
0 500 1000 1500 2000 2500 250
300 350
2nd
0 500 1000 1500 2000 2500 0
20 40
3
rd
0 500 1000 1500 2000 2500 0
10 20
4
th
0 500 1000 1500 2000 2500 0
10 20
5
th
0 500 1000 1500 2000 2500 0
10 20
6
th
0 500 1000 1500 2000 2500 0
10 20
7
th
presented methods are simple high pass filter, RMS triggering method, STFT segmentation method to detect and segment sag, swell event. We had found that the accuracy in case of STFT is better as compared to high pass filter and RMS method. If harmonic are “components of interest” for the analysis, STFT is more suitable. The waveform distortion during a voltage sag or swell may provide some additional information on the cause of the event as well as some diagnostic on the system. STFT is used for the inspection of the changing characteristic of harmonic component. After the sag the harmonics distortion is somewhat lower than before the sag.
7.
FUTURE SCOPE
Event type
[image:6.595.58.266.217.418.2]
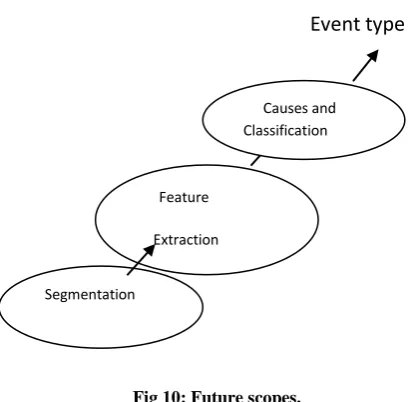
Fig 10: Future scopes.
Fig. 10. shows future scopes to presented work. Different steps of future are described as follows.
Segmentation:
For each recording, voltage waveform samples are partitioned in to event segments and transition segments which was objective of this project.
Feature extraction:
For each segment, features (e.g., rectangular, non rectangular, symmetrical, unsymmetrical, sag/swell depth and duration, slope of transition etc.) are extracted.
Causes classification:
From feature find causes according to their shape and classify it.
Event type:
from causes classify the events (sag, swell etc).
9.
REFERENCES
[1] IEEE std.1159, IEEE. Recommended Practice for Monitoring Electrical Power Quality 1995.
[2] Math H.J.Boolen, “Understanding Power Quality Problems: Voltage Sag And Interruptions”, IEEE Press 2000.
[3] Roger C.Dugan/Mark F.Mc Granaghan, Surya Santoso/H.Wayne Beaty, “Electrical Power Systems Quality” Second Edition.
[4] M. S. Azam, Fang Tu, Krishna R. Pattipani, “A Dependency Model Based Approach For Identifying And Evaluating Power Quality Problems”, IEEE Transactions On Power Dilivery, Vol.19,No.3, pp. 1154-1166 July 2004.
[5] Math H.J. Bollen, Irene Yu-Hua Gu, “Signal Processing Of Power Quality Disturbances.” Book in IEEE press serieson power engineering, A John Wiley And Sons, Inc., Publication.
[6] Enrique Perez, Judio Barros, “Voltage Event Detection And Characterization Methods: A Comparative Study” IEEE PSE Transmission and Distribution Conference and Exposition Latin America, Venezuela, 2006 [7] Yu Hua Gu, Math H.J.Bollen, “Time Frequency And
Time Scale Domain Analysis Of Voltage Disturbances” IEEE Transactions On Power Dilivery, Vol.15,No.4,pp. 1279-1284, October 2000
[8] Raj Naidoo, Pragasen Pillay “A New Method of Voltage Sag and Swell Detection” IEEE transactions on power delivery, vol. 22, no. 2, pp.1056-1063, April 2007 [9] Irene Yu-Hua Gu, Emmanouil Styvaktakis, “Bridge The
Gap: Signal Processing For Power Quality Applications”, Electrical Power system research 66(2003) pp 83-96, 2003 Eleveries Science B.V.
Rajesh Ingale is currently an Assistant professor in the
Department of Electrical Engineering at VDF School of Engineering & Technology, Latur, India. He received M.E. in Electrical. His teaching experience is 16 years. His research interests include power quality. He has 2 papers in national conference.
Laxman Tawade has pursued BE degree in Electronic &
Telecommunication from Pune University, India in 2011. Currently he is working as lecturer in VDF School of Engineering and Technology, Latur, India. He has done project internship at Reliance Innovation Communication Lab, Mumbai, India. He is member of International Association of Computer Science and Information Technology (IACSIT), Machine Intelligent Research Lab (MIR Lab), Universal Association of Computer and Electronics Engineers (UACEE), Academy & industry research collaboration center (AIRCC) & Affiliate member of signal processing for communication and networking technical committee. He has 1 paper in international conference and 9 papers in International Journal to his credit. He has worked as Reviewer for international journals and international conference sponsored by IEEE & also worked as program committee member of few international conferences. He is working as technical program committee member of few international conferences. He is also invited as the Chair/Speaker of Network Security at the upcoming 2nd Annual World Congress of Emerging InfoTech 2013 (InfoTech-2013) at China. He is nominated for “Who’s who
in the world” a America’s Biographer. His research interest
includes Power Quality, Security & Communication Network, Optical Fiber Communication and optical access networks based on WDM-PON, Biomedical signal processing.
Segmentation
Feature
Extraction