An Efficient Incremental Clustering based
Summarization Technique for Web Page Classification
Setu Kumar Chaturvedi
Professor & Head Department of Comp. Sci. and Engineering, Technocrats Institute of Technology, Bhopal, MP, India
ABSTRACT
Currently the World Wide Web is the largest source of information. There are numerous self-acting classification advances that have been suggested. In this suggested work an effective incremental clustering approach to evolve a better incremental clustering based summarization method for world wide World Wide Web classification which can facilitate to better coordinate the accessible data on WWW. The incremental clustering founded summarization technique permits dynamic tracking of the ever expanding allotment of information, put on the World Wide Web every day. This is the useful procedure for dynamic contents. In this the clustering of web document is a key method for finding out a more contextual and noiseless knowledge for world wide world wide web utilizes. C4.5 is one of the most classic classification algorithms on data excavation, when it is utilized in mass computed results, the effectiveness is very low. In this paper, the direct of C4.5 is advanced by the use of L’Hospital direct, which simplifies the assessment process and advances the effectiveness of decision making algorithm. The aim of this work to apply the algorithms in a very time and space effective kind and throughput and answer time for the application will be encouraged as the presentation measures. The aspires is to implement these algorithms and graphically compared the complexities and efficiencies of the classification algorithms.
Keywords
Clustering, summarization, Classification, Decision Tree, C4.5,L’Hospital Rule ,the rate of information gain.
1.
INTRODUCTION
The WWW supply more and more dynamic data natural environment for internet users. Due to gigantic size of world wide web facts and figures, it becomes more difficult to find document applicable to the user’s desires. The clustering founded summarization procedures are needed to manage the dynamically altering contents of the web crawlers. The proposed approach can make it simpler to find relevant articles as clustering brings alike articles simultaneously and can make finding information simpler and quicker [1]. The effective incremental clustering founded summarization technique for web sheet classification is suggested which can determination mainly two troubles:
• Effectiveness problem
• Disturbance decrease and insertion alignment difficulty.
The Effectiveness works out how correct and unquestionable the outcomes will be. This is significant as it sways the result over time for incremental methods. An incremental algorithm will be performed in numerous times and not just for high primary effectiveness. But, It can be sustained all through each iteration holding the results unquestionable and significant [2].
The second difficulty is the insertion order topic. To some span, incremental algorithms are affected by the order that new articles arrive in it to be added to the clustered outcomes [3]. perfectly, incremental algorithms should give the same outcomes for a dataset/collection despite of the order that articles arrive in (order independent) [4]. The distinction between traditional clustering procedures and incremental clustering in specific is the proficiency to method new facts and figures as they are supplemented to the facts and figures assemblage [5].
This paper present an incremental clustering founded summarization technique for sustaining high cluster cohesiveness, which represent a Cluster likeness histogram utilising statistical representation of the pair-wise article likenesses inside each cluster. The method allows for article reassignment to clusters which were created after the article was introduced [5].
Other categories of clustering methods that rely on having data about the initial article vectors (such as k-means) were not advised for evaluation since such evaluation would not be unquestionable due to differences in the input to each technique. Each clustering algorithm acknowledges its input as a article similarity matrix without having to rely on the original characteristic vectors [6].
The aim of this work is to improve the incremental clustering based summarization technique for web document classification. The paper is organized as follows. Section 2 discusses related work. The proposed technique is presented in Section 3. Dataset and evaluation setup are presented in Section 4 and Section 5 respectively Section 6 and Section 7 presented the result analysis and performance analysis respectively. Lastly, Section 8 concludes the paper.
2. RELATED WORKS
In this part we present a short overview of incremental clustering founded summarization method. We furthermore succinctly talk about one non-incremental clustering algorithm to provide an impartial outlook. Various Clustering advances have been proposed, including DC-tree clustering [7], Suffix Tree Clustering (STC) [8], incremental hierarchical clustering [9], and other ones.
Non-incremental clustering procedures mainly rely on having the entire article set ready before applying the algorithm [10].
Fundamentally Incremental clustering algorithms works by assigning things to their respective clusters as they reach [12]. Problems faced by such algorithms include how to find the appropriate cluster to be allotted for the next object, how to deal with insertion alignment problems, and how to reassign things to other clusters (that were not present when the object was first introduced.). We will very succinctly reconsider four incremental clustering algorithms.
Single-Pass clustering algorithm basically methods articles sequentially and compares each article to all existing clusters [13]. If the likeness between the article and any cluster is overhead a certain threshold, then the article is added to the nearest cluster; else it forms its own cluster. Generally the procedure for working out the likeness between a article and a cluster is finished by computing the average likeness of the article to all articles in that cluster.
K-nearest neighbour clustering algorithm computes the likeness to every other document, and selects the peak k articles. The new article is assigned to the cluster where the most of the top k documents are used [14].
conventionally, clustering takes a dataset processed it and make the outcome set. If the dataset is altered, the whole dataset had to be re-clustered from scratch. This re-clustering could be exorbitant in terms of processing time.
Incremental clustering is one technique evolved to bypass this. It is founded on the concept that it is likely to process articles one at a time and accredit them to a cluster, without significantly affecting the state of the living clusters. In short, this means articles that are currently clustered do not have to be re-clustered when a new document is added to the dataset. This is the prime distinction between customary clustering and incremental clustering [3].
Going through the method of feature extraction etc for each article and then reapplying the clustering algorithm over the entire set can be prohibitively expensive, while incremental clustering founded summarization algorithms may only be needed on a small percentage of the entire dataset dimensions [1, 2].
It has been reported in publications that web page clustering for summarization faces four main matters which are granted below [5]:
• Efficiency • Effectiveness
• Instrumentality
•Noise-reduction based insertion order difficulty.
The first topic effectiveness is a house of precision evaluation. The second topic is effectiveness. This is fundamentally the proficiency for a clustering method to assembly alike World Wide Web pages simultaneously, while also double-checking that dissimilar web sheets are kept distinct and therefore are not put simultaneously in the same cluster. It is significant that an incremental method is just as productive and effective as contrasted with non-incremental advances. If it is not, then there will be no issue in using it. It may take less time, but the outcomes are of a poorer quality. Because an incremental algorithm will furthermore be utilised many times, as the web page assemblage changes, the algorithm must be adept to sustain a compare dept grade to
non-incremental techniques or the value of the outcomes may decline over time.
The last topic is disturbance tolerance. World Wide Web sheets are possibly the only form of facts and figures that comprise huge allowances of noise or insignificant contents such as banners, advertisements etc. All of these often have very little to do with the actual content of the page. Noise-tolerance is the proficiency for an incremental algorithm to deal with World Wide Web pages, which are not alike to any other page currently in the cluster set.
To maintain the value of the clusters, the algorithm should not have to assembly this disturbance sheet in an existing cluster (as this would decline the quality). rather than it should be adept to place this sheet in a new cluster that is then supplemented to the living cluster structure as appropriate [1, 6]. This then preserves the quality of the existing clusters. The suggested work mainly focuses on the second and fourth matters; effectiveness & Noise-reduction based insertion order problem to produce a better incremental clustering founded summarization method.
With the development of computer expertise and computer mesh expertise, the degree of informationization is getting higher and higher, people’s proficiency of using data expertise to collect and make data is considerably enhanced. How can we not be drowned by the ocean of data, and from which finding out useful information and advancing the effectiveness of data utilization are troubles need to be addressed urgently. facts and figures mining is a method to extract data and information from a large number of incomplete, noisy, fuzzy and random facts and figures. In these facts and figures, the data and information are implicit, which persons do not know in accelerate, but potentially helpful. At present, the decision tree has become an important data excavation procedure. The basic discovering approach of conclusion tree is greedy algorithm, which use the recursive top-down approach of conclusion tree structure. Quin lan in 1979 put ahead a well-known ID3 [1,2,3] algorithm, which is the most broadly utilised algorithm in conclusion tree. But that algorithm has a defect of tending to use attributes with numerous standards. aspiring at the shortcomings of the ID3 algorithm, in the paper, we analyzed some decision tree classification algorithms currently in use, including the ID3 [4] and C4.5 [2] algorithm as well as some of the advanced algorithms [3,5,6] thereafter them. When these classification algorithms are used in the data processing, we can find that its effectiveness is very low and it can cause unwarranted utilisation of memory. On this cornerstone, blending with large quantity of facts and figures, we put forward the enhancement of C4.5 algorithm effectiveness, and uses L’Hospital direct to simplify the calculation process by utilising approximate procedure. This advanced algorithm not only has no absolutely vital influence on the conclusion of decision-making, but can substantially advance the effectiveness and decrease the use of memory. So it is more effortlessly utilised to method large allowance of data collection.
be extracted and represented in the pattern of classification (if-then) directs. Each direct represents a exclusive route from the origin to each leaf. In operations study, expressly in conclusion investigation, a conclusion tree (or tree design drawing) is a conclusion support device that benefits a graph or form of conclusions and their possible consequences.
3.
PROPOSED EFFICIENT INCREMENTAL
CLUSTERING BASED SUMMARIZATION
TECHNIQUE
FOR
WEB
DOCUMENT
CLASSIFICATION
The proposed technique comprises the following phases:
Centroid Computation
Incremental Clustering
Summarization
Classification.
3.1 Centroid Computation
The center of mass vector is that the most the same as the document’s vector illustration that is that the one that the majority seemingly contains the best variety of documents that ar most the same as this document. Adding the new document to the present cluster (when possible) can in all probability provide the best profit to it cluster and also the entire dataset. the main modification is that rather than putting the document within the cluster which might receive the most effective bar chart quantitative relation modification (like the initial algorithm), this increased version adds it wherever doable to the cluster that has the foremost similar center of mass vector to the document. the concept with this approach is that the cluster with the best similarity to the document can have the best variety of comparable documents in it and would be the most effective cluster to put the document. By victimisation the similarity to the cluster center of mass vector the cohesiveness of the clusters is maintained and any tendency for a cluster to opened up over vector house is restricted. this could produce to additional tightly packed cluster that ar additional distinct from one another, with token or ideally no overlap between them.
Centroid is used to extract relevant sentences in the web documents and also to identify salient sentences in a Centroid cluster. Each web document is represented as a weighted vector of (term frequency (TF) and inverse document frequency (IDF) (TF*IDF). First the centroid is generated by using only the first web document in the cluster. As new documents are processed, their TF*IDF values are compared with the centroid using the formula described below:
Where D is the set of document and dk defines kth document in D. similarly C is the set of centroid vectors and ck is kth centroid vector. In case the similarity measure sim (D, C) is within a threshold, the new web document is included in the cluster [8]. Thus the algorithm for the implementation of this enhanced algorithm is as follows: The key concept for the similarity clustering method is to keep each cluster at a high degree of coherency at any time. We represent the coherency of a cluster with a new concept called Cluster Similarity Histogram.
Cluster Similarity Histogram: could be a apothegmatic applied math illustration of the set of pair-wise document similarities distribution within the cluster. variety of bins
within the bar graph correspond to mounted similarity price intervals. every bin contains the count of pair-wise document similarities within the corresponding interval.
3.2 Incremental Clustering
We evaluate the parameters for calculating the coherent clusters Let N be the number of documents in a cluster. The number of pair wise similarity Cm in the cluster is
Cm = N*(N+1)/2 ……… (3.2)
Then Let S= (Si : i=1………. Cm) be the set of similarity of the clusters. The histogram of the similarity (HS) in the cluster is calculated as:
HS = Count (Sk) ……… (3.3) Where i=1 to B and LSi ≤Sk≤ USi .
B : The total number of histogram bins. Sk: The Threshold of similarity.
HS: The count of similarity in bini. LSi: Lower similarity bound of bini. USi : The Upper similarity bound of bini.
The probability of similarity histogram (PSH) of a cluster is the measurement of cohesiveness of the cluster is given below:
Where PSH: probability of the histogram of a cluster. T: bin number corresponding of the similarity
threshold.
We also set a minimum histogram probability PSH of the cluster, to present the effect of degrading the ratio to zero to eventually.
3.3 Steps of Incremental Clustering Technique
Step1: Receive a new web document Dj and calculate the clusters in cluster list CL(i) .It determine both the new and old PSH .
Step 2: Merge D to in CL(i) through PSH(new), Where (i=1 to n).
Step 3: Compare between the PSH(new) and PSH(old)cluster. If the PSH(new) is greater than or equal to the PSH(old) , the document is added in the cluster. Step 4: If the PSH(new) is less than the old one but not less
than threshold that it is added to the cluster. Step 5: Otherwise PSH(new) is not assigned to any cluster. A
new cluster is created and the document is added in it.
3.4 Reassessment of Cluster for New Document
In this phase we are trying to resolve insertion order problem. We perform some extension in incremental Clustering through the following Steps:
Step1: Each cluster in Cluster list determines the new document is a candidate for reassessment. The New web document Dj measure the similarity in the cluster list CL(i) .It determine both the new and old PSH .
Step2: The cluster is assessed to see, if it is allowed to potentially take the document by checking that the new histogram is okay:
PSH(old) = PSH(C) and then add Dj to CL(i) otherwise PSH(new) = PSH(C) and PSH(Difference) = PSH(new) - PSH(old)
.
it will create a new centroid vector through decreasing order in the new cluster lists Ls. After going through all the cluster is that currently exists in the cluster list CL(i).
Step 4: It ensure that the new web document Dj is most similar which will include the cluster and receive the new document.
Step 5: Otherwise there were no suitable clusters to take the new document, than a new cluster is generated and the document is added to it.
These steps enhance the incremental clustering algorithm and implement the reassessment of cluster for the new document. The cluster centroid vector determines the best cluster, to move the document.
3.5 Summarization
This section illustrates procedure for sentence extraction for summarization using the basic question: which term or word are useful for exploiting different types of information in the web document set [7]. We need to figure out what are the characteristics of sentence extraction terms that are significant for representing a document in a Centroid class.
Summarization is seen as a sentence ranking or scoring process based on the probability of a sentence, they would be included in a summary. Thus a probabilistic Naïve Bayes scoring based sentence extraction approaches:
) ,... , ( ) ( ) | ,... , ( ) ,... , | ( 2 1 2 1 2 1 k k k C C C P S s P S s C C C P C C C S s
P
) ( ) | ( ) ( 1 1 j k j j k j C P S s C P S s P
….. (4.2) Where S is the set of sentences in document and s is a sentence in S. Similarly C is the set of centroid vectors and Ck is kth centroid vector.Assuming statistical independence of the features, and
)
(
s
S
P
is a constant (assuming uniform distribution forall s), where
P
(
C
j|
s
S
)
andP
(
C
j)
can be estimated from the training set. In [102] they have used term distribution concept. Here we are extending the concept for sentence extraction through improved C4.5 by the use of L’Hospital Rule.3.6 Modules for Classification
These are basic steps for classification system:
Step1: Select Dataset: Selecting a summarized dataset
actually includes giving the dataset as an input to the algorithm for processing.
Step2: C4.5 Processing: C4.5 processing includes the
processing the given input dataset according to the defined algorithm of C4.5 data mining.
Step3: Improved C4.5 Processing: Improved C4.5 processing
includes the processing the given input dataset according to the defined algorithm of improved C4.5 data mining.
step4: Generate Trees: The data which should be inputted to
the tree generation mechanism is given by the ID3, C4.5 and improved C4.5 processors. Tree generator generates the tree for C4.5 and improved C4.5 decision tree algorithm.
Step5: Attribute Selection Measure: The information gain
measure is used to select the test attribute at each node in the tree. The attribute with highest information gain is chosen as test attribute for the current Node. This attribute minimizes
the information needed to classify the samples in resulting partition and reflect the least “impurity” in these partitions.
Let S be set consisting of data sample. Suppose the class label attribute has m Distinct values defining m distinct class Ci (for i =1... m). Let Si be the number of Sample of S in class Ci. The expected information needed to classify a given sample is given by equation
I (S1, S2, · · · , Sm) = −
Where Pi is probability that an arbitrary sample belongs to classify Ci and estimated by Si/S. Note that a log function to base 2 is used since the information in encoded in bits
Entropy:It is minimum number of bits of information needed
to encode the classification of arbitrary members of S.
Lets attribute A have v distinct value a1,..., av. Attribute A can be used to Partition S into v subsets, S1, S2,..., Sv , where Sj contains those samples in S that have value aj of A. If A were selected as the test attribute, then these subset would corresponds to the branches grown from the node contains the set S. Let Sij be the number of class Ci, in a subset by Sj , The entropy or expected information based on partitioning into subset by A, is given by equation
E(A) = ∑jv=1 (S1j +S2j+ · · · + Smj / S )*I(Sij + · · · + Smj) The first term acts as the weight of the jth subset and is the number of samples in the subset divided by the total number of sample in S. The smaller the entropy value, the greater purity of subset partitions as shown in
I(S1, S2, · · · , Sm) = −
Where Pi is the probability that a sample in Sj belongs to class Ci.
Information Gain: It is simply the expected reduction in
entropy caused by partitioning the examples according to the attribute .More precisely the information gain, Gain(S, A) of an attribute A, relative collection of examples S, is given by equation.
Gain (A) = I (S1,S2, · · ·, Sm) − E (A)
In other words gain (A) is the expected reduction in entropy caused by knowing the Value of attribute A. The algorithm computes the information gain of each attribute. With highest information gain is chosen as the test attribute for a given set.
3.6.1 The strengths of Decision Tree Classification algorithm:
1. Decision trees are able to generate understandable rules. 2. Decision trees perform classification without requiring much computation.
3. Decision trees are able to handle both continuous and categorical variables.
4. Decision trees provide a clear indication of which fields are most important for prediction or classification.
3.6.2 The shortcoming of Decision Tree
Classification algorithm
3.7
C4.5 ALGORITHM
The standard decision tree algorithm is a base on the information gain, and later, an improved C4.5 algorithm. Many scholars made kinds of improvements on the decision tree algorithm. But the problem is that these decision tree algorithms need multiple scanning and sorting of data collection several times in the construction process of the decision tree. The processing speed reduced greatly in the case that the data set is so large that can not fit in the memory .At present, the literature about the improvement on the efficiency of decision tree classification algorithm For example, Wei Zhao, Jamming Su in the literature [7] proposed improvements to the ID3 algorithm, which is simplify the information gain in the use of Taylor's formula. But this improvement is more suitable for a small amount of data, so it's not particularly effective in large data sets.
Due to dealing with large amount of datasets, a variety of decision tree classification algorithm has been considered. The advantages of C4.5 algorithm is significantly, so it can be choose. But its efficiency must be improved to meet the dramatic increase in the demand for large amount of data.
3.8
THE IMPROVEMENT OF C4.5
ALGORITHM
The C4.5 algorithm [8,9] generates a decision tree through learning from a training set, in which each example is structured in terms of attribute-value pair. The current attribute node is one which has the maximum rate of information gain which has been calculated, and the root node of the decision tree is obtained in this way. Having studied carefully, we find that for each node in the selection of test attributes there are logarithmic calculations, and in each time these calculations have been performed previously too. The efficiency of decision tree generation can be impacted when the dataset is large. We find that the all antilogarithm in logarithmic calculation is usually small after studying the calculation process carefully, so the process can be simplified by using L’Hospital Rule. As follows:
If f(x) and g(x) satisfy:
(1)
) And
are both zero or are both ∞
(2) In the deleted neighborhood of the point x0, both f'(x) and g'(x) exist and g'(x)! = 0;
Suppose c = 2, that is there are only two categories in the basic definition of C4.5 algorithm. Each candidate attribute’s information gain is calculated and the one has the largest information gain is selected as the root. Suppose that in the sample set S the number of positive is p and the negative is n. So we can get the equation :
E(S,A)=
In which pj and nj are respective the number of positive examples and the negative examples in the sample set .
So gain Ratio(A) can be simplified as :
S1: the number of positive examples in A S2: the number of negative examples in A S11: the number of examples that A is positive and attributes value is positive,
S12: the number of examples that A is positive and attributes value is negative,
S21: the number of examples that A is negative and attributes value is positive,
S22: the number of examples that A is negative and attributes value is negative.
Go on the simplification we can get:
In the expression above, Gain-Ratio (A) only has addition, subtraction, multiplication and division but no logarithmic calculation, so computing time is much shorter than the original expression. What’s more, the simplification can be extended for multi-class.
3.9
Reasonable
Arguments
For
The
Improvement
In the improvement of C4.5 above, there is no item increased or decreased only approximate calculation is used when we calculate the information gain rate. And the antilogarithm in logarithmic calculation is a probability which is less than 1. In order to facilitate the improvement of the calculation, there are only two categories in this article and the probability is a little bigger than in multi-class. And the probability will become smaller when the number of categories becomes larger; it is more helpful to justify the rationality. Furthermore, there is also the guarantee of L’Hospital Rule in the approximate calculation, so the improvement is reasonable.
3.10 Comparison of the Complexity:
To calculate Gain – Ratio(S, A), the C4.5 algorithm’s complexity is mainly concentrated in E(S) and E(S, A).When we compute E(s), each probability value is needed to calculated first and this need o (n) time. Then each one is multiplied and accumulated which need O(log2n) time. So the complexity is O(log2n).Again, in the calculation of E(S,A),the complexity is O(n(log2n)2),so the total complexity of Gain-Ration(S,A) is O(n(log2n)2).
4.
DATASET
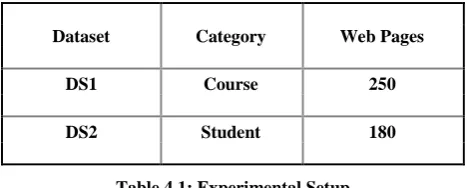
[image:6.595.53.287.486.580.2]The benchmarking dataset for machine learning problems is the university database having seven categories of web pages: Course, Project, Student, Faculty, Department, Staff and others. We have selected only two categories i.e. course and the student for our experimental setup. They contain 250 and 180 respectively. The experimental set up is shown in Table 4.1.
Dataset Category Web Pages
DS1 Course 250
DS2 Student 180
Table 4.1: Experimental Setup
5. Evaluation Setup
We employ the first measures to evaluate the performance of web classification, i.e. precision, recall and F1-measure [13]. Precision (P) is the proportion of actual positive class members returned by the system among all predicted positive class members returned by the system. Recall (R) is the proportion of predicted positive members among all actual positive class members in the data. F1 is the harmonic average of precision and recall as shown below [14]:
F1 = 2 × (P × R)/ (P + R)
To evaluate the average performance across multiple categories, there are two conventional methods: micro-average and macro micro-average. Micro-micro-average gives equal weight to every document; while macro-average gives equal weight to every category, regardless of its frequency.
The second measure is the Entropy, which provides a measure of homogeneity of un-nested clusters, or for the clusters at one level of a hierarchical clustering. The higher the homogeneity of a cluster, the lower the entropy is, and vice versa. For every cluster j in the clustering result C we compute pij , the probability that a member of cluster j belongs to class i. The entropy of each cluster j is calculated using the standard formula [15]
Ej = - ∑IPi pij log(pij)
For our experiment the database used is WebKB data set by downloading it from the UCI repository [15]. It is a
where the sum is taken over all classes. The total entropy for a set of clusters is calculated as the sum of entropies for each cluster weighted by the size of each cluster:
Where Nj is the size of cluster j, and N is the total number of data objects. Basically we would like to maximize the F-measure and minimize the Entropy of clusters to achieve high quality clustering.
6. Result Analysis
The results are tabulated for the course category in Table 6.1 and 6.2 and for the student category in table 6.3 and 6.4 for both classifications respectively. We also evaluate the Entropy for measuring the homogeneity of un-nested clusters.
Table 6.1: Experimental Results on C4.5 Classification for DS1 (Course Category)
C4.5 Classification Method Name
Micro P Micro R Micro P
Full-texts 70.7±0.3 57.7±0.3 62.6±0.3
HAC 68.3±0.4 55.4±0.4 61.2±0.4
ICBST 75.9±0.4 61.7±0.4 66.1±0.5
Table 6.2: Experimental Results on Efficient C4.5 Classification for DS1 (Course Category)
Efficient C4.5 Classification Method Name
Micro P Micro R Micro P
Full-texts 72.4±0.3 59.3±0.3 64.9±0.3
HAC 68.8±0.3 55.9±0.3 61.7±0.3
Table 6.3: Experimental Results on C4.5 Classification for DS2 (Student Category)
Method
C4.5 Classification
Name Micro P Micro R Micro P
Full-texts 69.7±0.3 55.7±0.3 61.6±0.3
HAC 66.3±0.4 54.4±0.4 60.2±0.4
ICBST 72.9±0.4 60.7±0.4 68.1±0.5
d
Table 6.4: Experimental results on Efficient C4.5 Classification for DS2 (Student Category)
Method Efficient C4.5 Classification
Name Micro P Micro R Micro P
Full-texts 71.4±0.3 57.9±0.3 65.1±0.3
HAC 66.8±0.3 57.9±0.3 61.7±0.3
ICBST 75.2±0.3 68.3±0.3 71.0±0.3
7. PERFORMANCE ANALYSIS
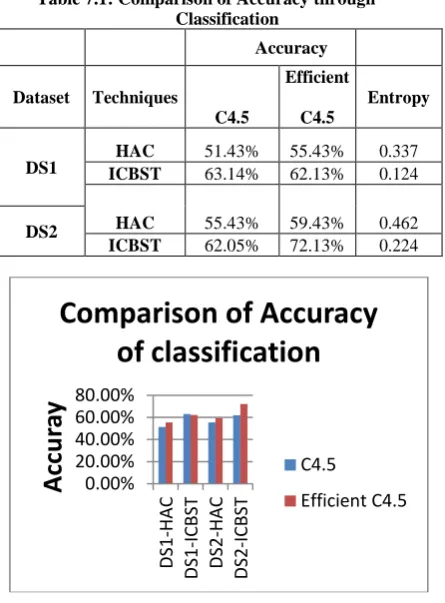
[image:7.595.312.544.278.508.2]In our experiment we obtained different results of both classifications. According to Table 7.1 we evaluate accuracy of different summarization and classifications. So we found our results of ICBST based classification obtain more efficient result with improved C4.5 algorithm.
Table 7.1: Comparison of Accuracy through Classification
Accuracy
Dataset Techniques
C4.5
Efficient
C4.5
Entropy
DS1 ICBSTHAC 51.43% 63.14% 55.43% 62.13% 0.337 0.124
HAC 55.43% 59.43% 0.462
DS2
ICBST 62.05% 72.13% 0.224
Figure 1. Comparison of Entropy through Clustering Techniques
7.1 Evaluation of Classification Technique
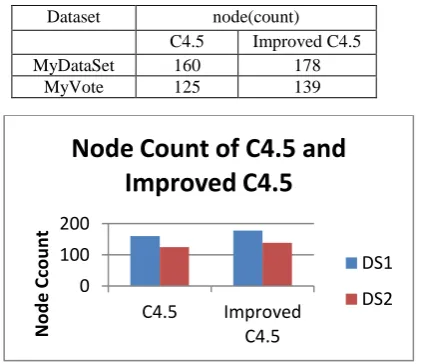
Experimental data is collected from UCI machine learning repository ,which is publicly available .The results were analysis using C4.5 and Improved C4.5 decision tree algorithm to test accuracy and time complexity of classifiers .To observe the performance of the classifiers on large datasets in terms of node count and rule count and time complexity are presented in the Table 1, Table 2 and Table 3 .The result of experiment shows that the effect of improved C4.5 is better than the C4.5 in three aspects such as node count rule count and time complexity .Time is saved because its complexity is changed from O(n(log2n)2) to O(n). and also the improved C4.5 does not need to scan the for several times ,the memory is also saved .for Showing the change clearly we transform the Table 7.2, Table 7.3 and Table 7.4 to the graph in Figure 2,Ffigure 3 and Figure 4 .
Table 7.2: Time complexity Comparison of C4.5 and Improved C4.5
[image:7.595.64.287.396.698.2]Figure 2 Comparison of time complexity of C4.5 and Improved C4.5 decision tree algorithm
Table 7.3: Comparison of C4.5 and Improved C4.5 in rule count
0.00% 20.00% 40.00% 60.00% 80.00%
DS
1
-H
AC
DS
1
-ICB
ST
DS
2
-H
AC
DS
2
-ICB
ST
Accu
ra
y
Comparison of Accuracy
of classification
C4.5
Efficient C4.5
0 500 1000 1500 2000
C4.5 Improved C4.5
Ti
m
e
(m
.s
e
c)
Time Complexity of C4.5 and
Improved C4.5
DS1
DS2
Dataset Time(msec.)
C4.5 Improved C4.5
DS1 1452 1357
DS2 1062 900
Dataset Rules(count)
C4.5 Improved
C4.5
DS1 114 127
[image:7.595.363.550.591.659.2]Figure 3. Comparison of C4.5 and Improved C4.5 in rule count
[image:8.595.62.273.265.447.2]Table 7.4: Comparison of C4.5 and Improved C4.5 in node count
Figure 4 Comparison of C4.5 and Improved C4.5 in node count
8.
CONCLUSION
Several incremental clustering algorithms are proposed for extracting the most relevant features from Web pages for improving the accuracy of Web classification. In this paper an incremental clustering based summarization technique (ICBST) is introduced which can be time consuming and effective for web document classification. We presented an incremental document clustering algorithm based on maintaining highly coherent clusters at all times. In this Paper C4.5 algorithm was improved and we use approximate calculation of Gain-Ratio (S,A) the experiment proved that it has minimal impact on the classification accuracy ,but the efficiency increased a lot.
We can not only speed up the growing of the decision tree , so that better information of rules can be generated. In this paper the algorithm was verified by different large datasets which are publicly available on UCI machine learning repository. With the improved algorithm, we can get faster and more effective results without the change of the final decision and the presented algorithm constructs the decision tree more clear and understandable.
The method shows good performance in terms of clustering quality and time performance compared to standard document clustering techniques like Hierarchical Agglomerative Clustering (HAC) .It achieves better improvement in the F1 measure as compared to the HAC Technique. This
observation validates the need to find better Web-page summarization methods. It is statistical representation for the measurement of the similarity of each cluster, which provides a cohesive summary for classification.
Efficiency and classification is greatly improved and the disadvantages of low efficiency and memory consumption while dealing with large amount of data were overcome as it was in C4.5.If the amount of data is small the original C4.5 is used because of its higher accuracy.
9.
REFERENCES
[1]. I. H. Witten, E. Frank, Data Mining Practical Machine Learning Tools and Techniques, China Machine Press, 2006.
[2]. S. F. Chen, Z. Q. Chen, Artificial intelligence in knowledge engineering [M]. Nanjing: Nanjing University Press, 1997.
[3]. Z. Z. Shi, Senior Artificial Intelligence [M]. Beijing: Science Press,1998.
[4]. D. Jiang, Information Theory and Coding [M]: Science and Technology of China University Press, 2001.
[5]. M. Zhu, Data Mining [M]. Hefei: China University of Science and Technology Press ,2002.67-72.
[6]. A. P. Engelbrecht., A new pruning heuristic based on variance analysis of sensitivity information[J]. IEEE Trans on Neural Networks, 2001, 12(6): 1386-1399.
[7]. N. Kwad, C. H. Choi, Input feature selection for classification problem [J],IEEE Trans on Neural Networks, 2002,13(1): 143- 159.
[8]. Quinlan JR.Induction of decision tree [J].Machine Learing.1986
[9]. Quinlan,J.R.C4.5:ProgramsforMachineLearning.SanMat eo, CA:Morgan Kaufmann1993
[10]. UCIRepository of machine earning databases. University of California, Department of Information and Computer Science, 1998. http: //www.ics. uci. edu/~mlearn/MLRepository. Html
[11].T.Joachims, “Web document categorization with Support Vector Machines: Learning with Many Relevant Features”, Proceedings European Conference on Machine Learning (ECML), Issue 5, pp.153-162, Berlin, 1998.
[12].M. Sravanthi, C. R. Chowdary, and P. S. Kumar, “QueSTS: A query specific text summarization system” Proceedings of the
[13].21st International FLAIRS Conference, Florida, AAAI Press, USA, pages 219–224, 2008.
[14].X. Wan, J. Yang, and J. Xiao. “Towards an iterative reinforcement approach for simultaneous document summarization and keyword extraction”,Proceedings of the 45th Annual Meeting of the Association of Computational Linguistics, pages 552–559, Prague, ACL, Czech Republic, June 2007.
[15].Weka Tool, “www.cs.waikato.ac.nz/ml/weka/”.
[16].WebKB UCI KDD dataset
“http://archive.ics.uci.edu/ml/”. 0
100 200
C4.5 Improved C4.5
Ru
le
co
u
n
t
Rule Count of C4.5 and
Improved C4.5
DS1
DS2
0 100 200
C4.5 Improved C4.5
N
o
d
e
Cc
o
u
n
t
Node Count of C4.5 and
Improved C4.5
DS1
DS2
Dataset node(count)
C4.5 Improved C4.5
MyDataSet 160 178