http://dx.doi.org/10.4236/ajibm.2014.47044
A Monte Carlo Based Robustness
Optimization Method in New Product Design
Process: A Case Study
JianguoChe,JingWang,KaiLi
Department of Industrial Engineering, Nankai University, Tianjin, China
Email:
Received 25 May 2014; revised 19 June 2014; accepted 10 July 2014
Copyright © 2014 by authors and Scientific Research Publishing Inc.
This work is licensed under the Creative Commons Attribution International License (CC BY).
Abstract
Monte Carlo method can analyze, solve and optimize many mathematical or physical problems through generating a large number of statistical random samples to simulating stochastic events. It also can be used to remarkably improve design quality of new product. In new product design proc‐ ess, setting distribution characteristics of the design variables is vital to product quality and produc‐ tion robustness. Firstly, response surface model between output characteristics and design variables in new product design is proposed, and the distribution characteristics of design variables and re‐ sponse output are analyzed; then position error model of response output and standard value and allowed error maximum is presented; and then the differences of position error model and allowed error maximum are counted, and reliability ratio is built and calculated, and design robustness of the new product is increased by adjusting the precision value of random design variables in Monte Carlo experiments. Finally, a case is brought forward to verify the validity of the method.
Keywords
Monte Carlo Simulation, Robustness Optimization, New Product Design, Process Improvement
1.
Monte
Carlo
Method
algo-rithm, and does not need to know parameter’s distribution type and probability parameter [1]-[5]. In new product de-sign, usually design parameter is a random variable that follows a probability distribution. Design parameter is a key impact factor to design robustness, and distribution of these design parameters determines greatly robustness of out-put response. It is not reliable to optimize this product design problem using traditional deterministic method. How to find the optimum value of these design parameters is an important problem to improve the design robustness of new product. Here, we propose a robustness optimization method of new product based on Monte Carlo simulation.
Procedures are as followed [6]-[10]:
1) To analyze the problem existing in new product design, and define the relationship between design vari-ables X and response output as a response surface model f x
f x x
1, , ,2 xn
;2) To analyze design variables’ distribution types and define design variables’ distribution characteristics, such as mean and standard deviation, etc.;
3) To sample from populations of random design variables X, and get the sample x j
xj1,xj2, , xjn
T;4) To bring sample x j
into position error model between response surface model and standard value,
f x , then get a r position error sample and compose an experiment
Tmax , 1, 2, , ,
i g x Hj i g xj xj xjn Bi
, (Bi is response output, i1, 2,,n);
5) To check if it meets Yj f x
imax
0,
is allowed error maximum.6) To repeat step 2) to 5) by k times, and calculate the number of Yj 0 in all independent samples Yj,
1
k
T j
j
K
E
U
, here KT is the number of Yj 0,
0 0 1 0 j j j Y U Y ;
7) To calculate reliability ratio PKT K. If PD (D is acceptable reliability), then process or product
is robust, otherwise we need to modify the precision value of random design variables to enhance reliability ra-tio and robustness of the manufacture process, then the manufacture process is optimized.
2.
Case
Study
Considering design of a pressure container, according to mechanics of materials, the pressure container’s axial
stress is 1
2 pR
, hoop stress is
2
2 1 2 2
pR R H
, here p is internal pressure of container; is wall thickness of container; R is internal radius of container; H is half height of container. Material of container
is 15 MnV. Through observation of experiment, we defined the design variables and their distribution characteristics as followed: internal work pressure of container p follows lognormal distribution p~LN
14.495,1.44952
,the tolerance of p is (10, 20), the material strength limit S follows lognormal distribution S ~LN
392,192
,the tolerance of S is (340, 420), wall thickness of container follows normal distribution
2
~N 3.0, 0.1133
,
the tolerance of is (1.5, 4.5), internal radius of container R follows normal distribution R~N
88, 0.882
,the tolerance of R is (50, 100), half height of container H follows normal distribution H ~N
220,112
, the to-lerance of H is (130, 210). Our objective is to maximize container’s volume under 95% failure probability (con-
fidence level) of strength and container size falling Interval 2H R2.5.
As known, our objective function is volume maximum of the pressure container, that is
4
3
2
max , , , , π 2π
3
s
f p R H R R HR
Constraints are 1 2 2 2 3 : 0 2
: 1 0
2
: 2 2.5
s s pR g pR R g H
g H R
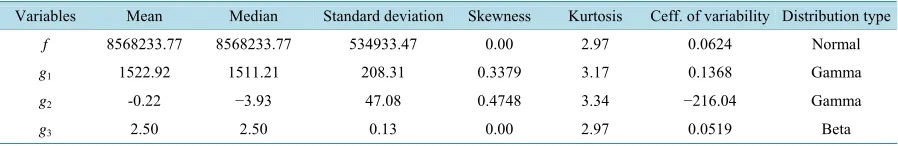
con-tainer and constraints condition, and run Monte Carlo experiment 3000 times using Crystal Ball 7. According to Anderson-Darling testing, Chi-Square testing and K-S testing [11]-[13], we can fit the probability distribution type of all four response variables as Normal distribution, Gamma distribution, Gamma distribution and Beta distribution, see Table 1.
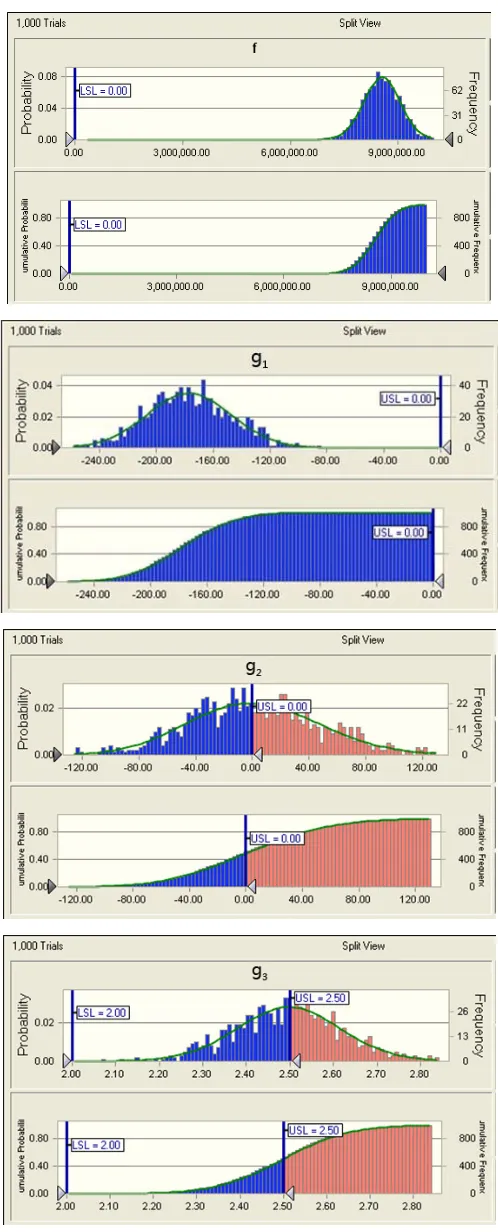
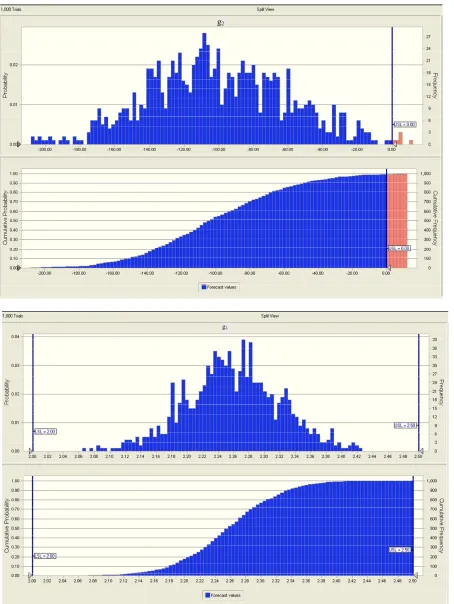
Then we get probability distribution and cumulative probability distribution of response variable and con-straints as showed in Figure 1.
1) Robust analysis
We can know from Figure 2 that probability which product design met constraint g1 is
0 g y1d 1 95%,and probability which product design met constraint g2 is 0 g2dy 0.5037 95%
, and probability whichproduct design met constraint g3 is
22.5g3dy0.5052 95% under current design variables value. That is, wave range of constraints both g1 and g2 go beyond their allowed range. According to requirements, currentre-sponse output value is not robust and need to improve product design level. 2) Sensitivity analysis
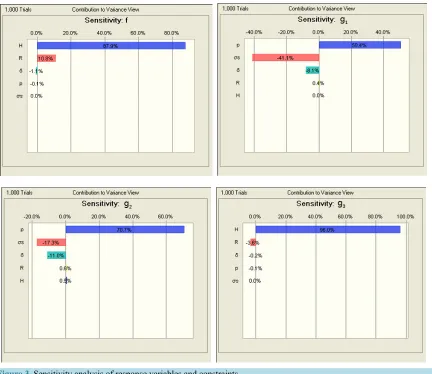
We can know from Sensitivity Analysis of Response Variables and Constraints inFigure 3 that the
signifi-cant impact factors of volume function f of pressure container are H (positive correlation) and R (positive
correlation) in order; the significant impact factors of constraint g1 are p (positive correlation), s
(nega-tive correlation) and (negative correlation) in order; the significant impact factors of constraint g2 are p
(positive correlation), s (negative correlation) and (negative correlation) in order; the significant impact factors of constraint g3 are H (positive correlation) and R (negative correlation) in order.
3) Modification of design variables precision
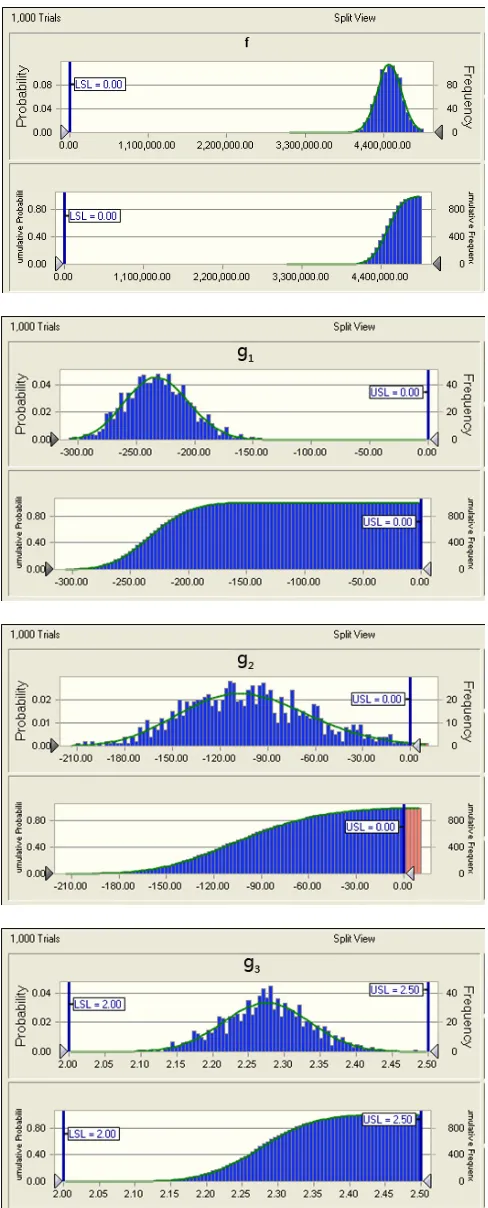
According to relationships between design variables and response output variable, and contributions to vari-ance view from Figure 3, we modified parameter values of the design variables p, s, , ,R H to
2
~ 16,1.4495
p LN , S ~LN
392,192
, ~N
3.0, 0.11332
, R~N
74,12
, H~N
180, 42
, and getthe corresponding probability distribution and cumulative probability distribution as followed in Figure 4.
[image:3.595.90.539.437.510.2]After Modification of design variables precision, we analyze robustness of response variable and constraints
Table 1. Analysis of response variables’ distribution characteristics.
Variables Mean Median Standard deviation Skewness Kurtosis Ceff. of variability Distribution type
f 8568233.77 8568233.77 534933.47 0.00 2.97 0.0624 Normal
g1 1522.92 1511.21 208.31 0.3379 3.17 0.1368 Gamma
g2 -0.22 −3.93 47.08 0.4748 3.34 −216.04 Gamma
[image:3.595.257.373.471.696.2]g3 2.50 2.50 0.13 0.00 2.97 0.0519 Beta
Figure 2. Probability distribution and cumulative probability
Figure 3. Sensitivity analysis of response variables and constraints.
again, and get the probability that product design met constraints g1 is
0 g y1d 1 95%, and the probabilitythat product design met constraints g2 is 0 g2dy 0.9922 95%
, and the probability that product design metconstraints g3 is
22.5g3dy0.9993 95% , which reached product design requirements, that is, pressure con- tainer is robust enough, and pass percentage of pressure container has been enhanced greatly. And the maximum volume of container is f 4,525,100, product robustness has been greatly improved. Meanwhile, we knewfrom sensitivity analysis of response variables in Figure 3 that we should keep monitoring the fluctuation of the
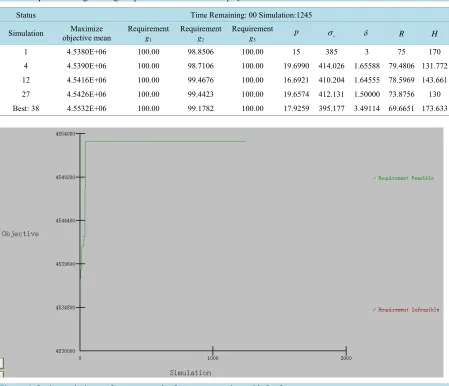
significant impact factors of response variables and constraints to hold robustness of pressure container. 4) Design optimization
Now we further optimize the pressure container to enhance the design robustness using OptQuest optimizer. Here we create the OptQuest model and run simulation experiments 1500 times according to distribution char-acteristics of design variables and constraints condition [4]-[6], and get the optimum of design variables
, s, , ,
p R H are p, s, , ,R H
17.9259,395.177,3.49114,69.6651,173.633
in Table 2, then the probabil-ity that product design met constraints g1 are
0 g y1d 1 95%, and the probability that product design metconstraints g2 was 0 g2dy 0.9918 95%
, and the probability that product design met constraints g3 is2.5 3
2 g yd 1 95%
from Figure 5, and the maximum volume of container is f 4,553, 200 as Figure 6g2
[image:8.595.87.541.81.685.2]g3
Figure 5. Probability distribution and cumulative probability distribution of response variable and constraints after
Table 2. Optimum design settings of pressure container with OptQuest.
Status Time Remaining: 00 Simulation:1245
Simulation objective mean Maximize Requirement g1
Requirement g2
Requirement g3
p
s
R H
1 4.5380E+06 100.00 98.8506 100.00 15 385 3 75 170
4 4.5390E+06 100.00 98.7106 100.00 19.6990 414.026 1.65588 79.4806 131.772
12 4.5416E+06 100.00 99.4676 100.00 16.6921 410.204 1.64555 78.5969 143.661
27 4.5426E+06 100.00 99.4423 100.00 19.6574 412.131 1.50000 73.8756 130
[image:9.595.89.536.101.478.2]Best: 38 4.5532E+06 100.00 99.1782 100.00 17.9259 395.177 3.49114 69.6651 173.633
Figure 6. Optimum design performance gragh of pressure container with OptQuest.
3.
Conclusion
When random changes exist in design variables, traditional determined optimization method cannot guarantee robustness of product and process design to the extent. While Monte Carlo method can be used to precision con-trol and optimization in product and process design, which can avoid increasing cost due to duplicate experi- ments and excessive design precision, as well as low pass percentage due to deficient design precision. In robust analysis and design, Monte Carlo method also can study on change of response model of product and process brought by modification of design variables, get probability distribution and statistical parameters’ values of re-sponse variables, further improve design robustness of product and process and realize robustness design and optimization of product and process. It proved that analysis and optimization of response surface model based on Monte Carlo method was a good robustness design method, and can markedly improve robustness, precision and pass percentage of product and process.
Funding
References
[1]Fonseca, J.R., Friswell, M.I. and Lees, A.W. (2007) Efficient Robust Design via Monte Carlo Sample Reweighting.
In-ternational Journal for Numerical Methods in Engineering, 69
[2]Ray, L.R. and Stengel, R.F. (1993)A Monte Carlo Approach to the Analysis of Control System Robustness. Automati- ca,
29, 229-236.
[3]Arnér, M. (2014) Monte Carlo Methods for Robust Design. Statistical Robust Design: An Industrial Perspective. Pub-
lished Online, 1
[4]Eric, V. (1998) Robust Monte Carlo Methods for Light Transport Simulation. Ph.D. Dissertation of Stanford Universi- ty, Stanford.
[5]Conceição, E.L.T. and Portugal, A.A.T.G. (2011) Finite-Sample Comparison of Robust Estimators for Nonlinear Re- gression Using Monte Carlo Simulation: Part I. Univariate Response Models. Computers & Chemical Engineering, 35,
[6]Todorov, V., Neykov, N. and Neytchev, P. (1994) Robust Two-Group Discrimination by Bounded Influence Regres- sion: A Monte Carlo Simulation. Computational Statistics & Data Analysis, 17, 289-302.
[7]Mandur, J. and Budman, H. (2014) Robust Optimization of Chemical Processes Using Bayesian Description of Para-
metric Uncertainty. Journal of Process Control, 24, 422-430
[8]Wang, Y., Cao, Z.J. and Au, S.-K. (2010) Efficient Monte Carlo Simulation of Parameter Sensitivity in Probabilistic Slope Stability Analysis. Computers and Geotechnics, 37, 1015-1022.
[9]Meng, X.-J., Zhang, C., Zhan, M.-J. and Shi, Z.-X. (2004) Robustness Analysis of Locus Generating Linkage through Monte-Carlo Method. Journal of Mechanical Science and Technology, 23, 203, 205, 214.
[10] Zhang, L., Zhang, W.M. and Shen, Y.H. (2006) Robust Design for Locus Generating Steering Mechanism Based on Monte Carlo Method. Journal of University of Science and Technology Beijing, 28, 1174-1177.
[11] Yan, Y.D., Meng, Q., Wang, S.A. and Guo, X.C. (2012) Robust Optimization Model of Schedule Design for a Fixed Bus Route. Transportation Research Part C: Emerging Technologies, 25, 113-121.
[12] Varas, M., Maturana, S. and Pascual, R. (2014) Ignacio Vargas, Jorge Vera. Scheduling Production for a Sawmill: A Robust Optimization Approach. International Journal of Production Economics, 150, 37-51.
[13] Boylan, G.L., Goethals, P.L. and Cho, B.R. (2013) Robust Parameter Design in Resource-Constrained Environments: An Investigation of Trade-Offs between Costs and Precision within Variable Processes. Applied Mathematical Model-
currently publishing more than 200 open access, online, peer-reviewed journals covering a wide range of academic disciplines. SCIRP serves the worldwide academic communities and contributes to the progress and application of science with its publication.