© 2015, IRJET ISO 9001:2008 Certified Journal Page 1087
Maximum Power Point Tracking of Grid Connected
Solar Wind Hybrid System
Amjed M
1, Binu Krishnan U
21
Assistant Professor, EEE Department, MES college of Engineering, Kuttipuram, Kerala, India
2Assistant Professor EEE Department,Aryanet Institute of Technology, Palakkad, Kerala, India
1[email protected],2[email protected]
---***---Abstract -
The use of renewable energy technology tomeet the energy demands has been increasing for the past few years. However, the important drawbacks associated with renewable energy systems are their inability to guarantee reliability and their intermittent nature. At present, standalone solar photovoltaic and wind systems have been promoted on a larger scale. Standalone solar photovoltaic energy system cannot provide reliable power during night time or non-sunny days. The standalone wind system cannot satisfy constant load demands due to fluctuations in the magnitude of wind speeds from hour to hour throughout the year. Therefore, energy storage systems will be required for each of these systems in order to satisfy the power demands which are expensive and the size has to be reduced to a minimum possible for the renewable energy system to be cost effective. Hybrid power systems can be used to reduce energy storage requirements and for economical operation it is desirable to operate the system in its maximum power point value. The proposed method is to operate the wind solar hybrid system at its maximum power point by using sufficient power electronic devices and corresponding control method. The system is modeled in MATLAB SIMULINK and simulation results show that maximum power is tracked from a hybrid system at varying environmental conditions.
Key Words:
doubly fed induction generators,
permanent magnet synchronous generators, maximum
power point tracking.
1. INTRODUCTION
ENERGY has a vital role for the development of a nation and it has to be conserved in a most efficient manner. Energy is the ultimate factor responsible for both industrial and agricultural development. The new technologies which are developed to produce energy in
the most environmental friendly manner and conservation of energy resources in most economical way has equal importance. The use of renewable energy technology to meet the energy demands has been steadily increasing for the past few years. Import of petroleum products constitutes a major drain on our foreign exchange reserve. Renewable energy sources are considered to be the better option to meet these challenges. The important drawbacks associated with renewable energy systems are their inability to guarantee reliability and their intermittent nature. A major challenge of grid integrating an increasing
number of renewable-energy-based distributed
generators is faced while ensuring stability, voltage regulation, and power quality [1].
© 2015, IRJET ISO 9001:2008 Certified Journal Page 1088 permanent magnet in the rotor of the PMSG makes it
unnecessary to supply magnetizing current through the stator for constant air-gap flux.
Solar energy is green energy, which is inexhaustible and environmentally friendly. It is becoming one of the most promising alternatives for conventional energy sources. Due to this, photovoltaic solar energy has been increasingly used to generate electric power from sunshine. A PV solar device, cell, or module converts solar energy directly to electrical energy [7]. If many cells are connected in series and parallel, a solar photovoltaic module is formed. Several PV solar devices are used to for a PV cell and several cells are used to form a PV module. Solar energy obtained from a solar PV cell is not constant all the time. The amount of extracted power from a PV system is a function of the PV array voltage and current set point [8]. Furthermore the power is affected by external conditions like solar irradiance and temperature. Under uniform solar irradiance level with no partial shading, the nonlinear current-voltage (I-V) characteristics of a PV solar module will have one optimal operating point corresponding to a unique maximum power point (MPP) on its power-voltage (P-V) curve [9]. In practice, since a solar module is composed of many solar cells which are connected with each other in series and/or in parallel, if some cells on the panel are shaded, sometimes caused by surrounding buildings, passing cloud in the sky or birds landing on solar panel, the P-V characteristics of solar panels becomes very complicated as multiple maximum power points exist on the P-V characteristic curves [10].
At present, standalone solar photovoltaic and wind systems have been promoted around the world on a comparatively larger scale. These independent systems cannot provide continuous source of energy, as they are seasonal. For example, standalone solar photovoltaic energy system cannot provide reliable power during non-sunny days.The standalone wind system cannot satisfy constant load demands due to significant fluctuations in the magnitude of wind speeds from hour to hour throughout the year. Therefore, energy storage systems will be required for each of these systems in order to satisfy the power demands. Usually storage system is expensive and the size has to be reduced to a minimum possible for the renewable energy system to be cost effective. Hybrid power systems can be used to reduce energy storage requirements.
2. DG SYSTEM OVERVIEW
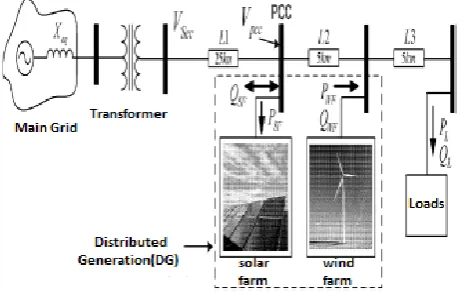
Fig. 1 shows the single-line diagram of the study system. A wind farm is modelled as a fully controlled converter– inverter-based permanent-magnet synchronous generator and a photovoltaic solar farm is modelled as a voltage-source inverter with a dc-bus capacitor. Both are integrated into a distribution network at different points.
The load is considered to be of passive R–L type and it is also given at different point. Both units are designed to supply maximum power to the grid at varying environmental conditions.
[image:2.595.320.551.155.301.2]Fig-1: Single line diagram of the distributed generation study system
Fig -2:Control structure of a PMSG-based stand-alone variable-speed wind turbine
3. WIND ENERGY CONVERSION SYSTEM
3.1 System Configuration
[image:2.595.311.556.342.467.2]
© 2015, IRJET ISO 9001:2008 Certified Journal Page 1089 power from the wind turbine and to supply the loads. An
IGBT inverter is used to regulate the output voltage and frequency.
3.2 Wind Turbine Model
The amount of power captured by the wind turbine (power delivered by the rotor) is given by
where ρ is the air density (1.225kg/m³), is the wind speed in
meters per second, A is the blades’ swept area(1.06m²), and
Cp is the turbine-rotor-power coefficient, which is a function
of the tip-speed ratio (λ) and pitch angle (β). is the
rotational speed of turbine rotor in mechanical radians per
second, and R is the radius of the turbine. The coefficient of
performance of a wind turbine is influenced by the tip-speed to wind-speed ratio, which is given by
Cp is given by the following equation
The wind turbine can produce maximum power when the
turbine operates at maximum (i.e., at ). Therefore,
it is necessary to keep the rotor speed at an optimum value
of the tip-speed ratio . If the wind speed varies, the rotor
speed should be adjusted to follow the change.
3.3 Generator Side Converter Control
The optimum power from a wind turbine is calculated as
Where
The proposed control objective is to control the duty cycle
of the switch Sin Fig. 2 to extract maximum power from the variable-speed wind turbine and transfer the power to the load.
In order to do this first generator speed is measured. Then reference torque is measured using the equation:
can be measured from the values corresponding to
maximum power point at a particular wind speed and it is calculated as 1.7× Nm/(rad/s)².
The actual power in the dc side can be calculated using the equation:
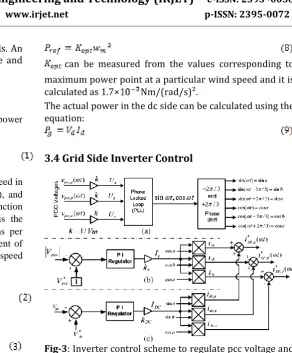
[image:3.595.264.557.57.411.2]3.4 Grid Side Inverter Control
Fig-3: Inverter control scheme to regulate pcc voltage and dc power
Fig. 3 shows the block diagram of the control scheme used to achieve the proposed concept. The controller is composed of two proportional–integral (PI) based voltage-regulation loops. One loop regulates the PCC voltage, while the other maintains the dc-bus voltage across capacitor at a constant level. The PCC voltage is regulated by providing leading or lagging reactive power during bus voltage drop and rise, respectively. A phase-locked loop (PLL) based control approach is used to maintain synchronization with PCC voltage. A hysteresis current controller is utilized to perform switching of inverter switches.
4. PV SOLAR SYSTEM
4.1 PV Array Modeling
© 2015, IRJET ISO 9001:2008 Certified Journal Page 1090 Fig-4: Simplified equivalent circuit of a photo voltaic cell
where the symbols are defined as follows: e: electron charge (1.602 × 10⁻¹⁹ C). k: Boltzmann constant (1.38 × 10⁻²³ J/oK). Ic: cell output current, A.
Iph: photocurrent, function of irradiation level and junction temperature (5 A).
Io: reverse saturation current of diode (0.0002 A). Rs: series resistance of cell (0.001 Ω).
Tc: reference cell operating temperature (20 °C). Vc: cell output voltage, V.
Both k and Tc should have the same temperature unit, either Kelvin or Celsius. Eq. (10) gives the voltage of a single solar cell which is then multiplied by the number of the cells connected in series to calculate the full array voltage. Since the array current is the sum of the currents flowing through the cells in parallel branches, the cell current Ic is obtained by dividing the array current by the number of the cells connected in parallel before being used in equation (10). If the temperature and solar irradiation levels change, the voltage and current outputs of the PV array will follow this change. Hence, the effects of the changes in temperature and solar irradiation levels should also be included in the final PV array model. For a known temperature and a known solar irradiation level, a model is obtained and then this model is modified to handle different cases of temperature and irradiation levels. When the ambient temperature and irradiation levels change, the cell operating temperature also changes, resulting in a new output voltage and a new photocurrent value. The solar cell operating temperature varies as a function of solar irradiation level and ambient temperature. The variable ambient temperature Ta affects the cell output voltage and cell photocurrent. These effects are represented in the model by the temperature coefficients and for cell output voltage and cell photocurrent, respectively, as:
where, = 0.004 and = 0.06 for the cell used and Ta=20°C is the ambient temperature during the cell testing. This is used to obtain the modified model of the cell for another ambient temperature Tx. Even if the ambient temperature does not change significantly during the daytime, the solar irradiation level changes depending on the amount of sunlight and clouds. A change in solar irradiation level causes a change in the cell photocurrent and operating temperature, which in turn affects the cell output voltage. If the solar irradiation level increases from Sx1 to Sx2, the cell operating temperature and the photocurrent will also increase from Tx1 to Tx2 and from Iphl to Iph2, respectively. Thus the change in the operating temperature and in the photocurrent due to variation in the solar irradiation level can be expressed via two constants, Csv and Csi, which are the correction factors for changes in cell output voltage Vc and photocurrent Iph, respectively:
where, Sc is the benchmark reference solar irradiation level during the cell testing to obtain the modified cell model. Sx is the new level of the solar irradiation.
Using correction factors, , and , the new values
of the cell output voltage and Photocurrent are
obtained for the new temperature Tx and solar irradiation Sx as follows:
4.2 Maximum Power Point Tracking
The output power of solar cell depends mainly on three parameters which are temperature, solar irradiation and cell output voltage. The maximum power point can be tracked by varying the cell voltage or by varying the solar irradiation. In order to vary the solar irradiation the axis of solar panel is adjusted mechanically with respect to the position of the sun. Because of the development of power electronic devices electrical method of power tracking is preferred. In this the output voltage of solar cell is controlled by using power electronic converters to a particular reference value corresponding to the maximum power point.
© 2015, IRJET ISO 9001:2008 Certified Journal Page 1091 compared. The maximum power point is obtained when
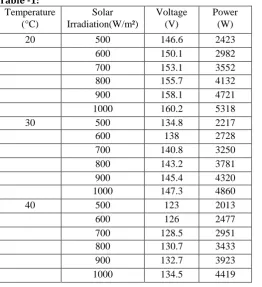
output at kth sample is less than that of (k-1)th sample. The voltage and power at that instant is taken and it is set as reference value. The reference value of voltage and power at various conditions of temperature and solar irradiation is calculated. These values are used to prepare look up table for voltage and power.
4.3 Inverter Control
[image:5.595.317.541.220.355.2]The controller is similar to that of wind energy system which composed of two proportional–integral (PI) based voltage-regulation loops. One loop regulates the PCC voltage, while the other maintains the dc-bus voltage across SF inverter capacitor at a constant level. The dc reference value is provided from the look up table which is prepared for different temperature and solar irradiation as given in table 1. The PCC voltage is regulated by providing leading or lagging reactive power during bus voltage drop and rise, respectively. A phase-locked loop (PLL) based control approach is used to maintain synchronization with PCC voltage. A hysteresis current controller is utilized to perform switching of inverter switches.
Table -1: Temperature
(°C)
Solar Irradiation(W/m²)
Voltage (V)
Power (W)
20 500 146.6 2423
600 150.1 2982
700 153.1 3552
800 155.7 4132
900 158.1 4721
1000 160.2 5318
30 500 134.8 2217
600 138 2728
700 140.8 3250
800 143.2 3781
900 145.4 4320
1000 147.3 4860
40 500 123 2013
600 126 2477
700 128.5 2951
800 130.7 3433
900 132.7 3923
1000 134.5 4419
5. SIMULATION RESULTS
[image:5.595.37.300.402.690.2]In order to verify the modeling of wind turbine, a ramp input is given to the rotor speed at a particular wind speed. The variation of power developed with the variation of rotor speed at different wind speed is shown in the Fig. 5. It shows that for different wind speed maximum power is obtained at different rotor speed and as the wind speed increases the maximum power obtained and speed at which maximum power obtained increases.
Fig-5: Variation of power due to change in rotor speed at different wind speed
When the turbine is connected to the system the input to the wind turbine is given in the form of step signal having initial value 20, final value 21 at a step time of 5 second in order to represent change in wind speed from 20m/s to 21m/s. The rotor speed is given initially a value of 100rad/sec till PMSG develop a speed more than that. After the developed speed of PMSG become more than 100rad/sec that value is given as the input rotor speed of wind turbine. The Output power and torque of wind turbine is given in Fig. 6 and Fig. 7 respectively. It shows the variation of those quantities when the wind speed changes. The reference and actual power output of system is given in Fig. 8 which shows that actual power developed in the dc side is almost tracking the reference power.
[image:5.595.319.534.581.716.2]© 2015, IRJET ISO 9001:2008 Certified Journal Page 1092 Fig-7: Variation of output power due to change in wind
[image:6.595.317.546.80.247.2]speed
Fig-8: Tracking of reference power and actual power at different wind speed
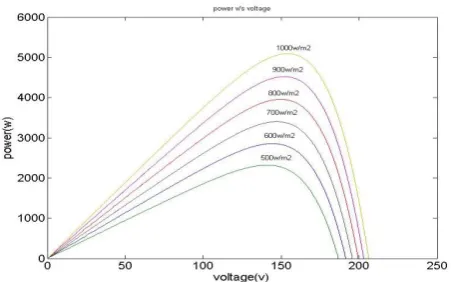
In order to verify the modeling of solar array, a ramp input is given as the current at a particular temperature and solar irradiation. The VI characteristic and PV characteristics at different temperature and solar irradiation is shown in the Fig. 9 to Fig. 12. From Fig. 9 and Fig. 10 it is clear that as the solar irradiation increases the maximum power and voltage corresponding to maximum power increases. Fig. 11 and Fig. 12 show that when temperature increases the maximum power and voltage corresponding to maximum power decreases.
[image:6.595.44.272.99.250.2]Fig-9: Variation of power due to change in voltage at different value of solar irradiation
[image:6.595.322.543.281.404.2]Fig-10:Variation of current due to change in voltage at different value of solar irradiation
Fig-11:Variation of current due to change in voltage at different temperature
Fig-12: Variation of power due to change in voltage at different temperature.
3. CONCLUSIONS
[image:6.595.43.275.282.418.2] [image:6.595.316.544.438.564.2] [image:6.595.45.274.590.731.2]© 2015, IRJET ISO 9001:2008 Certified Journal Page 1093 irradiation. Both systems are connected to a grid in
parallel to supply the power. By integrating the solar photovoltaic and wind systems, the reliability of the systems can be improved and the unit cost of power can be minimized. The simulation results demonstrates that the controllers work very well at varying conditions of wind speed for wind farm and varying temperature and irradiation for solar farm.
REFERENCES
[1] Rajiv K. Varma Vinod Khadkikar, and Ravi
Seethapathy, “Night time Application of PV Solar Farm as STATCOM to Regulate Grid Voltage,” IEEE Trans.
Energy Conservation. vol. 24, pp. 983–985, Dec 2009.
[2] Md. Enamul Haque, Michael Negnevitsky and Kashem M. Muttaqi “A novel control strategy for a variable speed wind turbine with a permanent magnet synchronous generator,” IEEE Trans. Industry Application. vol. 46, pp. 331–339, Jan 2010.
[3] S. Müller, M. Deicke, and R. W. De Doncker, “Doubly fed induction generator system for wind turbines,” IEEE Ind. Appl. Mag., vol.8, no.3, pp. 26-33, May 2002 [4] Akie Uehara, Alok PratapTomonori Goya, Tomonobu Senjyu, Atsushi Yona, Naomitsu Urasaki and Toshihisa Funabashi “A coordinated control method to smooth wind power fluctuations of a PMSG based WECS,” IEEE
Trans. Energy Conservation. vol. 26, pp. 550–558, June
2011.
[5] H. Polinder, F. F. A. Van der Pijl, G. J. de Vilder, and P. J. Tavner, “Comparison of direct drive and geared generator concepts for wind turbines,” IEEE Trans. Energy Conservation. vol. 3, no. 21, pp. 725–733, Sep. 2006.
[6] T. F. Chan and L. L. Lai, “Permanent-magnet machines for distributed generation: A review,” in Proc. IEEE
Power Eng. Annu. Meeting, 2007, pp. 1–6.
[7] Savita Nema,R.K.Nema and Gayatri Agnihotri “MATLAB/SIMULINK based study of photo voltaic cells/modules/arrays and their experimental verification,” International journal of Energy and Environment . vol. 1, pp. 487–500, 2010.
[8] I. H. Altas and A.M. Sharaf “A novel online MPP search algorithm for PV arrays,” IEEE Trans. Energy
Conservation. vol.11, no.4 pp.748-754 Dec 1996.
[9] P. C. M. Bernardo, Z. M. A. Peixoto and L.V. B. Machado Neto, “A high efficient micro controlled buck converter with maximum power point tracking for photovoltaic systems,” International conference on Renewable energies and Power Quality. Apr 2009.
[10] Dr. Abu Tariq, Mohammed Asim and Mohd Tariq,
“SIMULINK based modeling simulation and performance evaluation of an MPPT for maximum power generation on resistive load,” International conference on Environmental Science and Technology. pp. 397–401, 2011.
BIOGRAPHIES
Mr. Amjed M completed his B.Tech from IET Calicut in 2009 and M.Tech from CET Trivandrum in 2012 in the area of Power System. Currently he is working as Assistant Professor in MES college of Engineering, Kuttipuram. He published many papers in International Journals and Conferences. His areas of Interests are Power Quality Issues, Facts devices, power electronics converters
and renewable energy
techniques.
Mr. Binu Krishnan U
completed his B.Tech from GEC Thrissure in 2009 and M.Tech from CET Trivandrum in 2012 in the are of power systems. Currently he is
working as Assistant
Professor in ARYANET