© 2016, IRJET | Impact Factor value: 4.45 | ISO 9001:2008 Certified Journal
| Page 1967
MODELLING AND SIMULATION OF LOAD FLOW ANALYSYS
1
Rahul Kumar and
2Devender Goyat
1,2
Department of Power Electronics ,Rohtak institute of Engineering & Managment
Village Vakrauli kalan ,Rohtak,Haryana-124001
India
---***---Abstract -
The present predicament of electrical power system engineering mainly includes the problems like blackout, power scarcity, ineptness of meeting the necessary demand of power, load shedding etc. As a result new power plants are designed or old ones are extended and upgraded. Load flow analysis plays a vital role in both the above mentioned cases.The power flow analysis provides the nodal voltages and phase angles and hence the power injected at all the buses and power flows through interconnecting power channels. The optimal power flow is used to optimize the load flow solutions of large scale power system. This is done by minimizing the selected objective functions while maintaining an acceptable limit in terms of generator capabilities and the output of the corresponding devices.
Recent decades have seen a significant development in the fields of power generation transmission and distribution systems. Although these developments have played an important role in today’s scenario, there still exists a field where the scope of developments still persists.
Generally loads are taken as constant sink for both reactive and active power; Where as in reality, the load power consumption depends magnitude of voltage and frequency deviations. Optimal Power Flow studies incorporating load modelling is a major tool for minimizing generation and transmission losses, generation costs and maximizing the system efficiency. This thesis focuses on incorporation of load model in OPF analysis and comparing the results obtained with those obtained from OPF studies without incorporating load models.
Key WordsOPF -Optimal Power Flow
PSAT -Power System Analysis Toolbox MATLAB –MATrixLABoratory
P.U. -Per Unit
N-R Technique - Newton-raphson Technique
1.INTRODUCTION : Power flow analysis is the analysis of a network under steady state condition subjected to some inequality constraints under which the system operates. Load flow solution tells about the line flows of reactive and active power and voltage magnitude and phase difference at
different bus bars. It is essential for design of a new power system or for planning for the expansion of the existing one for increased load demand.
Electrical loads of a system comprises of various industrial, residential and municipal loads. In conventional load flow studies, it is assumed that the active and reactive power demands have specified constant values, independent of the voltage magnitudes. But in reality, the active and reactive power of loads of a distribution system are dependent on system voltage magnitude and frequency variations. This effects, if taken into consideration would cause a major change in the results of load flow and OPF studies.
Frequency deviation is not considered significant in case of static analysis like, load flow studies. The effects of voltage deviations are primarily taken into account t o get fast and accurate results and increased system stability and security
1.1 Classification Of Buses
The buses in the power systems are mainly classified into the
following categories:
Load Bus: At this bus the active and reactive power are specified. It is desired to find out the magnitude of voltage and phase angle. It is not required to specify the voltage at a load bus as the voltage can vary within a permissible limit.
Generator Bus: This is also known as voltage controlled bus. Here the net active power and the voltage magnitude are known.
© 2016, IRJET | Impact Factor value: 4.45 | ISO 9001:2008 Certified Journal
| Page 1968
1.2 1.3 NETWORK EQUATIONS
Pi(Active Power) = |Vi| k ||Yik| cos(θik+ Øk- Øi) (1.1)
Qi(Reactive Power) = |Vi| k ||Yik| sin(θik+ Øk- Øi), i=1,2, (1.2)
Where
Pi = Net active power injected at node i.
Qi = Net reactive power injected at node i.
Vi = Voltage magnitude at node i.
θik = angle associated with Yij
Øi = angle associated with V
1.4 PROJECT OBJECTIVE:
The basic objective of this project is development of a voltage dependent load model in which active and reactive powers vary exponentially with voltage and
implementation of this model in Optimal Power Flow and comparison of the results of the above with those obtained from OPF studies without incorporation of load models to ensure minimum losses and generation costs
2.1 PURPOSE OF LOAD FLOW ANALYSIS :
The purpose of Load Flow analysis are as follows :
• To determine the magnitude of voltage and phase angles at all nodes of the feeder.
• To determine the line flow in each line section specified in Kilo Watt (KW) and KVAr,
amperes and degrees or amperes and power factor.
• To determine the power loss.
• To determine the total input to the feeder Kilo Watt (KW) and KVAr.
To determine the active and reactive power of load based on the defined model for the load
2. 2.2 LOAD FLOW SOLUTION METHODS
Following three methods are mostly used for the solution of a Load Flow Problem.
• Gauss-Seidel Technique.
• Newton-Raphson Technique.
• Fast-Decoupled Technique.
2.1 Gauss-Seidel Technique :
This method of solution was named after the German mathematicians Carl Friedrich Gauss and was upgraded by Philipp Ludwig von Seidel. This method is defined for matrices with non- zero diagonal elements, but converges only if the matrix is either symmetric and positive definite or diagonally dominant. The Gauss-Seidel(GS) technique is an iterative technique to solve a set of non-linear algebraic equations. Ini t i a l l y a solution vector is assumed. The revised value of this particular variable is obtained by evaluating an equation by substituting in it the present values of other variables. The same procedure is followed for all other variables completing one full iteration.
2.2 Newton - Raphson Technique: •
• Newton-Raphson technique is an iterative process in which a set of non-linear simultaneous
equations is approximated into a set of linear simultaneous equations using
•
[image:2.595.316.588.612.749.2]• Taylor’s series expansion. In an N-bus bar power system there are n equations for active power flow Pi and n-equations for reactive power flow Qi. The number of unknowns are 2(n-1) because the voltage at the slack or swing bus is known and is kept constant both in magnitude and phase.
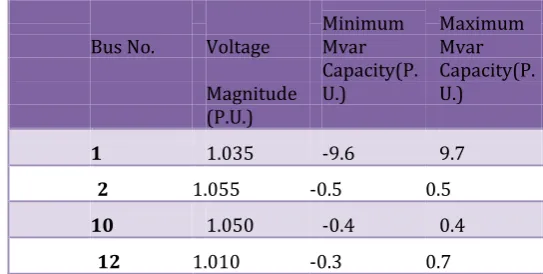
Table -1: Generator Data for IEEE 14 Bus bar System
Bus No. Voltage
Minimum Mvar
Maximum Mvar
Magnitude Capacity(P.U.) Capacity(P.U.)
(P.U.)
1 1.035 -9.6 9.7
2 1.055 -0.5 0.5
10 1.050 -0.4 0.4
© 2016, IRJET | Impact Factor value: 4.45 | ISO 9001:2008 Certified Journal
| Page 1969
Thermal consideration limits the maximum active power generation where as flame instability of a boiler limits the minimum active power generation. Similarly the maximum and minimum reactive power generation is limited by overheating of the rotor and the stability limit of the machine respectively
3.2.2 Voltage Constraints :
| Vpmin| ≤ |Vp| ≤ |Vpmax| and δpmin≤ δp≤ δpmax
The variation in voltage magnitude should be within a prescribed limit for satisfactory operation of the equipments connected to the system otherwise additional use of voltage regulators will make the system cost ineffective
2.4 OPTIMAL POWER FLOW:
Practically the generating stations are never equidistant from the load centres and their fuel costs are never the same. Also, Generally the generation capacity surpasses the total demand and losses. This investigates the need for scheduling generation. In an interconnected power system, the primary objective is to keep a track of the real and reactive power scheduling of each power plant in order to reduce the operating cost. Thus the generator’s active and reactive power have flexibility to vary within defined limits to satisfy the load demand with the lowest possible operating cost. This is defined as Optimal Power Flow (OPF) problem. The considerations like economy of
operation, fossil fuel emissions
3.1 IMPORTANCE OF LOAD MODELLING :
The choices regarding system reinforcements and system performance is mostly based on the results of power flow and stability simulation studies. For performing analysis of power system, models must be integrated to include all relevant system components, such as generating stations, sub stations, transmission and distribution peripherals and load devices. Much attention has been given to modelling of generation and transmission or distribution devices. But the modelling of loads have received much less attention and remains to be an unexplored frontier and carries much scope for future development. Recent studies have revealed that representation and modelling of load can have a great impact on analysis results. Efforts in the directions of improving load-models have been given prime importance.
Dynamic Load Models
:In Dynamic load model the active and reactive power at a particular instant of time is represented as a function of the magnitude of voltage and frequency. Dynamic load models are often used in studies regarding voltage stability, inter-area oscillations and long term
stability. Such models are mostly represented using differential equations.
Input-Output Form :
TpṖd + Pd = Ps(v) + Kp(v)V∙ (3.9)
TpQ∙d + Qd = Qs(v) + Kq(v)V∙ (3.10)
Kp(v) = TpPt(v) (3.11)
Kq(v) = TqQt(v) (3.12)
Composite Load Models :
The composite load models are designed to include the effect of various components. It is a combination of a static load (LS), a generic dynamic recovery load (LG) and an aggregate induction motor load (LIM). All the static load components are accounted by the static load(LS). The effects of thermo-statically controlled heating loads and all downstream on-Load Tap Changer (OLTC) actions are taken care of by the generic recovery load(LG). All downstream compressors and other rotating loads are represented by an induction motor
T
p + Pr = Np(v) (3.19)
Np(v) = P0(V/V0)αs – P0(V/V0)αt (3.20)
Pd = Pr + P0(V/V0)αt (3.21)
T
q + Qr = Nq(v) (3.22)
Nq(v) = Q0(V/V0)βs – Q(V/V0)βt (3.23)
Qd = Qr + Q0(V/V0)βt (3.24)
Chart -1: Name of the chart
PROBLEM STATEMENT:
A standard IEEE 14 bus system was considered for analysis both with conventional load flow method and load flow incorporating voltage dependent load models[10]. The simulations were made using Matlab Power system toolbox known as PSAT (Power System Analysis Toolbox)[8]. The results of the simulations were plotted and analyzed.
Table 4.3: Transformer Data for IEEE 14 Bus bar System
© 2016, IRJET | Impact Factor value: 4.45 | ISO 9001:2008 Certified Journal
| Page 1970
Table 4.3: Transformer Data for IEEE 14 Bus bar
System
4.2 ANALYSIS OF RESULTS
4.2.1 Voltage Magnitude
The data obtained from table 6 and 8 shows the
voltage magnitudes at different buses. It can be
observed that, in case of loads that are voltage
independent, the magnitude of voltages are less in
value in comparison to that of voltage dependent
loads. In the former case, the generation of active
power is more pronounced when magnitude of
voltages are greater than 1 p.u. Incorporation of
voltage dependent loads confirms a flat voltage
profile, i.e. the load flow increases magnitudes of
voltages below 1 p.u and decreases those above 1 p.u.
4.2.2 Swing bus Active Power
In both the type of loads the swing bus active power
difference is 2.5 %. This is a quite high value and
accounts for net decrease in power generation and
hence the reduced cost of operation. The active
power difference of swing bus is dependent both on
voltage and phase angle difference and practically is
very tough to predict from conventional load flow
analysis without the incorporation of voltage
dependent loads
4.2.3 Generator Reactive Power
The difference in reactive power lies in the range of 4
% to 16 %. This range is even greater the swing bus
active power difference. A generator bus which had
reached the reactive-power limits in conventional
load-flow analysis was well within the limits when
the load was modelled to vary with voltage. The
generator reactive power difference is also
dependent on phase angle
differences and voltage
magnitudes
4.2.4 Load Active Power
Information about the Load active powers at
different buses. The active power consumption at
different buses in case of voltage dependent and
independent loads are not equal. In case of the
voltage dependent loads, the real power
consumption
is
less
4.2.5 Load Reactive Power
The reactive power at different buses don’t follow
any particular pattern, i.e. at some buses they have
higher values for voltage dependent loads and at
some, they have lower values. But basically the
difference ranges from 0.6 % to 4.2 %.
4.3
Overall Comparison
A cumulative study of total demand, losses,
generation and generation costs are made
and plotted in Fig. 8. It is deduced from the
overall comparison that, in case of load
modelling each of the above mentioned
quantities have a lower value as compared to
that of conventional load flow. There is a
marginal decrease in generation cost and
total losses. A basic cost analysis is given
below to emphasize the importance load
modelling
Generation cost for voltage independent
loads = Rs 165.2545/Hr
Generation cost for voltage dependent loads
= Rs 127.2564/Hr
Difference in generation cost per hour = Rs
37.9981
Difference in generation cost per day =
37.0607*24 = Rs 911.9544
Difference in generation cost per year =
889.4568*365 = Rs 332863.356
Bus No. Voltage Minimum Mvar Maximum Mvar
Magnitude Capacity(P.U.) Capacity(P.U.) (P.U.)
3 1.03 0.0 0.4
8 1.06 -0.05 0.25
6 1.08 -0.04 0.25
© 2016, IRJET | Impact Factor value: 4.45 | ISO 9001:2008 Certified Journal
| Page 1971
3. CONCLUSIONS
This Project introspects the effects of incorporation of load models i.e. the variation of active and reactive power demands with magnitude of voltage at different buses in load flow analysis. The simulation of a standard IEEE 14 bus bar system was conducted and the effects of load modelling were also incorporated in the experiment.
The effect of load modelling could be observed with the pronounced difference in fuel cost. The heavier the loading of the system, the lower is the fuel cost difference[3]. Implementation of load model brings a significant reduction in the generation cost for the whole year. The calculations become more accurate and system security and stability increase by incorporating the voltage dependent load models.
The reactive power modelling greatly affects the voltage difference, whereas the active power modelling has a greater effect on phase angle differences. The total power generation is not much affected by the incorporation of load models but this small difference in generation power affects the generation cost difference and total losses because the generation cost function depends on square of generating power. The voltage profile remains flat which adds to the advantages of incorporation of load models. Thus it is deduced that incorporation of load models in load flow analysis is advantageous than conventional load low analysis as generation costs and losses are reduced and security and stability of the system increases.
5.2 FUTURE WORK
This thesis basically models variation of active and reactive power with voltage and neglects the effect of frequency on them. Basically for easier computation static load models are considered here. Load modelling taking into account the effect of frequency on active and reactive power demand and dynamics of load can bring more accuracy to the results obtained
REFERENCES
[1] D C. L. Wadhwa (2009), “Electrical Power Systems”,
Chap 18, Chap 19.
[2] Dommel, H.W. and Tinney, W. F. “Optimal Power Flow Solutions”, IEE Transactions on power apparatus and systems, Vol Pas-87, No. 10, October 1968
[3] Dias, L. G. And M.E.El-Hawary “Effects of active and
reactive power modelling on
[4] optimal load flows”, IEE PROCEEDINGS, Vol. 136, Pt. C,
No. 5, September 1989
[5] [4]. Dias, L. G. And M.E.El-Hawary “Incorporation of
load models in load flow studies”,
[6] IEE PROCEEDINGS, Vol. 134, Pt. C, No. 1, January 1987
[7] [5]. Dias, L. G. And M.E.El-Hawary “OPF Incorporating
load models maximizing net revenue”, IEEE Transactions on Power Systems, Vol. 8,No. 1, February 1993
[8] Saadat H.(2010), "Power System Analysis", Chap 6,
Chap 7.
[9] MATLAB, Version 2009, MathWorks.
[10] Milano, Federico, “Power System Analysis Toolbox”,
July 2005
[11] M.A Pai,“Operation Of Reconstructed Power System”,
Chap 2
BIOGRAPHIES