Analysis and Comparison of Models for
Classification of Diabetic Disease
Ashutosh Dwivedi1, Amit Kumar Dewangan2
, A. K. Shrivas3
1,2,3 Dr. C. V. Raman Univrsity, Bilaspur (C. G.), India
Abstract- Diagnosis of health condition is very challenging task in medical science. In healthcare, due to large amount of data to extract the useful information and knowledge is very essential. Machine learning techniques play major role and beneficial in health care industry. Classification technique is one of the important machine learning technique which is used as decision maker in real word problem. In this research work, we have used various classification techniques to classify the diabetic and non diabetic disease. We have used Tanagra and WEKA data mining software to analysis of diabetic patient using Indian Liver Patient Diabetic (ILPD) data set. We have compared the performance of models in terms of accuracy, true positive rate (TPR) and true negative rate (TNR) using both data mining software with 10-fold cross validation. Multilayer Perceptron (MLP) achieved better accuracy as 76.18% in case of Tanagra data mining tool while SVM achieved better accuracy as 77.34% in case of WEKA data mining tool. Finally, we conclude that accuracy of models is varying from one tool to another tool.
Keywords: Machine Learning, Classification, Diabetic, Cross Validation.
I. INTRODUCTION
Now a days, medical science are facing very challenging task to diagnosis of disease. Due to increase number of population, diseases are also increasing which is faced by many people. Classification and categorization play very important role to identify the various types of disease. In this research work, we have used various classification techniques to identify the diabetic disease patient. There are various authors have worked in the field of healthcare and they have identify the diagnosis disease and give the solution to diagnosis of this disease. V. V. Vijayan et al. (2014)[6] have discussed various data mining techniques to identify the diabetic disease. They have used EM algorithm, KNN algorithm, K-means algorithm, amalgam KNN algorithm and ANFIS algorithm to diagnosis of diabetic disease. J. Hoon et al. (2014) [5] have analyzed the various classification techniques as Naïve Bayes, Decision Tree, Multilayer Perceptron, k-NN, Random Forest and Logistic. It compares the performance of different classification algorithms. They have compared the performance of models in terms of Kappa statistics, Area under ROC curve, RMSE, precision, recall, sensitivity and specificity. Results show that Logistics is highest accuracy which gives 72.7% of accuracy. A. Gulia et al.(2014)[7 ] have suggested different classification techniques like C4.5, Multilayer Perceptron classifier, Random Forest classifier, Support Vector Machine classifier and Bayesian Network classifier for classification of liver patient data. They have used WEKA data mining tool to analysis of ILPD dataset available on UCI Repository. The results obtained that Support Vector Machine algorithm gives better performance with an accuracy of 71.35% as compared to other algorithms when evaluated without feature selection and Random Forest algorithm gives better performance with an accuracy of 71.8696% as compared to other algorithms when evaluated after feature selection. S. Vijayarani et al., (2015) [9] have used Support Vector Machine (SVM) and Naïve Bayes algorithms for classification of liver patients. Result shows that Support Vector Machine (SVM) is better than Naïve Bayes algorithm in classifying liver patient. M.L. Mayard-Pons et al (2015)[8] have discussed to provide analysis of oral health and tooth loss in a population of type 2 diabetic patients and to address their use of the available preventive facilities, as provided by their social insurance coverage. T. Daghistani et al.(2016) [10] have used Self-Organizing Map (SOM), C4.5 and RandomForest to predict diabetic patients Random Forest achieved the best results compared to other classification techniques. N. Gayathri et al.(2016) [11] have suggested data mining techniques to identify the diabetes and hepatitis disease.
II. METHODOLOGY
Techniques play very important role in the field of research area. This research work used various data mining based classification techniques to categorization of diabetic disease.
less homogeneous states of our target variable (predictable attribute). At each split in the tree, all input attributes are evaluated for their impact on the predictable attribute. When this recursive process is completed, a decision tree is formed. In this research work, we have used C4.5, CART , ID3 and Rnd Tree for analysis of ILPD data set and identify the diabetic disease.
B. Multilayer Perceptron
MLP [12] is a development from the simple perceptron in which extra hidden layers (layers additional to the input and output layers, not connected externally) are added. More than on hidden layer can be used. The network topology is constrained to be feed forward, i.e., loop-free. Generally, connections are allowed from the input layer to the first (and possible only) hidden layer, from the first hidden layer to the second and so on, until the last hidden layer to the output layer. The presence of these layers allows an ANN to approximate a variety of non-linear functions. The actual construction of network, as well as the determination of the number of hidden layers and determination of the overall number of units, is sometimes of a trial-and-error process, determined by the nature of the problem at hand. The transfer function generally a sigmoid function.
C. Support Vector Machine (SVM)
A SVM [1] is a promising new method for classification of both linear and nonlinear data. SVM is based on the concept of decision planes that define decision boundaries. A decision plane is one that separates between a set of objects having different class memberships. SVM algorithms divide the n dimensional space representation of the data into two regions using a hyper plane. This hyper plane always maximizes the margin between the two regions or classes. The margin is defined by the longest distance between the examples of the two classes and is computed based on the distance between the closest instances of both classes to the margin, which are called supporting vectors.
D. Radical Basis Function (RBF)
The Radical Basis Function (RBF) network [2] is popular several times. The popularity of this network arises from the two basic facts.
The first one is that unlike most supervised learning neural network algorithms, it is able to find global optimum. For comparison, using a feed forward neural network with the back propagation learning rule usually finds only the local optimum. The second fact is that training time for RBF network is short compared with the other neural network, most notably when using the back propagation rule for adjustment of the weights. In addition, the topology of the RBF network is very simple to set up, and requires no guessing as with back propagation.
III. DATA SET
The Indian Liver Patient Dataset (ILPD) data set is collected from UCI repository [4] which consist 10 attributes and 1 class having liver and non-liver. This data set also consists of 583 instances. In which 416 are liver patient records and 167 non liver patient records. The data set was collected from north east of Andhra Pradesh, India. This data set contains 441 male patient records and 142 female patient records.
IV. EXPERIMENTAL RESULTS
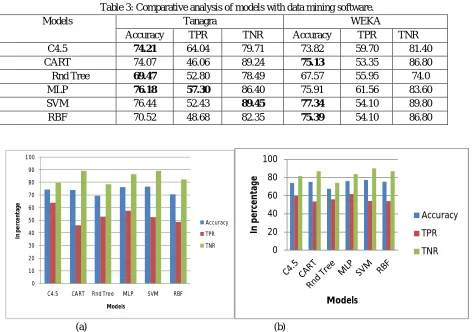
In this research work, we have used WEKA and Tanagra data mining software to analysis of diabetic data. We have compared the performance of models using WEKA and Tanagra data mining tools. We have used various data mining based classification techniques like C4.5, CART, Rnd Tree, MLP, SVM and RBF for classification of diabetic data. The performance evaluates using accuracy, True Positive Rate (TPR) and True Negative Rate(TNR). Table 1 shows that performance of classification techniques using Tanagra data mining software. SVAM gives better accuracy and TNR as 76.44% and 89.45% respectively in case of Tanagra data mining tool. TPR is better as 57.30% in case of MLP. Table 2 shows that accuracy of models in WEKA data mining Tool. Similarly Tanagra data mining, SVM gives better accuracy and TNR as 77.34% and 89.80% respectively in case of WEKA data mining tool.
Table 1: Accuracy of models with Tanagra data mining tool
Models Accuracy TPR TNR
C4.5 74.21 64.04 79.71
CART 74.07 46.06 89.24
Rnd Tree 69.47 52.80 78.49
MLP 76.18 57.30 86.40
SVM 76.44 52.43 89.45
RBF 70.52 48.68 82.35
Table 2: Accuracy of models in WEKA data mining Tool
Model Accuracy TPR TNR
C4.5 73.82 59.70 81.40
CART 75.13 53.35 86.80
Rnd Tree 67.57 55.95 74.0
MLP 75.91 61.56 83.60
SVM 77.34 54.10 89.80
[image:4.612.104.475.91.187.2]RBF 75.39 54.10 86.80
Table 3: Comparative analysis of models with data mining software.
Models Tanagra WEKA
Accuracy TPR TNR Accuracy TPR TNR
C4.5 74.21 64.04 79.71 73.82 59.70 81.40
CART 74.07 46.06 89.24 75.13 53.35 86.80
Rnd Tree 69.47 52.80 78.49 67.57 55.95 74.0
MLP 76.18 57.30 86.40 75.91 61.56 83.60
SVM 76.44 52.43 89.45 77.34 54.10 89.80
RBF 70.52 48.68 82.35 75.39 54.10 86.80
(a) (b) 0 10 20 30 40 50 60 70 80 90 100
C4.5 CART Rnd Tree MLP SVM RBF
[image:4.612.69.542.362.694.2]V. CONCLUSIONS AND FUTURE WORK
In recent year data mining is one of the important techniques in every field of research. We are using data mining techniques in healthcare, education, banking and many areas to solve the problem of related areas. To extract the useful information from knowledge data mining techniques play very important role. In this research work, we have used classification techniques to classify the diabetic and non diabetic data. We have also used Tanagra and WEKA data mining software for analyzing the diabetic data and compare the accuracy of model with both data mining tools. Results shows that performance of SVM model is better compare to other existing models with WEKA data mining software. In future we will use other data mining tools to analysis of diabetic data. We will also test the other data sets using these tools and check the robustness of models.
REFERENCES
[1]. V. Vapnik, “Statistical Learning Theory”, Wiley, 1998.
[2]. K. J. Cios, W. W. Pedrycz and R. W. Swiniarski , “Data Mining Methods for Knowledge Discovery”, Kluwer Academic Publishers, 3rded., 1998. [3]. Z. Tang and J. Maclennan, “Data Mining with SQL Server 2005”,Willey Publishing, Inc, USA, 2005.
[4]. UCI Machine Learning Repository [http://archive.ics.uci.edu/ml/datasets.html](Browing date: Jan : 2107).
[5]. J. Hoon, S. Kim and J. Kim, “Decision Factors on Effective Liver Patient Data Prediction”, International Journal of Bio-Science and Bio-Technology Vol.6, No.4, pp.167-178,2014.
[6]. V.V. Vijayan and A. Ravikumar, “Study of Data Mining Algorithms for Prediction and Diagnosis of Diabetes Mellitus”, International Journal of Computer Applications, Vol. 95(17), PP 12-16, 2014.
[7]. A. Gulia, R. Vohra and P. Rani, “ Liver Patient Classification Using Intelligent Techniques”, International Journal of Computer Science and Information Technologies, Vol. 5 (4) ,pp. pp. 5110-5115,2014.
[8]. M. L. Mayard-Pons, F. Rilliard, J.C. Libersa, A. M. Musset and P. Farge, “Database analysis of a French type 2 diabetic population shows a specific age pattern of tooth extractions and correlates healthcare utilization” , Journal of Diabetes and Its Complications, Vol. 29 , pp. 993–997,2015.
[9]. S. Vijayarani, S. Dhayanand, ”Liver Disease Prediction using SVM and Naïve Bayes Algorithms”, International Journal of Science, Engineering and Technology Research (IJSETR), Vol. 4, Issue 4,pp. 816-820, 2015.
[10].T. Daghistani and R. Alshammari, Diagnosis of Diabetes by Applying Data Mining Classification Techniques, (IJACSA) International Journal of Advanced Computer Science and Applications, Vol. 7, No. 7,pp. 329-332,2016.