R E S E A R C H
Open Access
Classifying leukemia types with chromatin
conformation data
Mathieu Rousseau
1,2†, Maria A Ferraiuolo
1†, Jennifer L Crutchley
1†, Xue Qing David Wang
1, Hisashi Miura
1,
Mathieu Blanchette
2*and Josée Dostie
1*Abstract
Background:Although genetic or epigenetic alterations have been shown to affect the three-dimensional
organization of genomes, the utility of chromatin conformation in the classification of human disease has never been addressed.
Results:Here, we explore whether chromatin conformation can be used to classify human leukemia. We map the
conformation of the HOXA gene cluster in a panel of cell lines with 5C chromosome conformation capture technology, and use the data to train and test a support vector machine classifier named 3D-SP. We show that 3D-SP is able to accurately distinguish leukemias expressing MLL-fusion proteins from those expressing only wild-type MLL, and that it can also classify leukemia subtypes according to MLL fusion partner, based solely on 5C data.
Conclusions:Our study provides the first proof-of-principle demonstration that chromatin conformation contains the information value necessary for classification of leukemia subtypes.
Background
The organization of the human genome in the nucleus is non-random and important for proper gene expression [1-4]. For instance, chromosomes are known to occupy distinct regions called‘chromosome territories’that are an-chored to the lamina. Gene-rich chromosomes tend to localize at the center of the nucleus and gene-poor near the periphery [5-9]. The co-localization of co-regulated genes into transcription factories is another key feature of genome organization that is thought to coordinate and/ or potentiate transcriptional responses [5-9]. Chromatin architecture can also control transcription by promoting or restricting physical proximity between distal control DNA elements. As such, long-range contacts can correlate with either activation or repression of transcription [10-12]. For example, transcription activation at theβ-globin locus as-sociates with physical contacts between the locus control region (LCR) and actively transcribed genes [13]. Con-versely, insulator (CTCF)-mediated loops differentially compartmentalize inactive genes away from enhancers at
the apolipoprotein locus [14]. The relationship between architecture and expression is also well illustrated by the inactivation of one X chromosome in the nuclei of female mammalian cells [15], where epigenetic silencing leads to a condensed chromatin structure with silent genes at the core and expressed ones looped out [16].
Given the relationship between genome architecture and activity, it is not surprising that human disease can some-times be attributed to defects in genome organization. Compelling evidence for the role of three-dimensional (3D) chromatin organization in human disease comes from studies on laminopathies like the Emery-Dreifuss muscular dystrophy. It was shown that this disease could originate from mutations in a lamin protein that specifically causes abnormal retention and silencing of muscle-specific genes at the nuclear envelope [17]. The importance of spatial genome organization in human disease is equally well demonstrated in cancers where single nucleotide polymor-phisms (SNPs) were found to create novel enhancers acting long-range to activate distal genes through DNA looping [18-20].
Overall, genome architecture is guided by chromatin interactions with nuclear landmarks like the lamina, and by intra- and inter-chromosomal contacts mediated by chromatin-binding proteins. In addition to transcription * Correspondence:[email protected];[email protected]
†Equal contributors
2McGill Centre for Bioinformatics and School of Computer Science, McGill
University, Montréal, Québec H3G 0B1, Canada
1Department of Biochemistry and Goodman Cancer Research Center, McGill
University, Montréal, Québec H3G 1Y6, Canada
factors that form DNA loops between enhancers and promoters, proteins like CTCF, SATB1, and the Cohesin complex are thought to be master regulators of genome organization. Protein complexes such as those contain-ing Polycomb group proteins or the mixed lineage leukemia (MLL) protein might be equally important in shaping the human genome [21-23]. MLL is an H3K4 methyltransferase that is present in COMPASS-like (complex of proteins associated with Set1) complexes [24]. These multi-subunit complexes are very large, and activate transcription partly by methylating H3 on Lys 4. COMPASS-like complexes control the expression of many genes with pivotal roles in development and differ-entiation including homeobox family members like the HOXgenes.
The MLL gene is a common target in non-random chromosomal translocations associated with both acute lymphoblastic (ALL) and acute myeloid (AML) leukemia, with over 50 different translocation partners identified so far [25-27]. These translocations result in the production of gain-of-function chimeras composed of an amino-terminus MLL lacking the SET domain fused in frame with another protein coding gene. In all cases, the result-ing MLL fusion oncoprotein acts as a strong transcrip-tional activator that disrupts the normal hematopoietic differentiation program by inducing the aberrant expres-sion of key regulators including HOX family members [28]. In fact, dysregulation ofHOXgenes was reported to be a dominant mechanism of leukemic transformation by MLL fusions [29].
The mechanisms by which different MLL fusions acti-vate transcription or lead to either AML or ALL are poorly understood. However, the observation that many translocation partners are elongation factors that co-exist in a super elongation complex (SEC) with the fusion pro-teins suggests that they can activate transcription at the elongation step [30]. Interestingly, many fusion partners of MLL bind each other to form transcription foci visible by microscopy. Since the expression of MLL chimeras can alter their localization and activity, these findings suggest that MLL fusions might alter chromatin organization [22,31,32]. Also, given that the epigenetic state of chroma-tin and its conformation are thought to mutually affect each other in self-enforcing structure-function feedback loops [33], it seems likely that MLL fusions additionally alter chromatin organization by modifying its epige-nomic profile.
In infants, MLL is translocated in over 50% of acute leu-kemias [34,35], whereas translocations in adults are most often seen in patients having undergone chemotherapy [36]. In general, the prognosis of AML patients expressing MLL fusions is poor [37], and new classification methods could help identify optimal treatment courses. We previ-ously reported that terminal differentiation of the AML
THP-1 cell line into macrophages is accompanied by tran-scriptional repression and spatial remodeling of theHOXA gene cluster [38]. From these results, we wondered whether chromatin architecture, which in essence reflects genome activity, could be used to classify leukemia types. Here we present a study that provides a proof of concept that chromatin conformation can be used to classify leu-kemias. We found that when the highly relevant HOXA region is considered, chromatin architecture has the infor-mation value to distinguish between leukemia types and subtypes.
Results and discussion
TheHOXAgene cluster as a test locus
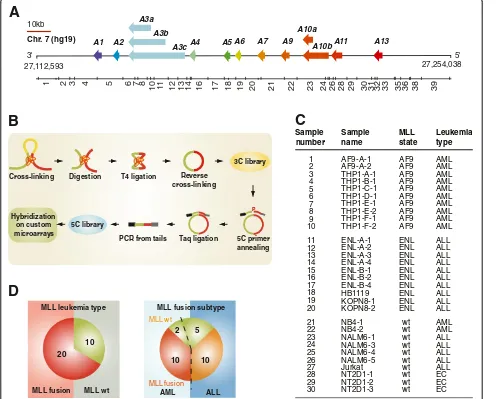
TheHOXclusters encode transcription factors that are im-portant for embryonic development and hematopoietic lineage regulation [39,40]. Aberrant HOX expression is found in various types of human cancers including lung cancer [41], breast cancer [42], melanoma [43], and leukemia [44].HOXA9 and10for instance are oncogenes overexpressed in various leukemia types and are direct tar-gets of MLL fusion oncoproteins [45-47]. In mammals, there are 39 HOX genes organized into 13 paralogue groups and divided into four clusters named A,B,C, and Dlocated on different chromosomes [48,49]. The human HOXAcluster spans over 100 kbp on chromosome 7 and encodes 11 transcription factors (Figure 1A). To determine whether chromatin architecture can be used to classify dis-ease, we mapped the organization of a region containing the HOXA cluster with the chromosome conformation capture carbon copy (5C) technology (Figure 1B). The 5C method is a member of the so-called‘3C technologies’ used to measure genome organization in vivo at high-resolution [50,51]. 5C captures chromatin conformation by converting chemically cross-linked chromatin segments into unique ligation products, which are then detected high-throughput using a modified version of ligation medi-ated amplification (LMA).
in Additional file 3: Figure S1. The 5C datasets are pre-sented in heatmap form in Additional file 4: Figures S2, and show a very high degree of variability between all samples, regardless of whether they express MLL fusions, the wt protein are AML or ALL. When comparing the average HOXA interaction frequencies (IFs) in leukemia samples expressing MLL fusions to those encoding onlywt MLL, we could find marked differences in contact frequen-cies between neighbors (heatmap diagonal) and between
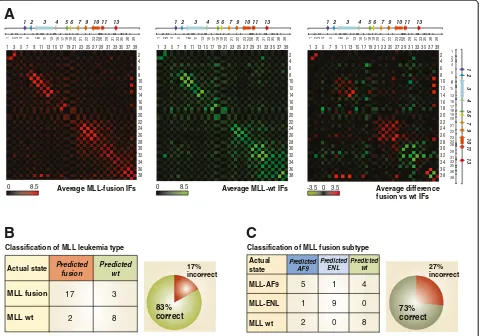
distal fragments interacting long-range (Figure 2A). For example, we observed higher local contacts around the HOXA3 gene in MLL fusion samples, and more long-range interactions between the 5’end, the middle and the 3’ end of the cluster in samples where only the wtMLL protein is expressed (Figure 2A, right). These results indi-cate that theHOXA chromatin conformation in leukemia cell lines expressing MLL fusions and MLLwtmight differ sufficiently to be used for classification.
A
27,112,593 27,254,038
10kb
Chr. 7 (hg19)
3' 5'
A1 A2 A4 A5 A6 A7 A9
A10bA11 A13
A10a
A3c A3b A3a
3C library
Cross-linking Digestion T4 ligation Reverse cross-linking
Taq ligation
PCR from tails 5C primer annealing
P
Hybridization on custom microarrays
5C library
B
4 5 6 7 8
10 11 12 13 14 16 17 18 19 20 21 22 23 24 26 28 29 30 31 32 33
3
2
1
35 36 38 39
MLL fusion MLL wt AML ALL
D
C
MLL wt
MLL fusion
Sample number
Sample name
MLL state
Leukemia type
1 AF9-A-1 AF9 AML
2 AF9-A-2 AF9 AML
3 THP1-A-1 AF9 AML
4 THP1-B-1 AF9 AML
5 6
THP1-C-1 AF9 AML
7
THP1-D-1 AF9 AML
8
THP1-E-1 AF9 AML
9
THP1-E-2 AF9 AML
10
THP1-F-1 AF9 AML
THP1-F-2 AF9 AML
11 ENL-A-1 ENL ALL
13 ENL-A-2 ENL ALL
14
ENL-A-3 ENL ALL
15 ENL-A-4 ENL ALL
16 ENL-B-1 ENL ALL
17 ENL-B-2 ENL ALL
18
21
ENL-B-4 ENL ALL
22
HB1119 ENL ALL
23
NB4-1 wt AML
24
NB4-2 wt AML
25
NALM6-1 wt ALL
26
NALM6-3 wt ALL
28
NALM6-4 wt ALL
29
NALM6-5 wt ALL
30
NT2D1-1 wt EC
NT2D1-2 wt EC
NT2D1-3 wt EC
12
10 20
19
20 KOPN8-1KOPN8-2 ENLENL ALLALL
27 Jurkat wt ALL
2 5
10 10
[image:3.595.56.554.92.491.2]MLL leukemia type MLL fusion subtype
Figure 1Experimental design used to generate the training set for 3D-SP. (A)Linear schematic representation of the humanHOXAcluster
region characterized in this study. Genes are illustrated as left-facing arrows to indicate transcription direction and highlight the 3’to 5’end orientation of the cluster. The 11 paralogue groups are color-coded and identified above each gene.BglII restriction fragments of theHOXA
region characterized here are shown below and identified by numbers from left to right.(B)Diagram of the 5C technology. 5C quantitatively measures chromatin contacts using primers that are complementary to predicted junctions in 3C libraries. Annealed 5C primers are ligated with Taq DNA ligase and products are amplified by PCR using oligos recognizing the universal tails of 5C primers. In this study, amplification was done using a fluorescently labeled reverse PCR primer and amplified 5C libraries were hybridized onto custom microarrays.(C)Leukemia cell panel used to train 3D-SP. Cell lines are organized by leukemia type and MLL status. AF9; AF9 gene (ALL1-fused gene from chromosome 9), ENL; ENL gene (eleven-nineteen-leukemia), wt; wild type, AML; acute myeloid leukemia, ALL; acute lymphoblastic leukemia, EC; embryonic carcinoma.
Development, training, and performance of 3D-SP
Although significant differences could be observed be-tween averaged IFs, this type of ‘direct’measurement does not reliably identify contacts that most consistently de-scribe a particular leukemia type and that could be used for classification. Indeed, average or greater IFs in a given sample set might simply originate from the presence of a few samples where these contacts are high. To more ro-bustly distinguish between leukemia types, we developed a support vector machine (SVM; [53]) classifier called‘ 3D-SP’ (3-Dimensional DNA Disease-Signature Predictor), which uses the complete IF data from a 5C experiment as basis for classification. We opted for an SVM since they were previously shown to yield good accuracy classifiers even for high-dimensional data [54].
3D-SP was evaluated using leave-one-out cross-validation on the setSof 30 samples shown in Figure 1C. Specifically, for each sample s inS, a classifier was trained on the 29 remaining samples (S - {s}) and then used to predict the class of s. The result of this cross-validation procedure is then reported as one entry in the confusion matrix shown in Figure 2B. This ensures that no predictor was trained using the sample on which it is asked to make a prediction. Using this approach, we found that leukemia samples expressing either MLL fusions or the wtprotein could be classified with 83% accuracy by 3D-SP (Figure 2B). Training 3D-SP to recognize features specific to MLL fusion subtypes also yielded good classification results by leave-one-out cross-validation albeit with a lower ac-curacy of 73% (Figure 2C). These results demonstrate Classification of MLL leukemia type
Actual state Predicted
fusion
Predicted wt
MLL fusion 17 3
MLL wt 2 8
Classification of MLL fusion subtype
B
C
27% incorrect Predicted AF9 Predicted ENL Predicted wt Actual state MLL-AF9 MLL-ENL MLL wt 5 1 1 9 4 02 0 8
73% correct 83% correct 17% incorrect
A
1 3 5 7 9 11 13 15 17 19 21 23 25 27 29 31 33 35 37 39 2 4 6 8 10 12 14 16 18 20 22 24 26 28 30 32 34 36 38
Average MLL-fusion IFs 0 8.5
1 2 3 4 5 6 7 9 10 11 13
4 5 7 8 11 13 16 17 18 19 20 21 22 23 2426 29 31 33
3
2
1
35 38 39
0 3.5 -3.5 1 3 5 7 9 11 13 15 17 19 21 23 25 27 29 31 33 35 37 39
2 4 6 8 10 12 14 16 18 20 22 24 26 28 30 32 34 36 38
Average MLL-wt IFs 0 8.5
1 3 5 7 9 11 13 15 17 19 21 23 25 27 29 31 33 35 37 39 2 4 6 8 10 12 14 16 18 20 22 24 26 28 30 32 34 36 38 Average difference fusion vs wt IFs
1 2 3 4 5 6 7 9 10 11 13
4 5 7 8 11 13 16 17 18 1920 21 22 23 2426 29 31 33
3
2
1
35 38 39
1 2 3 4 5 6 7 9 10 11 13
4 5 7 8 11 13 16 17 18 1920 21 22 23 24 26 29 31 33
3
2
1
35 38 39
[image:4.595.60.540.90.426.2]12 4 5 6 7 9 10 11 13 3 4 5 7 8 11 13 16 17 18 19 20 21 22 23 24 26 29 31 33 3 2 1 35 38 39
Figure 2TheHOXAcluster conformation can be used to classify leukemia cell samples. (A)Averaged 5C interaction frequencies from
that theHOXAcluster organization can be used to clas-sify different leukemia types.
Identifying highly predictive chromatin contacts
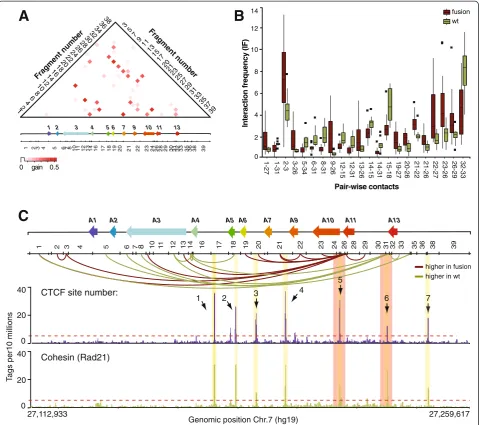
We next wondered which HOXA contacts showed the greatest difference between classes and conferred the lar-gest amount of predictive power in the classification of leu-kemias expressing either MLL fusions or thewtprotein. By measuring the information gain score of each pair-wise interaction, we found that over 20 different contacts con-tributed information that enhanced the classification per-formance (Figure 3A; Student t-test P value <0.01). The information gain estimates the reduction of entropy in the classification achieved by each contact, and can therefore be used to identify discriminatory interactions. As ex-pected, there were much fewer contacts than those display-ing large averaged IFs differences (compare Figures 2A and 3A). For instance, the predictor did not retain most neigh-boring interactions, which were strong IF values that dif-fered greatly between leukemia sets.
Interestingly, we observed a significant difference be-tween the average IF values of informative contacts in leukemias expressing MLL fusions compared to the wt protein (Figure 3B). Specifically, we found that a region downstream ofHOXA13at the cluster 5’end preferentially interacts with its 3’ part in wt MLL samples (Figure 3C, fragments 31 to 35). In contrast, more contacts were ob-served between theHOXA11gene (fragments 26 and 27) and the cluster, suggesting that these two regions are differ-entially regulated in leukemias expressing MLL fusions. This result was interesting in light of our previous report that differentiation of THP-1 promyelomonocytic leukemia cells into macrophages is accompanied by transcription re-pression of 5’end genes and the formation of long-range contacts between the ends of the cluster [38]. Given that MLL fusions appear to alter organization, perhaps by modifying the chromatin at specific regions along the cluster, this result might also provide insight on how the fusions activate transcription. Whether DNA se-quences at the HOXA11 andHOXA13 regions are im-portant for the observed conformational changes is unclear but mapping of CTCF and cohesin by ChIP-seq shows that the two proteins bind to these regions (Figure 3C, bottom). CTCF and cohesin are known to form long-range interactions and it will be interesting to see whether their association with the chromatin or binding to each other to form loops are specifically targeted by MLL fusions.
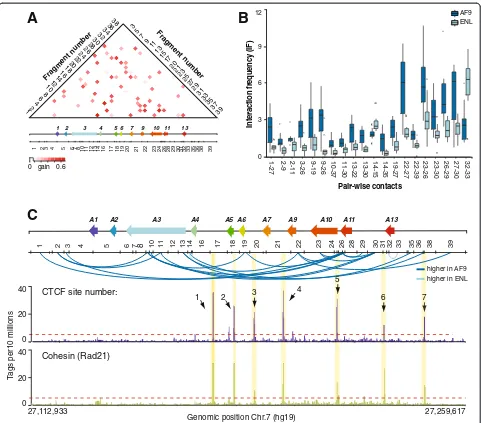
In a similar manner, we looked for HOXA contacts showing the greatest informative differences between the MLL fusion subtype classes (Figure 4). For this, we mea-sured the information gain value of each feature for the subtype prediction task and found 20 contacts with sig-nificant predictive value (Student t-test P value <0.01)
(Figure 4A). In contrast to the predictive features of MLL leukemia types, the contacts distinguishing MLL-ENL from MLL-AF9 leukemias were distributed throughout the cluster (Figure 4B,C) and did not particularly cluster at sites bound by CTCF and cohesin. These were generally stronger in MLL-AF9 samples, except for 14-15 and 32-33 that were also identified as good predictors of wt MLL samples. We do not think that stronger contacts in MLL-AF9 can be explained simply by more expression of the cluster in either of the sample sets since each featured high and low expressers (Additional file 2: Table S1). Also, transcriptional activity does not appear to be a defining parameter in classification (see below and Additional file 5: Figure S4). Thus, we favor a model whereby different MLL fusions lead to distinct chromatin conformations by specifically recruiting proteins and modifying the chroma-tin at the cluster.
De novoclassification of MLL leukemia samples with 3D-SP
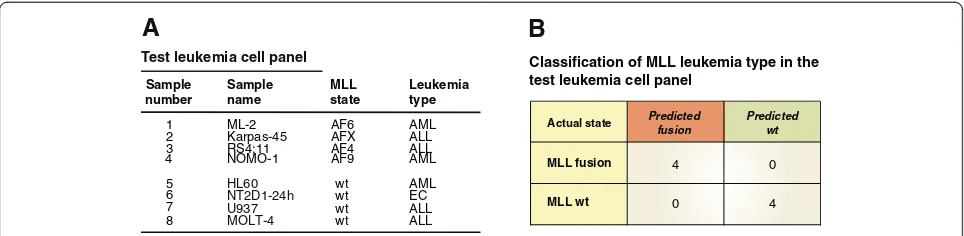
All the analyses with 3D-SP presented above were per-formed using a leave-one-out cross-validation approach and we wanted to confirm that the classifier would generalize to new samples. To this end, we generated 5C interaction maps for a test leukemia cell panel (Figure 5A and Additional file 6: Figure S3), and used the 3D-SP previously trained to distinguish between MLL wt and fusions with the training set (Figure 1C) to classify these data. The test leukemia set included leukemia cell lines expressing MLL-AF6, MLL-AFX, and MLL-AF4 and a new cell line expressing the MLL-AF9 fusion. Cell lines encodingwt MLL included AML, ALL, and the EC cell line NT2D1 induced with retinoic acid for 24 h. We added this sample because although it does not express an MLL fusion, the 3’ end genes are expressed and we expect the cluster to adopt an open configuration [52]. We found that 3D-SP classified the test leukemia cell lines expressing MLL fusions orwtMLL with perfect ac-curacy. Furthermore, 3D-SP also correctly classified five biological replicates of the MLL-AF9 expressing THP-1 samples produced in another study [55]. Even the EC sample expressing 3’ end HOXA genes was correctly classified suggesting transcription and opening of the cluster were not determining parameters in the classifi-cation by 3D-SP.
(48%), all HOXA gene expression (62%) or on the 5C data (93%; Additional file 5: Figure S4B and C). Predic-tion based on gene expression was improved when a decision tree classifier was used instead of an SVM (HOXA9; 86%, all HOXA; 83%) but remained slightly lower than 5C classification with an SVM (Additional file 5: Figure S4D). Although our data do not definitively
show that chromatin conformation is more robust than gene expression, 5C data do appear to contain additional information not present in gene expression datasets that improve classification. Together, these results provide the very first proof of principle that 3D chromatin organization of theHOXAcluster can be used to classify MLL fusion leukemia cell types.
40
20
0
40
20
0
T
ags per10 millions
27,112,933 27,259,617
1 7
4
2 3
CTCF site number:
Cohesin (Rad21)
Genomic position Chr.7 (hg19)
A
B
A1 A2 A3 A4 A5 A6 A7 A9 A10 A11 A13
4 5 6 7 8 10 11 12 13 14 16 17 18 19 20 21 22 23 24 26 28 29 30 31 32 33
3
2
1 35 36 38 39
12 46
8 1012
1416 1820
2224 2628
3032 3436
38
Fragment number
39 37 35 33 31 29 27 25 23 21 20 17 15 13 11 9 7 5 3
Fragment number
0 2 10
Interaction frequency (IF)
fusion wt
1 2 3 4 5 6 7 9 10 11 13
4 5 6 7 8 10 11 12 13 14 16 17 18 19 20 21 22 23 24 26 28 29 30 31 32 33
3
2
1 35 36 38 39
0 gain 0.5
14
Pair-wise contacts
1-27 1-31 2-3 3-26 5-34 6-31 8-31 9-26 12-15 12-31 13-26 14-15 14-31 15-18 19-27 20-26 21-22 21-26 22-27 23-26 26-29 32-33
4 6 8 12
C
5
6
[image:6.595.59.539.89.514.2]higher in fusion higher in wt
Figure 3Distinct contact patterns identify MLL fusion fromwtMLL leukemias. (A)Heatmap representation of the information gain scores
of contacts throughout theHOXAcluster. The values are color-coded according to the scale shown at the bottom of the heatmap. Numbers on the left and right of heatmap identifyBglII restriction fragments corresponding to the restriction pattern shown below theHOXAdiagram. Intersecting column and row numbers identify DNA contacts.(B)Averaged interaction frequencies of 22 contacts with high information gain scores (IF values between MLL fusions andwtMLL are statistically different,P<0.01). Interaction frequencies in MLL fusion datasets are the averaged values from Additional file 4: Figure S2A, andwtMLL values are from Additional file 4: Figure S2B. Error bars represent the standard error of the mean.(C)Distribution of informative contacts for classification, and binding of CTCF and cohesin in THP-1 cells along the humanHOXA
Conclusions
3D chromatin organization represents a type of higher-order transcription regulation mechanism used to con-trol gene expression in a tissue-specific manner. Here, we provide evidence that chromatin conformation can be used to classify leukemia samples. We found that contacts from at least two regions along theHOXA clus-ter significantly contribute to the classification. The first region localizes at the 3’ end of theHOXA11 gene and
forms more contacts with the cluster when MLL fusions are expressed, while the second region lies downstream of theHOXA13gene and forms more contacts with the cluster in samples encoding thewtprotein. These results suggest that these two regions are differently regulated in leukemias expressing MLL fusions, and one would ex-pect that proteins interacting with one or more of these sequences would be responsible for these interactions. As described in the results section and discussed further 40
20
0
40
20
0
T
ags per10 millions
27,112,933 27,259,617
1 7
4
2 3
CTCF site number:
Cohesin (Rad21)
Genomic position Chr.7 (hg19)
5
6
A
B
A1 A2 A3 A4 A5 A6 A7 A9 A10 A11 A13
4 5 6 7 8 10 11 12 13 14 16 17 18 19 20 21 22 23 24 26 28 29 30 31 32 33
3
2
1 35 36 38 39
12 46
8 1012
1416 1820
2224 2628
3032 3436
38
Fragment number
39 37 35 33 31 29 27 25 23 21 20 17 15 13 11 9 7 5
3 Fragment number
0 9
Interaction frequency (IF)
AF9 ENL
1 2 3 4 5 6 7 9 10 11 13
4 5 6 7 8 10 11 12 13 14 16 17 18 19 20 21 22 23 24 26 28 29 30 31 32 33
3
2
1 35 36 38 39
0 gain 0.6
12
Pair-wise contacts
1-27 2-9 2-11 3-26 9-19 9-26 10-37 11-30 13-22 13-30 14-15 14-35 19-27 22-27 22-39 23-26 23-30 26-29 27-30 32-33
3 6
higher in AF9 higher in ENL
[image:7.595.58.539.87.510.2]C
Figure 4Contacts throughout theHOXAcluster distinguish fusion subtypes. (A)The information gain scores ofHOXAcontacts distinguishing
MLL-AF9 from MLL-ENL leukemias are represented in heatmap form. The values are color-coded according to the scale shown at the bottom of the heatmap. Numbers on the left and right of heatmap identifyBglII restriction fragments corresponding to the restriction pattern shown below theHOXA
below, we examined the changes in transcription among the various leukemias in our study, and found that they do not explain the differences in 5C. Interestingly how-ever, we found that CTCF and cohesin are present at these interacting sites at least in the THP-1 cell line ex-pressing MLL-AF9. CTCF and cohesin are known chro-matin organizers [56] and it will be interesting to see whether differences in CTCF or cohesin binding at these sites play a role in the classification.
In the current model of genome structure-function, chromatin conformation and its molecular composition are thought to mutually affect each other to reach and propagate a given activity [33]. One argument, which could arise, therefore is that chromatin conformation ac-curately classifies leukemia samples because it reflects differences in transcription. However, comparison be-tween classification with chromatin conformation and with gene expression suggests that at least in the case of MLL-fusion derived leukemias, the information provided by the chromatin organization does not simply reflect its transcriptional state. For example, samples that express high levels of 5’ end HOXA genes might all classify to-gether because chromatin is likely to be more open in that part of the cluster. We show that this is not the case first by demonstrating that cell samples expressing dif-ferent levels of HOXA genes classify properly in the same groups, and secondly, by demonstrating that classifi-cation is at least comparable or better with chromatin conformation than gene expression. What the classifica-tion results suggest is that as a chromatin modifier, the MLL wt and MLL fusion proteins differently affect the molecular composition and conformation of the chroma-tin in a manner that is at least partly independent of its effect on transcription activity. In turn, our results show that chromatin organization is not merely tissue-specific but can also differ when different diseases affect a given cell type. Long-range transcription regulation might therefore be specifically altered in human diseases, and sometimes even significantly contribute to pathologies.
In the future, it will be interesting to determine whether expanding the 5C analysis to other MLL fusion target domains can predict leukemia types and subtypes with near-perfect accuracy. Identifying the type and sub-type of the leukemia is the most important factor in de-fining a treatment course, and for this reason it will also be interesting to see whether chromatin conformation can accurately classify samples collected from the blood of patients, and predict overall survival. With the con-stant improvement of deep sequencing methods and of protocols capturing genome organization [57,58], identi-fying bona fide chromatin conformation signatures use-ful in the clinic is becoming increasingly feasible. The clinical importance of biomarkers for diagnosis, therapy selection, and for screening and monitoring disease pro-gression is already appreciated in the treatment of many cancer types [59]. The identification of robust bio-markers will be important in directing patient care to-wards a customized setting and will require a greater overall understanding of genome regulation including how it is organized in the nuclear space.
Materials and methods
Ethical approval
No ethical approval was needed for this study.
Cell culture and description of the 5C datasets
All experiments presented in this study were performed using actively growing cells (log-phase) as defined by growth curves. All cells were grown at 37°C in 5% CO2
at-mosphere. A complete description of all the cell samples can be found in Additional file 1: Supplementary Materials and methods. The normalized 5C data in matrix format are found in Additional file 7.
Quantitative real-time polymerase chain reaction (RT-qPCR)
HOXA gene expression was measured by quantitative real-time polymerase chain reaction and is shown rela-tive to actin. The RNeasy© Mini kit (Qiagen) was used
A
Sample number
Sample name
MLL state
Leukemia type
1 ML-2 AF6 AML
2 Karpas-45 AFX ALL
3 RS4;11 AF4 ALL
HL60 wt AML
U937
wt EC
wt ALL
MOLT-4 wt ALL
B
NT2D1-24h
4
Classification of MLL leukemia type in the test leukemia cell panel
NOMO-1 AF9 AML
5 6 7 8
Test leukemia cell panel
Actual state Predicted
fusion
Predicted wt
MLL fusion 4 0
[image:8.595.57.539.89.207.2]MLL wt 0 4
Figure 53D-SP correctly classifies MLL leukemia typesde novo. (A)Leukemia cell panel used to test 3D-SP. Cell lines are organized by MLL
status and leukemia type.(B)Classification results of the test leukemia cell panel by the 3D-SP trained to distinguish between MLL fusion andwt
to extract total RNA from the samples as described by the manufacturer. The samples were then treated with DNAseI (NEB), and re-purified on Qiagen columns. Two micrograms of the resulting total RNA was used in each reverse transcription reaction with the Superscript® III reverse transcriptase kit (Invitrogen™) and oligo (dT)20.
The SsoFast™EvaGreen© Supermix (Bio-Rad) was used to quantify the samples by RT-qPCR with a Bio-Rad CFX96™ (C1000™series) real-time system. Quantification was per-formed by two-fold serial dilutions of total cDNA. The size and specificity of amplified products was verified on agarose gels containing 0.5μg/mL ethidium bromide and/ or by verifying the melting temperatures of PCR ampli-cons. An AlphaImager© HP coupled to a 12-bit digital camera and equipped with the AlphaView® image acquisi-tion and analysis software (version 3.0; Alpha Innotech Corporation) was used to document and analyze the gels. All RT-qPCR primer sequences used in this study were previously described [38], and their sequences are also available on our website [60].
Chromosome conformation capture (3C) and 3C-carbon copy (5C)
The chromosome conformation capture (3C) and 3C-carbon copy (5C) techniques were used as previously de-scribed to characterize the chromatin organization of a region containing theHOXAgene cluster [38,51]. The ex-perimental design and the procedure used to generate our 3C and 5C datasets are described in detail in Additional file 1: Supplementary Materials and methods.
Interaction frequency (IF) normalization
We modified the previously published approach to nor-malize interaction frequency data [51] to account for the amount of DNA hybridized onto arrays (hybridization effi-ciency) and improve correction for primer pair efficien-cies. This approach is described in detail in Additional file 1: Supplementary Materials and methods, and is illus-trated in Additional file 3: Figure S1.
Support vector machine implementation
A support vector machine (SVM) classifier [53] was imple-mented using the open-source Weka Java package [61,62]. The SVM hyperparameters (notably the soft margin pen-alty and the RBF width) were fixed for all experiments and the SVM used a polynomial kernel (K (x, y) = < x, y >p) and was trained using sequential optimization minimi-zation, with 1-vs-1 pairwise classification for multi-class problems [63,64]. Each 5C dataset was represented as a single vector of normalized IF values obtained by measur-ing pairwise chromatin interactions in vivo. The SVM was trained and evaluated using a leave-one-out cross-validation approach to obtain a classifier with a maximum-margin hyperplane in the transformed feature space. The
predictive power of individual features was evaluated using the information gain score (also computed using Weka), which measures the reduction of the entropy of the class distribution when the feature is considered. Contacts with large information gains confer the highest amount of pre-dictive power. Informative contacts were selected by deter-mining if the IF values were statistically different between sample types. This was done by calculatingPvalues using a two-sided Student’s t-Test in R [65]. The two samples (MLL fusionsvs. wt, or MLL-AF9vs.MLL-ENL) t-test was performed for each feature independently, and features that were retained had reportedPvalues below a threshold of 0.01 (P<0.01).
The Matthews Correlation Coefficient (MCC) was cal-culated as a measure of the quality of the classifications performed by the SVM, with values close to +1 indicating perfect prediction, values close to 0 indicating random prediction, and values close to -1 indicating complete disagreement between the prediction and the observa-tion. The MCC statistic was calculated from the confu-sion matrix as:
MCC¼ ððTP x TNÞ−ðFP x FNÞÞ
sqrt TPðð þFPÞ ðTPþFNÞ ðTNþFPÞ ðTNþFNÞÞ
where TP:True Positives;TN:True Negatives;FP:False Positives; FN:False Negatives
ChIP-seq
Chromatin immunoprecipitation was conducted as de-scribed previously [55] with 5 μL of antibodies against CTCF (Millipore, cat. no. 07–729) or Rad21 (Abcam, cat. no. ab992). For Rad21 samples, the BARCODE adaptors were used for generating the BARCODE ChIP-seq libraries (BARCODE adaptor [66]). ChIP-ChIP-seq librar-ies were sequenced with an Illumina Genome Analyzer (GAiiX) DNA sequencer (36 bps reads, CTCF and WCE) and Illumina Hiseq2000 (51 bps reads, Rad21) at the Génome Québec Innovation Centre [67].
ChIP-seq data analysis
reads. The CTCF or Rad21 binding regions with two-fold (CTCF) or four two-fold (Rad21) over in both control (whole cell extract) and local region (10 kbp) were iden-tified by HOMER program (FDR <0.001 (‘findpeak’ com-mand)). The data was visualized in the hg19 genome version on the UCSC browser.
Databases and URLs
The data and source code of our software are available through our website with instructions at the following address: [71]. The source code of our software is also at-tached to this manuscript for archival purpose only (Additional file 8). The 5C and ChIP-seq data for CTCF and Rad21 can be downloaded from the Gene Expres-sion Omnibus (GEO) website [72].
Additional files
Additional file 1:Supplementary Materials and methods,
Supplementary Figure legends, and Supplementary References.The Supplementary Materials and methods contain a detailed description of the cell lines analyzed in this study. It also describes the 3C and 5C protocols used to capture chromatin organization, and the computational approach developed to calculate normalized interaction frequencies (IFs). This file also contains the figure legends for (Additional file 3: Figures S1, Additional file 4: Figures S2, Additional file 5: Figures S4, and Additional file 6: Figures S3 respectively), as well as References relevant to Additional file 1.
Additional file 2: Table S1.HOXAgene expression in leukemia cell
samples used in this study. This table contains the mRNA quantification of allHOXAgenes by RT-qPCR in cell lines used to compare classification by gene expression and chromatin conformation (Additional file 5: Figure S4).
Additional file 3: Figure S1.Workflow of 5C data processing,
normalization, and conversion into interaction frequencies. This figure illustrates our approach to calculate normalized IFs from 5C data. This method and Additional file 3: Figure S1 are described in detail in (Additional file 1: Supplementary Materials and methods and Additional file 3: Figure S1).
Additional file 4: Figure S2.5C datasets generated for the 3D-SP
training set. This figure shows the 5C data of the cell samples from the training set in the form of heatmaps as described in Additional file 4: Figure S2 (Additional file 1).
Additional file 5: Figure S4.3D-SP performs better than gene
expression to classify MLL leukemia types. This figure compares classification of leukemia cell samples usingHOXAgene expression and
HOXAchromatin organization. The figure is described in the Additional file 5: Figure S4 in Additional file 1.
Additional file 6: Figure S3.5C datasets generated for the 3D-SP test set.
This figure shows the 5C data of the cell samples from the test set in the form of heatmaps as described in Additional file 6: Figure S3 (Additional file 1).
Additional file 7:This file contains the normalized 5C data in
matrix format of all the samples produced for this study.These files can be uploaded directly in the my5C platform (http://my5c.umassmed. edu/welcome/welcome.php) [73].
Additional file 8:This file contains the source code for all the
software used in this study.
Abbreviations
3C:Chromosome conformation capture; 5C: 3C-carbon-copy; SVM: Support vector machine.
Competing interests
The authors declare that they have no competing interests.
Authors’contributions
MR designed, developed, and carried out the computational analysis, and helped to draft the manuscript. MAF participated in designing the 5C experiments, produced part of the 5C datasets, and participated in the mRNA quantification by real-time quantitative PCR. JC carried out part of the 5C experiments, participated in the quantification of mRNAs by real-time quantitative PCR, and helped to draft the manuscript. XQDW participated in generating part of the 5C experiments, and in the quantification of mRNAs by real-time quantitative PCR. HM performed the ChIP-seq experiments and their analysis. MB participated in the design and coordination of the study, and helped to draft the manuscript. JD conceived the study, participated in its design and coordination, and drafted the manuscript. All authors read and approved the final manuscript.
Acknowledgements
We thank Denis Paquette for excellent technical assistance and members of our laboratories for insightful discussions. This work was supported by grants from the Canadian Institutes of Health Research (CIHR MOP-86716), the Terry Fox Foundation (grant #19252), and an innovation grant from the Canadian Cancer Society (CCS; grant #701356) to JD, and by a National Sciences and Engineering Research Council (NSERC) Discovery grant to MB. MR was supported by a scholarship from NSERC. MAF was supported by a fellowship from the CCS. XQDW was supported by a scholarship from the Cole Foundation. Funding for open access charge: CCS grant #701356. JD is a CIHR New Investigator and FRSQ Research Scholar (Fonds de la Recherche en Santé du Québec).
Received: 1 February 2014 Accepted: 30 April 2014 Published: 30 April 2014
References
1. Dostie J, Bickmore WA:Chromosome organization in the nucleus -charting new territory across the Hi-Cs.Curr Opin Genet Dev2012,
22:125–131.
2. Fraser P, Bickmore W:Nuclear organization of the genome and the potential for gene regulation.Nature2007,447:413–417.
3. Babu MM, Janga SC, de Santiago I, Pombo A:Eukaryotic gene regulation in three dimensions and its impact on genome evolution.Curr Opin Genet Dev2008,18:571–582.
4. Cook PR:A model for all genomes: the role of transcription factories. J Mol Biol2009,395:1–10.
5. Pombo A, Branco MR:Functional organisation of the genome during interphase.Curr Opin Genet Dev2007,17:451–455.
6. Cremer T, Cremer M:Chromosome territories.Cold Spring Harb Perspect Biol2010,2:a003889.
7. Eskiw CH, Cope NF, Clay I, Schoenfelder S, Nagano T, Fraser P:Transcription factories and nuclear organization of the genome.Cold Spring Harb Symp Quant Biol2010,75:501–506.
8. Razin SV, Gavrilov AA, Pichugin A, Lipinski M, Iarovaia OV, Vassetzky YS:
Transcription factories in the context of the nuclear and genome organization.Nucleic Acids Res2011, doi:10.1093/nar/gkr683.
9. Li G, Reinberg D:Chromatin higher-order structures and gene regulation. Curr Opin Genet Dev2011,21:175–186.
10. West AG, Fraser P:Remote control of gene transcription.Hum Mol Genet
2005,14:R101–R111.
11. Woodcock CL:Chromatin architecture.Curr Opin Struct Biol2006,16:213–220. 12. Gondor A, Ohlsson R:Chromosome crosstalk in three dimensions.Nature
2009,461:212–217.
13. Tolhuis B, Palstra RJ, Splinter E-g, Grosveld F, de Laat W:Looping and interaction between hypersensitive sites in the active beta-globin locus. Mol Cell2002,10:1453–1465.
14. Mishiro T, Ishihara K, Hino S, Tsutsumi S, Aburatani H, Shirahige K, Kinoshita Y, Nakao M:Architectural roles of multiple chromatin insulators at the human apolipoprotein gene cluster.EMBO J2009,28:1234–1245. 15. Morey C, Avner P:The demoiselle of X-inactivation: 50 years old and as
trendy and mesmerising as ever.PLoS Genet2011,7:e1002212. 16. Chaumeil J, Le Baccon P, Wutz A, Heard E:A novel role for Xist RNA in the
formation of a repressive nuclear compartment into which genes are recruited when silenced.Genes Dev2006,20:2223–2237.
lamin blocks muscle-specific gene relocation and compromises muscle integrity.Curr Biol2011,21:1603–1614.
18. Pomerantz MM, Ahmadiyeh N, Jia L, Herman P, Verzi MP, Doddapaneni H, Beckwith CA, Chan JA, Hills A, Davis M, Yao K, Kehoe SM, Lenz HJ, Haiman CA, Yan C, Henderson BE, Frenkel B, Barretina J, Bass A, Tabernero J, Baselga J, Regan MM, Manak JR, Shivdasani R, Coetzee GA, Freedman ML:The 8q24 cancer risk variant rs6983267 shows long-range interaction with MYC in colorectal cancer.Nat Genet2009,41:882–884.
19. Pittman AM, Naranjo S, Jalava SE, Twiss P, Ma Y, Olver B, Lloyd A, Vijayakrishnan J, Qureshi M, Broderick P, van Wezel T, Morreau H, Tuupanen S, Aaltonen LA, Alonso ME, Manzanares M, Gavilan A, Visakorpi T, Gomez-Skarmeta JL, Houlston RS:Allelic variation at the 8q23.3 colorectal cancer risk locus functions as a cis-acting regulator of EIF3H.PLoS Genet2010,6:e1001126.
20. Meyer KB, Maia AT, O'Reilly M, Ghoussaini M, Prathalingam R, Porter-Gill P, Ambs S, Prokunina-Olsson L, Carroll J, Ponder BA:A functional variant at a prostate cancer predisposition locus at 8q24 is associated with PVT1 expression.PLoS Genet2011,7:e1002165.
21. Tiwari VK, Cope L, McGarvey KM, Ohm JE, Baylin SB:A novel 6C assay uncovers polycomb-mediated higher order chromatin conformations. Genome Res2008,18:1171–1179.
22. Erfurth F, Hemenway CS, de Erkenez AC, Domer PH:MLL fusion partners AF4 and AF9 interact at subnuclear foci.Leukemia2004,18:92–102. 23. Tolhuis B, Blom M, Kerkhoven RM, Pagie L, Teunissen H, Nieuwland M,
Simonis M, de Laat W, van Lohuizen M, van Steensel B:Interactions among polycomb domains Are guided by chromosome architecture.PLoS Genet
2011,7:e1001343.
24. Smith E, Lin C, Shilatifard A:The super elongation complex (SEC) and MLL in development and disease.Genes Dev2011,25:661–672.
25. Balgobind BV, Zwaan CM, Pieters R, Van den Heuvel-Eibrink MM:The het-erogeneity of pediatric MLL-rearranged acute myeloid leukemia. Leukemia2011,25:1239–1248.
26. Tkachuk DC, Kohler S, Cleary ML:Involvement of a homolog of drosophila trithorax by 11q23 chromosomal translocations in acute leukemias.Cell
1992,71:691–700.
27. Thirman MJ, Gill HJ, Burnett RC, Mbangkollo D, McCabe NR, Kobayashi H, Ziemin-van Der Peol S, Kaneko Y, Morgan R, Sandberg AA, Chaganti RSK, Larson RA, Le Beau MM, Diaz MO, Rowley JD:Rearrangement of the MLL gene in acute lymphoblastic and acute myeloid leukemias with 11q23 chromosomal translocations.N Engl J Med1993,329:909–914. 28. Daser A, Rabbitts TH:Extending the repertoire of the mixed-lineage
leukemia gene MLL in leukemogenesis.Genes Dev2004,18:965–974. 29. Ferrando AA, Armstrong SA, Neuberg DS, Sallan SE, Silverman LB, Korsmeyer SJ,
Look AT:Gene expression signatures in MLL-rearranged T-lineage and B-precursor acute leukemias: dominance of HOX dysregulation.Blood2003,
102:262–268.
30. Lin C, Smith ER, Takahashi H, Lai KC, Martin-Brown S, Florens L, Washburn MP, Conaway JW, Conaway RC, Shilatifard A:AFF4, a component of the ELL/P-TEFb elongation complex and a shared subunit of MLL chimeras, can link transcription elongation to leukemia.Mol Cell2010,37:429–437. 31. Biswas D, Milne TA, Basrur V, Kim J, Elenitoba-Johnson KS, Allis CD, Roeder RG:Function of leukemogenic mixed lineage leukemia 1 (MLL) fusion proteins through distinct partner protein complexes.Proc Natl Acad Sci U S A2011,108:15751–15756.
32. Marschalek R:Mechanisms of leukemogenesis by MLL fusion proteins. Br J Haematol2011,152:141–154.
33. Cavalli G, Misteli T:Functional implications of genome topology. Nat Struct Mol Biol2013,20:290–299.
34. Look AT:Oncogenic transcription factors in the human acute leukemias. Science1997,278:1059–1064.
35. Liu H, Cheng EH, Hsieh JJ:MLL fusions: pathways to leukemia.Cancer Biol Ther2009,8:1204–1211.
36. Cowell IG, Sondka Z, Smith K, Lee KC, Manville CM, Sidorczuk-Lesthuruge M, Rance HA, Padget K, Jackson GH, Adachi N, Austin CA:Model for MLL translocations in therapy-related leukemia involving topoisomerase IIbeta-mediated DNA strand breaks and gene proximity.Proc Natl Acad Sci U S A2012,109:8989–8994.
37. Eguchi M, Eguchi-Ishimae M, Greaves M:Molecular pathogenesis of MLL-associated leukemias.Int J Hematol2005,82:9–20.
38. Fraser J, Rousseau M, Shenker S, Ferraiuolo MA, Hayashizaki Y, Blanchette M, Dostie J:Chromatin conformation signatures of cellular differentiation. Genome Biol2009,10:R37.
39. Sauvageau G, Lansdorp PM, Eaves CJ, Hogge DE, Dragowska WH, Reid DS, Largman C, Lawrence HJ, Humphries RK:Differential expression of homeobox genes in functionally distinct CD34+ subpopulations of human bone marrow cells.Proc Natl Acad Sci U S A1994,91:12223–12227. 40. Pineault N, Helgason CD, Lawrence HJ, Humphries RK:Differential
expression of Hox, Meis1, and Pbx1 genes in primitive cells throughout murine hematopoietic ontogeny.Exp Hematol2002,30:49–57. 41. Calvo R, West J, Franklin W, Erickson P, Bemis L, Li E, Helfrich B, Bunn P,
Roche J, Brambilla E, Rosell R, Gemmill RM, Drabkin HA:Altered HOX and WNT7A expression in human lung cancer.Proc Natl Acad Sci U S A2000,
97:12776–12781.
42. Makiyama K, Hamada J, Takada M, Murakawa K, Takahashi Y, Tada M, Tamoto E, Shindo G, Matsunaga A, Teramoto K, Komuro K, Kondo S, Katoh H, Koike T, Moriuchi T:Aberrant expression of HOX genes in human invasive breast carcinoma.Oncol Rep2005,13:673–679.
43. Maeda K, Hamada J, Takahashi Y, Tada M, Yamamoto Y, Sugihara T, Moriuchi T:Altered expressions of HOX genes in human cutaneous malignant melanoma.Int J Cancer2005,114:436–441.
44. Eklund EA:The role of HOX genes in malignant myeloid disease. Curr Opin Hematol2007,14:85–89.
45. Thorsteinsdottir U, Sauvageau G, Hough MR, Dragowska W, Lansdorp PM, Lawrence HJ, Largman C, Humphries RK:Overexpression of HOXA10 in murine hematopoietic cells perturbs both myeloid and lymphoid differentiation and leads to acute myeloid leukemia.Mol Cell Biol1997,
17:495–505.
46. Kroon E, Krosl J, Thorsteinsdottir U, Baban S, Buchberg AM, Sauvageau G:
Hoxa9 transforms primary bone marrow cells through specific collaboration with Meis1a but not Pbx1b.Embo J1998,17:3714–3725. 47. Ayton PM, Cleary ML:Transformation of myeloid progenitors by MLL
oncoproteins is dependent on Hoxa7 and Hoxa9.Genes Dev2003,
17:2298–2307.
48. Garcia-Fernandez J:The genesis and evolution of homeobox gene clusters.Nat Rev Genet2005,6:881–892.
49. Amores A, Force A, Yan YL, Joly L, Amemiya C, Fritz A, Ho RK, Langeland J, Prince V, Wang YL, Westerfield M, Ekker M, Postlethwait JH:Zebrafish hox clusters and vertebrate genome evolution.Science1998,282:1711–1714. 50. Ethier SD, Miura H, Dostie J:Discovering genome regulation with 3C and
3C-related technologies.Biochim Biophys Acta1819,2012:401–410. 51. Dostie J, Richmond TA, Arnaout RA, Selzer RR, Lee WL, Honan TA, Rubio ED,
Krumm A, Lamb J, Nusbaum C, Green RD, Dekker J:Chromosome Conformation Capture Carbon Copy (5C): a massively parallel solution for mapping interactions between genomic elements.Genome Res2006,
16:1299–1309.
52. Ferraiuolo MA, Rousseau M, Miyamoto C, Shenker S, Wang XQ, Nadler M, Blanchette M, Dostie J:The three-dimensional architecture of Hox cluster silencing.Nucleic Acids Res2010,38:7472–7484.
53. Cortes C, Vapnik V:Support-vector networks.Mach Learn1995,20:273–297. 54. Noble WS:What is a support vector machine?Nat Biotechnol2006,
24:1565–1567.
55. Rousseau M, Crutchley JL, Miura H, Suderman M, Blanchette M, Dostie J:
Hox in motion: tracking HoxA cluster conformation during differentiation.Nucleic Acids Res2014,42:1524–1540.
56. Phillips JE, Corces VG:CTCF: master weaver of the genome.Cell2009,
137:1194–1211.
57. Fraser J, Ethier SD, Miura H, Dostie J:A Torrent of data: mapping chromatin organization using 5C and high-throughput sequencing. Methods Enzymol2012,513:113–141.
58. Ferraiuolo MA, Sanyal A, Naumova N, Dekker J, Dostie J:From cells to chromatin: capturing snapshots of genome organization with 5C technology.Methods2012,58:255–267.
59. Ludwig JA, Weinstein JN:Biomarkers in cancer staging, prognosis and treatment selection.Nat Rev Cancer2005,5:845–856.
60. Dr Josee Dostie Laboratory.[http://Dostielab.biochem.mcgill.ca] 61. Weka 3: Data Mining Software in Java, version 3.7.5.[www.cs.waikato.ac.
nz/ml/weka/]
62. Hall M, Frank E, Holmes G, Pfahringer B, Reutemann P, Witten IH:The WEKA data mining software: an update.SIGKDD Explorations2009,11:10–18. 63. Keerthi SS, Shevade SK, Bhattacharyya C, Murthy KRK:Improvements to Platt’s
SMO algorithm for SVM classifier design.Neural Computation2001,13:13. 64. Hastie T, Tibshirani R:Classification by pairwise coupling.Ann Statist1998,
65. R: a language and environment for statistical computing. R foundation for statistical computing, Vienna, Austria.[http://www.R-project.org/] 66. Lefrancois P, Euskirchen GM, Auerbach RK, Rozowsky J, Gibson T, Yellman
CM, Gerstein M, Snyder M:Efficient yeast ChIP-Seq using multiplex short-read DNA sequencing.BMC Genomics2009,10:37.
67. The McGill University and Génome Québec Innovation Centre.[http:// gqinnovationcenter.com/]
68. Collection of command line tools for Short-Reads FASTA/FASTQ files preprocessing.http://hannonlab.cshl.edu/fastx_toolkit/.
69. Langmead B, Trapnell C, Pop M, Salzberg SL:Ultrafast and memory-efficient alignment of short DNA sequences to the human genome.Genome Biol
2009,10:R25.
70. Software for motif discovery and ChIP-Seq analysis.http://homer.salk.edu/ homer/chipseq/.
71. Dr. Josee Dostie Laboratory.http://dostielab.biochem.mcgill.ca/research.html. 72. 5C and ChIP-seq datasets generated for this study downloadable from the Gene Expression Omnibus.http://www.ncbi.nlm.nih.gov/geo/query/acc.cgi? acc=GSE55408.
73. Lajoie BR, van Berkum NL, Sanyal A, Dekker J:My5C: web tools for chromosome conformation capture studies.Nat Methods2009,6:690–691. doi:10.1186/gb-2014-15-4-r60
Cite this article as:Rousseauet al.:Classifying leukemia types with
chromatin conformation data.Genome Biology201415:R60.
Submit your next manuscript to BioMed Central and take full advantage of:
• Convenient online submission
• Thorough peer review
• No space constraints or color figure charges
• Immediate publication on acceptance
• Inclusion in PubMed, CAS, Scopus and Google Scholar
• Research which is freely available for redistribution