Classification of SSVEP Based Brain Signals using
Discrete Wavelet Transform
Taranpreet Singh Talwar 1, Satnam Singh Matharu2
1,2
Department of Electrical Engineering, CTIEMT, Jalandhar
Abstract—Brain Computer Interface (BCI) sometimes called mind machine interfaceprovides a non-muscular communication channel between the brain and the external device. It provides an alternate communication channel for people who suffer from severe motor disabilities. The Steady State Visual Evoked Potential (SSVEP) is a very suitable input signal of BCI system because of its high information transfer rate and short training time. The artifacts are disturbance that can occur during the signal acquisition and that can alter the analysis of the signals themselves. Detecting artifacts produced in electroencephalography data by electrical noise, eye blinks and muscle activity is a common and important problem in electroencephalography research. In this research, an algorithm classifies two different SSVEP signals, which are extracted by Discrete Wavelet Transform for further implementation in real life.
Keywords- Brain-Computer interface (BCI), Steady State Visual Evoked Potential (SSVEP), Discrete Wavelet Transform (DWT), Support Vector Machine (SVM), Repetitive visual stimulation (RVS), Artifacts.
I. INTRODUCTION
A Brain Computer Interface (BCI) is an alternative communication pathway, bypassing the normal cortical-muscular pathway.BCI system is helpful for those people who are unable to do their body movements after a severe neuromuscular disorder caused by diseases such as amyotrophic lateral sclerosis, spinal cord injury, brainstem strokes etc. [1,2,3,4] but their brains are active. So with the help of their brains we try to provide some comfort in their life without the help of any other person. BCI is often directed at assisting, augmenting or repairing human cognitive or sensory motor functions. A BCI allows real time interaction between human brain and external device. A BCI translates brain signals of a BCI user proportional to his/her intent into a desired output. The desired output could be used to control external devices like a wheelchair, a robotic arm and so on.
Fig.1 Block diagram showing steps of analysis
Electroencephalography (EEG) is a method to record electrical activity of the brain. Electroencephalogram (EEG) signal is
EEG Signal
Electrode O1, Oz , O2 Signal
Pre-processing the Signal
Feature extraction using Discrete Wavelet Transform
Feature Classification using SVM
Class 4 Class 3
novel interfacing technology between a human and a machine such as a BCI [5]. There are several methods have been proposed to classify the EEG signals. The SVM technique has always been a popular method for frequency-based extracting and classifying EEG signals. Support Vector machines have been applied to classification of EEG signals [6, 7, 8]. The most well-known advantage of SVM is that it can be readily used for process parameter assessment without requiring any knowledge of the underlying system. Wavelet transform basis are the foundation for the most popular techniques for signal analysis and representation in a wide range of applications. In addition, wavelets processing play a role of extraction algorithm to draw features of EEG signals [9].
Fig. 1 shows the steps carried out for the analysis. The analysis was carried out using MATLAB tool.
II. FEATURE EXTRACTION AND CLASSIFICATION METHOD
A. Data Acquisition
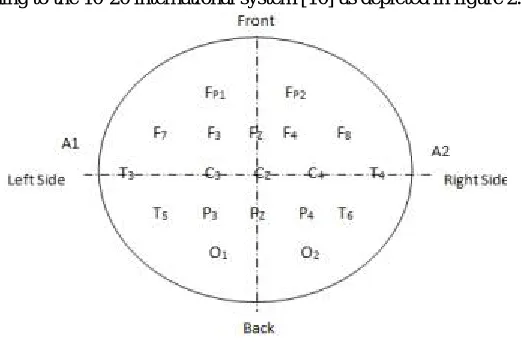
[image:3.612.178.439.240.411.2]The electrodes were placed according to the 10-20 international system [10] as depicted in figure 2.
Fig. 2 The 10-20 System of Electrode Placement
The data for this experiment were taken using BCI Competition IV. The subject was seated in a comfortable chair with dim lighting. A computer running the program used to present visual stimulation to the subject used to record from positions O1 and O2 and defined by the 10-20 system of electrode placement. These 2 channels were referenced to electrically linked mastoids at A1 and A2. The impedance of all electrodes was kept below 5K ohms. The data were recorded at a sampling rate of 250 Hz with an EEG amplifier.
In this experiment Discrete Wavelet Transform (DWT) has been used as a tool for feature extraction of EEG signal
B. Wavelet transform
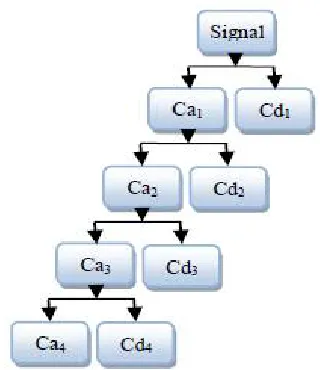
The wavelet transform is a tool which decomposes an input signal of interest into a set of elementary waveforms, called "wavelets" and provides a way to analyze the signal by examining the coefficients (or weights) of these wavelets. For analyzing the non-stationary signals like EEG, time–frequency methods such as wavelet transform is the most suitable method to be used. The Discrete Wavelet Transform (DWT) analyzes the signal at different frequency bands with different resolutions by decomposing the signal into a coarse approximation and detail information performing multi-resolution analysis. DWT employs two sets of functions, called scaling functions and wavelet functions, which are associated with low pass and high-pass filters respectively. The decomposition of the signal into different frequency bands is simply obtained by successive high-pass and low-pass filtering of the time domain signal. These decomposed bands are called as sub bands. The output of the low-pass filter gives the approximation coefficients, while the high pass filter gives the detail coefficients. As shown in the figure 3 Ca1 is the approximation coefficient and Cd1 is the
Fig 3. Decomposition of the signal in four levels
C. Support Vector Machine (SVM)
Support Vector Machines are finding many uses in pattern recognition and classification tasks. Support Vector Machine (SVM) classifies data by finding the best hyperplane that separates all data points of one class from those of the other class. The best hyperplane for an SVM means the one with the largest margin between the two classes. Margin means the maximal width of the slab parallel to the hyperplane that has no interior data points. The data points closest to the hyper plane are called the support vectors; these points are on the boundary of the slab. A further important concept in SVM is the transformation of data into a higher dimensional space for the construction of optimal separating hyperplane. SVM perform this nonlinear mapping into a higher dimensional feature space by means of a kernel function and then construct a linear optimal separating hyperplane between the two classes in the feature space. Some commonly used kernels include Gaussian, Radial Basis Functions, and Polynomials.
III. EXPERIMENTAL RESULT AND DISCUSSIONS
A. Dataset
The Data set used in this experiment has been obtained from BCI Competition IV, dataset III provided by Department of Medical Informatics, Institute for Biomedical Engineering, University of Technology Graz [11],[12]. This dataset was recorded from a normal subject (female, 25y). The subject sat in a relaxing chair with armrests,50 cm in front of vision stimulator. The subject was asked to gaze at the flickering LEDs and control the ball on the computer screen to go along the maze route. The EEG recording was made using a G.tec amplifier and a Ag/AgCl electrodes. Three bipolar EEG channels (anterior ‘+’, posterior ‘-‘) were measured over O1, OZ and O2 as shown in figure 4 which uses a 16 bit A/D converter. A serial cable connected the computer used to present
[image:4.612.219.379.102.287.2]the stimulation to the Syn-amps2 EEG amplifier, and was used to signal when a stimulus was presented.
several minutes break in between. The RVS for eliciting SSVEP responses can be presented on a set of Light Emitting Diodes (LEDs) or on a Liquid Crystal Display (LCD) monitor. In this study RVS displayed using LCD monitor due to the flexibility in changing the color of flickering bars, and were designed using Lab VIEW software (National Instrument Inc., USA). Two colours: red and blue were included in the experiment. Background colour selected as black. Four frequencies 7, 9, 11 and 13 Hz, in the low frequency range were selected, as the refreshing rate of LCD monitor is 60 Hz and the high amplitude SSVEPs are obtained at lower frequencies. The visual stimuli were square (4cm×4cm) in shape and were placed on four corners of the LCD screen. In order to select any particular stimuli the four visual stimuli were separated in pair of two each 7, 9 and 11, 13.During experiments, the subjects were directed to focus on a particular frequency for 5 second duration followed by 5 second rest period. During focusing the subjects were instructed to avoid eye movements or blinking. The event markers were used to indicate the starting and ending time of each frequency. In a single trial, each of the four frequencies was performed three times and the same procedure was repeated for another three trials. 5 minutes break was given in between each trial. The time for completing one session was about 30 minutes. Among this 140 trials were given as training data and remaining 140 trials as testing data. From the given dataset the electrodes O1 and O2 were considered for analysis. The electrode OZ was eliminated since it did not provide relevant information .
B. Feature Extraction
In this experiment the signal has been decomposed in 4 levels using discrete wavelet transform. The approximate coefficient Ca4
and each level detail coefficients Cd4, Cd3, Cd2 and Cd1 were used as a feature for classification. The sampling frequency was
128Hz.
C. Feature Classification
Support Vector Machine has been used as a classifier in this experiment. The kernel function used was Radial Basis Function. The classifier was trained using training data and the parameters of SVM were set using 5 fold cross validation. Then, the testing data was applied to the classifier and classification accuracy was determined as a performance measure parameter of the classifier. The different wavelet coefficients were used as the features and the classification accuracy was determined as follows.
1) The wavelet coefficients at all decomposition level Ca4, Cd4, Cd3, Cd2 and Cd1 were used as a feature vector and were classified
into two classes using Support Vector
2) The feature vector consisting of all coefficients forms a large dimension vector. Hence, to reduce the feature vector dimension detail coefficients Cd2 and Cd3 were only considered. The coefficient Cd2 and Cd3 has frequency range 16-32 Hz and 8-16 Hz
respectively which comes in the range of mu band and beta band.
3) The feature vector dimension was also reduced by determining the statistical parameters of the all wavelet coefficients like:
a) Maximum of wavelet coefficients of each sub band
b) Minimum of wavelet coefficients of each sub band
c) Mean of wavelet coefficients of each sub band and
d) Standard deviation of wavelet coefficients of each sub band
TABLE 1
REGRESSION RATE OF BOTH THE RED AND BLUE LED AT VARIOUS FREQUENCIES
Colour Frequency Regression
Red
9 Hz 80.94%
11 Hz 70.99%
13 Hz 63.2%
Blue
7 Hz 72.66%
9 Hz 72.22%
13 Hz 93.74%
EEG data was analyzed using wavelet transform to extract the features used for classification. The EEG signals recorded from OZ
program. S is the original EEG signal. From cd1 to cd4 are detail-signals decomposed from original EEG signal. Ca4 is the
approximation signal. The data length of the original averaging signal is 250, the length of the wavelet coefficients Cd4 is 100,
which is 9% length of the original signal.
The feature vector extracted using DWT were used for classification. There were four separate data sets each for two different stimuli colours. A complete dataset for each colour consist 400 samples (100 samples for each of the four frequencies) from each subject data. The data were normalized in the range of [-1, +1]. After dozens of training sessions, an SVM network configuration having was selected.
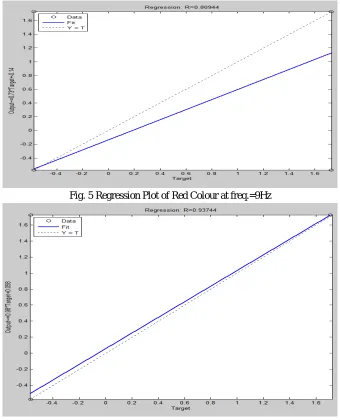
[image:6.612.136.476.231.651.2]After making SVM model 50 test samples(Out of 100 samples obtained after DWT) of all the four frequencies (7HZ,9Hz,11Hz & 13HZ) of both the led’s signal(Red & Blue) were tested with the target matrix of 200X4 size and regression plots are obtained for each frequencies results of which are shown at the figures given below. Regression plot shows the closeness b/w input and output signals. Here input signal is formed by SVM model obtained by training signals.
Fig. 5 Regression Plot of Red Colour at freq.=9Hz
Fig. 6 Regression Plot of Blue Colour at freq.=13Hz
IV. CONCLUSION AND FUTURE SCOPE
The SVM results shows that red colour has maximum accuracy 80% approx of at 9 Hz frequency whereas Blue colour shows maximum accuracy of 93% approx at 13Hz frequency.
(SVM).The accuracy of the system can be improved in future by improving system parameters such as increasing the number of target for selections, and optimizing the electrode positions and operating speed for each and every subject. Also in future, the SSVEP based BCI system developed can be integrated with more number of classes which can be used for control options and can be used by disabled people to control external devices includes environmental control units, mental speller etc.
REFERENCES
[1] Wolpaw J R, Birbaumer N, McFarland D J, et al. “Brain-computer interface for communication and control,” Clinical Neurophysiology, vol. 113, 2002, pp. 767-791.
[2] Jonathan R.Wolpaw,"Brain–computer interfaces as new brain output pathways", J. Physiology 579.3, 2007, pp 613–619.
[3] Andrea Kubler, Boris Kotchoubey, Jochen Kaiser, Wolpaw J. R., Birbaumer N., "Brain -Computer Communication-Unlocking the Locked In" Psychological Bulletin, American Psychological Association Inc., Vol. 127, No. 3, 2001, pp 358-375.
[4] Indu Dokare, Naveeta Kant, " A Study of Bain Computer Interface System", International Journal of Engineering Research & Technology (IJERT), Vol. 2 Issue 3, March - 2013.
[5] S. G. Mason and G. E. Birch, “A general framework for brain-computer interface design”, IEEE Trans.Neural Systems and Rehabilitation Eng. vol. 11, (2003),pp.70-85.
[6] Bankman, I. N., Sigillito, V. G., Wise, R. A., Smith, P. L.: “Feature-based detection of the K-complex wave in the human electroencephalogram using neural networks”,IEEE Trans. Biomedical Engineering, vol. 39, no. 12, 1992,pp. 1305-1310.
[7] Jansen, B. H., Desai, P. R., “K-complex detection using multi-layer perceptions and recurrent networks”, Bio-Medical Computing, vol. 37, 1994, pp. 249-257. [8] Tsoi, A. C., So, D., Sergejew, A. A., “Classification of electroencephalogram using artificial neural networks”, in ‘Advances in Neural Information Processing
Systems’,Vol. 6, (Morgan Kaufmann, San Mateo, CA 1994), pp. 1151-1158.
[9] Truong Quang Dang Khoa, Masahiro Nakagawa. “Functional Near Infrared Spectroscope for Cognition Brain Tasks by Wavelets Analysis and Neural Networks”, International Journal of Biological and Medical Sciences. Vol.1:1 Jan 2008, pp.28-34.
[10] C.-J. Lin, M.-H. Hsieh, “Classification of mental task from EEG data using neural networks based on particle swarm optimization”, Neurocomputing (2008), doi:10.1016/j.neucom.2008.02.017.
[11] http://www.bbci.de/competition/iv/