6
I
January 2018
Experimentation, Analysis and Optimization of
TIG Welding Process for SS-316l
Azadkumar Vegda1, Pradipkumar Maheshwari2, Sumit Bhingradiya3, Kaushik Faldu4
1,2,3,4,
Mechanical Engineering Department, A.D. Patel Institute of Technology, New Vallabh Vidyanagar-388121.
Abstract: The development and fabrication of fusion reactor and boiler components utilize different grades of stainless steel materials. The purpose of this work is experimentation, analysis and optimization of joining similar grades of stainless steel (SS 316L) by TIG welding. The parameters like current, filler materials, groove angle are the variables in the work. The welding parameters are being assessed by means of Taguchi’s L9 orthogonal array with varying filler wire, current and groove angle. The mechanical properties and micro-structure of SS 316L austenitic stainless steel welds are investigated. The level of importance of welding parameters for mechanical properties is determined by using analysis of variance (ANOVA).
I. INTRODUCTION
Quality and productivity plays an important role in today’s manufacturing market nowadays due to very stiff and cut throat competitive market condition in manufacturing industries. The main objective of industries reveals with producing better quality product at minimum possible cost and increase productivity. Welding is the most vital and common operation used for joining of two similar and dissimilar parts. SS-316L is widely used for fabrication works mainly because the material contains low carbon and good weld ability factor. It is used at temperatures up to 1150°C in continuous service, with good ductility. Welding of SS-316L materials is very important activity in nuclear fusion reactor and boiler component development and cryogenic structures. During welding its penetration, microstructure, mechanical properties and residual stresses plays very crucial role in the quality and strength of weld. If any of weld parameters not selected properly it may cause failure of the system. In the present work an attempt is made to investigate the effect of different process parameters on TIG welding for SS 316l. The quality of the weld has been evaluated in terms of mechanical testing of the welded specimens. By using Taguchi and ANOVA technique an optimal solution is find out, which provides an optimal results of the varying condition. Tungsten Inert Gas (TIG) or Gas Tungsten Arc welding (GTAW) is the arc welding process in which the arc is generated between the non-consumable tungsten electrode and work piece. This tungsten electrode and the weld pool are shielded by an inert gas normally argon and helium. These tungsten arc welding processes are being employed widely for the precision joining of critical components which require controlled heat inputs. The small intense heat sources provided by the tungsten arc are ideally suited to the controlled melting of the material. Since this electrode is not consumed during the process, with the GTAW Welding Processes, welding without filler material can be done without the need for continual compromise between the heat input from the arc and the melting of the filler metal. The GTAW welding process dependents up on the number of welding parameters which are as follows,
A. Welding Voltage
B. Welding Current
C. Welding Speed
D. Arc length
E. Choice of shielding gas and gas flow rate F. Filler wire
Most of these parameters must be matched to each other for optimum welding performance. The working point must be within the working range or tolerance box for the particular welding situation. The time needed for the adjustment at a typical welding situation is normally short for an experienced welder but the optimization of a weld for an automated production line may need some effort.
II. PROBLEM SPECIFICATION
In this study the distortion of TIG welding process is evaluated using weld current, groove Angle and the filler rods as the main parameters. A L9 orthogonal array was selected for the design of experiments. ANOVA was performed to obtain significant parameter which gives the percentage contribution of each process parameter under operating Condition.
III. METHODOLOGY
A. Material Selection - SS316L
Austenitic is the most widely used type of stainless steel. It has a nickel content of at least of 7%, which makes the steel structure fully austenitic and gives it ductility, a large scale of service temperature, nonmagnetic properties and good weld ability.
The SS 316L is a austenitic steel and it is selected over other grades due to used in fluidized bed, pressure vessels for corrosive liquids, cryogenic components, gasifiers etc.
The material SS 316L is contains low carbon and it has a good weld ability factor. The increase of carbon in steel may result in decrease in the ductility of steel, increase in the tensile strength of steel, increases in the hardness of steel, lowering the melting point of steel and increases the difficulty of welding steels. Thus the stainless steel with low carbon content is selected in order to have better parameters in welding.
SS 304L and SS 316L both have the same carbon content but the effect of chromium is more in the case of 304L plays a major role. The addition of chromium causes the steel to increase corrosion resistance and oxidation resistance which is good but there is a proportional increase in the harden ability as well as high-temperature strength. As a hardening element, chromium is frequently used with a toughening element such as nickel to produce superior mechanical properties. At higher temperatures, chromium contributes to increased strength. So the addition of chromium results is in more time consumption in welding because of its nature. Thus the hardness reduces the weld ability nature of the material, so the SS316L was selected for this work.
The other considerable fact is that SS 316L has the addition of Molybdenum which causes the material to increase its creep strength at elevated temperatures. The material SS 316L is selected based on the above mentioned features and the base metal compositions are shown in Table 1. The tensile strength of the base metal is found to be 539.69 N/mm2.
B. Filler Material
[image:3.612.31.584.564.730.2]Austenitic stainless steels are particularly prone to the hot cracking phenomenon. It has been determined however, that hot cracking may be reduced in austenitic stainless steel weldments by using filler materials that contain a small percentage of retained ferrite.
Table.1. Chemical Composition
Elements C Si Mn P S Cr Mo Ni
Wt% 0.03 0.29 1.58 0.027 0.003 16.25 2.27 11.90
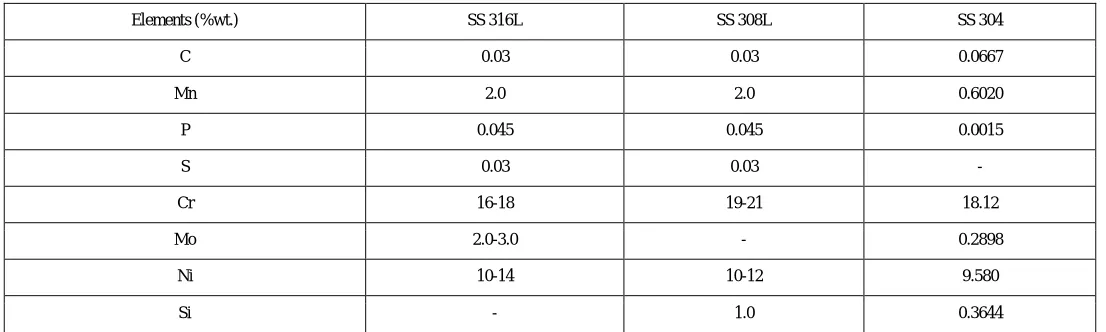
Now in this work, different filler materials viz., 316L, 308L and 304 are tested to investigate the better filler material for welding 316LSS and to determine the best mechanical properties in severe conditions. The chemical composition of all the filler materials used are as given in Table2
Table 2. Filler material composition
Elements (%wt.) SS 316L SS 308L SS 304
C 0.03 0.03 0.0667
Mn 2.0 2.0 0.6020
P 0.045 0.045 0.0015
S 0.03 0.03 -
Cr 16-18 19-21 18.12
Mo 2.0-3.0 - 0.2898
Ni 10-14 10-12 9.580
C. Design of Experiment
1) Taguchi Method: The parameters which are required for welding is being arranged by means of Taguchi’s orthogonal array with our own sample range. The Taguchi method is preferred over other methods because it is a simple and robust technique for optimizing the process parameters and it can be effectively used to quickly identify the problems that are incurred during a manufacturing process from data already in existence. The statistical tool Minitab is used for the construction of the array.
It also emphasizes the mean performance characteristic value close to the target values, thus improving the product quality. With such an arrangement, completely randomized experiments
can be performed. The optimization of process parameters using Taguchi’s method permits evaluation of individual parameters independent of other parameter and also their interactions on the identified quality characteristics that is the ultimate tensile strength. Using a signal-to-noise ratio to analyze the experimental data could help to easily find out the optimal parametric combinations. The greatest advantage of this method is the saving of effort in conducting experiments; saving experimental time, reducing the cost and discovering significant factors quickly. The effect of many different parameters on the performance characteristic in a condensed set of experiments can be examined by using the orthogonal array experimental design proposed by Taguchi. Once the parameters affecting a process that can be controlled have been determined, the levels at which these parameters should be varied must be determined. Taguchi’s robust design method is a powerful tool for the design of a high-quality system. In addition to the S/N ratio, a statistical analysis of variance (ANOVA) can be employed to indicate the impact of process parameters on mechanical properties of weld joints.
[image:4.612.34.576.365.447.2]The parameters which are required for welding is being arranged by means of Taguchi’s table and the Taguchi’s orthogonal array is constructed to know the parameters which is required for this welding experiment with our own sample range. The table shows the three levels and the three parameters which we have employed for welding the samples.
Table 3.3 Selection of parameter
Levels Current
(Amp) Groove Angle Filler material
Level A 80 50 SS316L
Level B 90 60 SS308L
Level C 100 70 SS304
D. Experimental Procedure
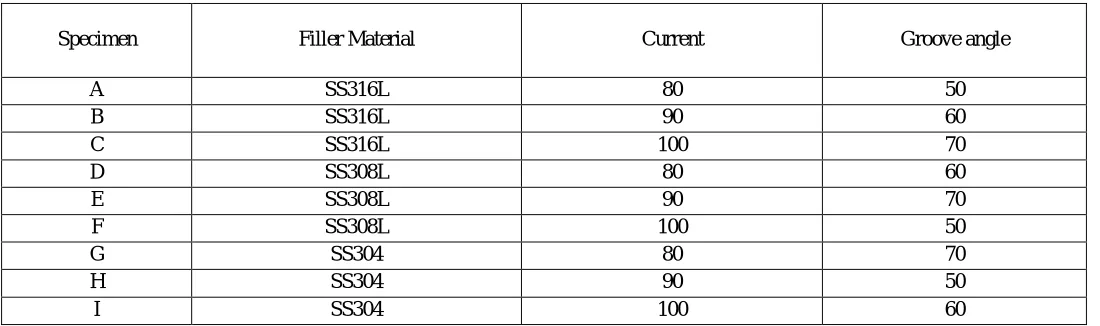
Welding was performed in single pass by the manual gas tungsten arc welding procedure with direct current electrode negative (DCEN), using Argon gas shielding. For this study, a total of 9 specimens were prepared. Each one of the three different stainless steel filler rods, namely SS316L, SS308 and SS309L were used to weld three pairs of SS316L plates respectively. The welding current was the other parameter varied for each experiment thus giving a range of heat input for welding.
Table 4. L9 orthogonal array matrix
Specimen Filler Material Current Groove angle
A SS316L 80 50
B SS316L 90 60
C SS316L 100 70
D SS308L 80 60
E SS308L 90 70
F SS308L 100 50
G SS304 80 70
H SS304 90 50
[image:4.612.34.584.551.714.2]E. Process Parameters
1) Specimen dimension - 70×50×5
2) Filler rod diameter - 2 mm
3) Welding technique - Down hand welding
4) Weld joint - Butt joint
5) Weld groove- Single V groove
6) Polarity- DCEN (straight polarity)
80Amp(60oangle) E. 90A(70oangle) F. 100A(50oangle) G.80Amp(70o angle) H.90A(50o angle)I.100A(60o angle)
A.80Amp(50o angle) B.90A(60o angle) C.100A(70o angle) Fig.1. Snapshots of welded specimen
IV. TESTING AND RESULTS
A. Tensile Strength
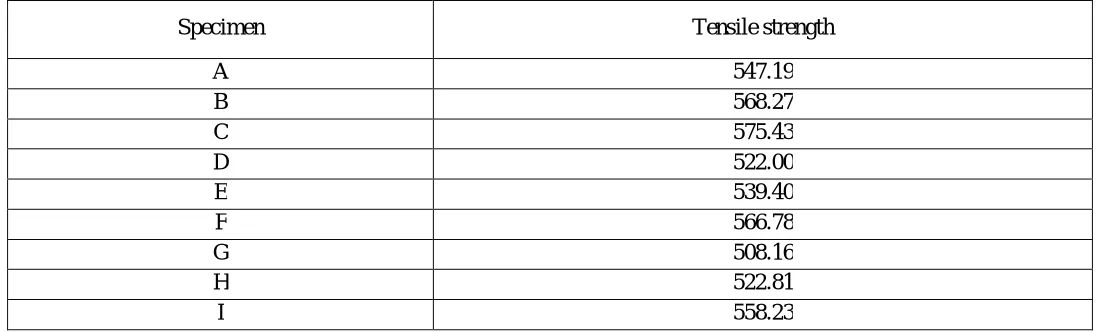
[image:5.612.31.580.570.736.2]The welding process was analyzed using the test pieces with respect to parameters incurred in Table 4. The tensile strength of the specimen was determined by UTM (Universal Testing Machine). The tensile strength of specimen are tabulated in table 5.
Table 5. Tensile Strength Result
Specimen Tensile strength
A 547.19
B 568.27
C 575.43
D 522.00
E 539.40
F 566.78
G 508.16
H 522.81
Ductility of the material can also be determined by the tensile test. It can be seen that, the tensile strength of specimen welded with 316L filler rod is high compared to that welded with 304 or 308L.
Strength of weld is proportionately increasing with the welding current. Also From the result it shows that maximum tensile strength is obtained for groove angle of 600.
B. Micro-Hardness (VHN)
The micro hardness experimentation was done in order to compare the characteristics of hardnessin the weldment and Heat affected zone. The hardness results are taken for all the nine samples.
[image:6.612.38.578.245.414.2]The results of Vickers micro hardness test across the mid-plane of the different joints are shown in table 3.6. In all samples the hardness of the weld zones are higher than those of base materials. Also, there was a gradual increase in the hardness from base metal to weld zone.
Table 6. Hardness results
Specimen Micro hardness (VHN)
Weldment Heat affected zone Base metal
A 241.60 221.30 207.60
B 240.0 231.90 209.30
C 247.3 230.00 211.20
D 240.00 219.40 204.90
E 249.30 232.60 213.30
F 243.30 232.10 212.10
G 218.20 210.30 201.30
H 240.00 219.40 204.90
I 239.80 221.20 206.20
Form the observation table 3.6, it is clear that with increase in welding ampere heat input was increased so that increase in welding ampere the grains became coarser so because of tempering effect of weld metal, HAZ and base metal, hardness of the weld metal &
HAZ was decreased with increased in the welding ampere
.
C. Analysis of Variance (ANOVA)
ANOVA is a statistically based, objective decision-making tool for detecting any differences in the average performance of groups of items tested. ANOVA helps in formally testing the significance of all main factors and their interactions by comparing the mean square against an estimate of the experimental errors at specific confidence levels.
The ANOVA procedure performs analysis of variance (ANOVA) for balanced data from a wide variety of experimental designs. In analysis of variance, a continuous response variable, known as a dependent variable, is measured under experimental conditions identified by classification variables, known as independent variables. The variation in the response is assumed to be due effects in the classification, with random error accounting for the remaining variation.
Analysis of variance is most important tool for calculating responsible factors, which significantly affects mechanical properties. For determining these affect on process parameters, F-test was performed. Results of ANOVA and percentage contributions by each process parameters are tabulated below.
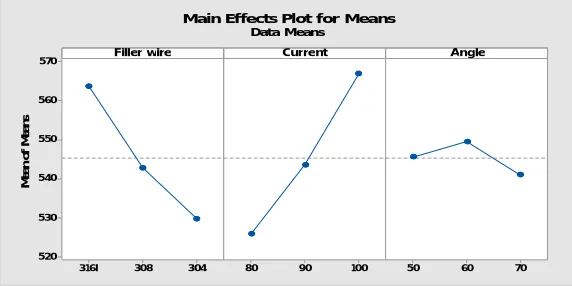
1) Effect of Process PARAMETERS On Mechanical Properties
Fig.2 Snapshot of main effects plot for mean of tensile strength
From the above graph we can observe that maximum tensile strength is achieved with filler material SS316L and least with SS304. Also we can note that 100 Amp current offers much higher tensile strength compare to 80Amp. Moreover variation in groove angle least affect the tensile strength of weld joint.
Table 7. ANOVA Results for Tensile Strength
Source DOF Sum of Squares SS Mean of Squares % of contribution
filler wire 2 576.507 288.253 38.73
current 2 25.620 12.810 56.08
Angle 2 8.327 4.163 2.39
Error 2 3.64 1.823 2.78
Total 8 614.10 307.049 100
The significance of factors prevails in the following order of importance: (1) Current; (2)Filler wire (3)Groove angle. The most significant factor is current; the percentage contribution of that parameter to tensile strength is 56.08. The next significant factor is filler wire which contributed 38.73%, and the third significant factor is the groove with percentage contribution of 2.39%.
[image:7.612.180.435.525.668.2]b) Micro Hardness: We have also obtained similar graphs for micro-hardness using minitab software.
Fig 3. Snapshot of Main effects plot for mean of Hardness
From the above graph we can say that maximum hardness is achieved with current of 80 amp and least with 100 amp. While the weld joint having filler material SS304 having higher hardness compare to other two. Similar to tensile strength hardness is higher at groove angle 600.
304 308 316l 570 560 550 540 530 520 100 90
80 50 60 70
Filler wire M e a n o f M e a n s Current Angle
Main Effects Plot for Means
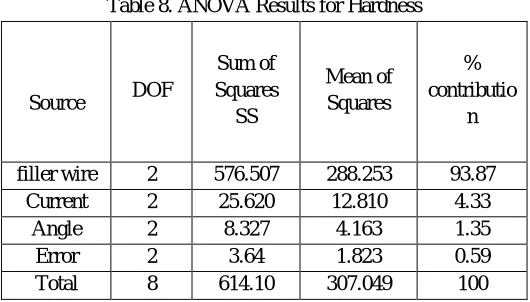
Table 8. ANOVA Results for Hardness
Source DOF
Sum of Squares
SS
Mean of Squares
% contributio
n
filler wire 2 576.507 288.253 93.87
Current 2 25.620 12.810 4.33
Angle 2 8.327 4.163 1.35
Error 2 3.64 1.823 0.59
Total 8 614.10 307.049 100
The above table shows that filer wire contribute maximum 93.87 % to hardness of the weld joint and current and groove angle contributes very few 4.33% and 1.35% respectively.
2) Microstructure Study: The microstructure study is made in order to view the material properties after the welding operation being performed on the sample. The equipment used is metallurgical Microscope and the magnification of 200x is used and the microstructure of the two main zones that is Weld zone and base metal is presented and the microstructure was taken only for the samples which possessed Low, Medium and High Tensile strength.
The results of microstructure of weld metal stainless steel 316l represents a delta ferrite structure in matrix of austenite in weld metal.
Weld specimen G
Weld specimen E
[image:8.612.174.439.80.231.2]The weld specimen C has finer delta ferrite structure, finer structure helps in achieving higher tensile strength. Also weld specimen E shows coarse delta ferrite structure and has lesser tensile strength compared to specimen C. Similarly weld specimen G also possess coarser delta ferrite structure in weld zone and it represents lesser tensile strength compared to other two specimens. Also coarse structure cause surface roughness.
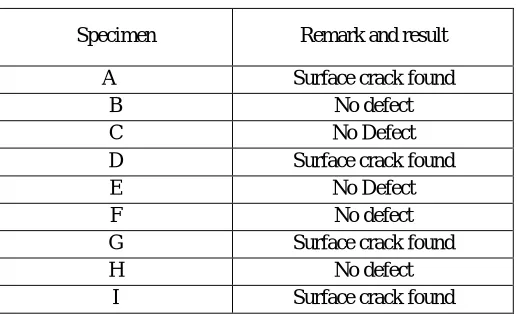
[image:9.612.178.437.189.346.2]3) Dye penetration Test: Dye Penetrant inspection is commonly used for the inspection of surface associated discontinuities in weld components. In this technique low viscosity liquids are allowed to penetrate in the surface openings and after penetration, liquid is made to extract out again by means of some developers. Results for Dye penetration test is shown in Table9.
Table 9. Results of DP test
Specimen Remark and result
A Surface crack found
B No defect
C No Defect
D Surface crack found
E No Defect
F No defect
G Surface crack found
H No defect
I Surface crack found
D. Summary of Results
The various tests are conducted in this experiment, from the analysis of all experimental trials it was found that the great effect of welding parameters such as welding current, voltage and filler material on weld joint. It is clear from the results phase that the following conclusions are drawn from the analysis of collected data of input and output parameters. We can summarize the obtained results in the following manner
1) The tensile test has showed that the Current of 100A, Bevel Angle of 700 and filler material SS316L offers the maximum tensile strength of 575.43MPa.
2) The tensile test has showed that the Current of 80A, Bevel Angle of 700 and filler material SS304L offers the minimum tensile strength of 508.16MPa.
3) There is a gradual increase in the hardness from base metal to weld zone.
4) The weld joint with filler material SS316L has produced better tensile strength compared to weld joints with other two filler materials.
5) The microstructure examination shows that fine and coarse delta ferrite structure is present in weld zone of different samples.
V. CONCLUSION
Welding of Stainless steel materials is very important activity in nuclear fusion reactor components development. The samples developed with various welding process parameters like current, filler material and weld groove angle TIG, are subjected to ultimate tensile strength test, hardness test and microstructure examination. The TIG weld samples with SS316L base materials are studied for the weld quality and basic understanding towards weld defects analysis. From the present work we can conclude that
A. The best result is obtained for the sample C (Corresponding to current 100Amp, filler material SS316L and Groove angle of
700).
B. The results conclude that the current has a major impact in affecting the output tensile strength that is desired and the weld groove angle has the least impact in affecting the tensile strength.
C. Fusion zones has higher hardness than base materials in all samples.
D. Effect of various welding process parameters on tensile strength and hardness has been observed in ANOVA method.
VI. ACKNOWLEDGEMENT
We would like to express our deepest appreciation to all those who provided us the possibility to complete this project. A special gratitude to our final year project guide, Dr. Unnati A Joshi and Prof. S R Pandya for their contribution in stimulating suggestions and encouragement helped us to coordinate our project. We would also like to gratefully and sincerely thanks to Head of the Mechanical Engineering Department, A.D. Patel Institute of Technology, Dr. Vishal N Singh for his guidance and understanding during our project work.
REFERENCES
[1] C. Balaji, S.V. Abinesh Kumar, S. Ashwin Kumar, Evaluation of mechanical properties of SS 316 l weldments using tungsten inert gas welding, International Journal of Engineering Science and Technology, 2012.
[2] S. R. Patil1, C. A. Waghmare, Optimization of MIG welding parameters for improving strength of welded joints, International Journal of Advanced Engineering Research and Studies, 2013.
[3] Balaji Chandrakantha, S. V. Abinesh Kumarb, S. Ashwin Kumarc, R. Sathishd, Optimization and Non-destructive Test Analysis of SS316L Weldments Using GTAW, Materials Research., 2014.
[4] G. Magudeeswaran, Sreehari R. Nair, L. Sundar, Optimization of process parameters of the activated tungsten inert gas welding for aspect ratio of UNS S32205 duplex stainless steel welds, Defense Technology, Elsevier,2014.
[5] N. Kiaee, M. Aghaie-Khafri , Optimization of gas tungsten arc welding process by response surface methodology ,Materials and Design,2014.
[6] M.T.Z. Butt, M.S. Ahmad and M. Azhar , Characterization for GTAW AISI 316 To AISI 316 & SA 516 Grade 70 Steels with welded & pre welded annealing condition, Quality and technology management,2014.