R E V I E W
Open Access
Multi-omics approaches to disease
Yehudit Hasin
1,3, Marcus Seldin
1and Aldons Lusis
1,2,3*Abstract
High-throughput technologies have revolutionized medical research. The advent of genotyping arrays enabled large-scale genome-wide association studies and methods for examining global transcript levels, which gave rise to the field of“integrative genetics”. Other omics technologies, such as proteomics and metabolomics, are now often incorporated into the everyday methodology of biological researchers. In this review, we provide an overview of such omics technologies and focus on methods for their
integration across multiple omics layers. As compared to studies of a single omics type, multi-omics offers the opportunity to understand the flow of information that underlies disease.
Introduction
The addition of “omics” to a molecular term implies a comprehensive, or global, assessment of a set of mole-cules (http://omics.org/). The first omics discipline to appear, genomics, focused on the study of entire ge-nomes as opposed to “genetics” that interrogated indi-vidual variants or single genes. Genomic studies provided a very useful framework for mapping and studying specific genetic variants contributing to both mendelian and complex diseases. The omics field has been driven largely by technological advances that have made possible cost-efficient, high-throughput analysis of biologic molecules. For example, the “expression array”, based on hybridization of cDNA to arrays of oligo-nucleotide capture probes, was developed in the late 1990s. With refinement, array technologies proved cap-able of quantifying the levels of all protein coding tran-scripts in a particular tissue. The ability to survey global gene expression patterns quickly found application in
* Correspondence:[email protected]
1
Department of Medicine, University of California, 10833 Le Conte Avenue, A2-237 CHS, Los Angeles, CA 90095, USA
2Department of Microbiology, Immunology and Molecular Genetics, 10833
Le Conte Avenue, A2-237 CHS, Los Angeles, CA 90095, USA Full list of author information is available at the end of the article
many fields of biology, including the analysis of disease. In the early 2000s, array technologies also made it pos-sible to map loci that control gene expression, termed expression quantitative trait loci (eQTL), which have proved invaluable in the interpretation of genome-wide association studies (GWAS) and the modeling of biologic networks. Since then, many other omics technologies have been developed that are capable of interrogation of entire pools of transcripts, proteins, and metabolites, as well as the genome (Box 1).
In the past decade, high-throughput genotyping, com-bined with the development of a high quality reference map of the human genome, rigorous statistical tools, and large coordinated cohorts of thousands of patients, has enabled the mapping of thousands of genetic variants, both rare and common, contributing to disease [1–3]. However, as our power to identify genetic variants associ-ated with complex disease increased several realizations were reached that have shaped subsequent approaches to elucidating the causes of disease. First, the loci that have been identified so far generally explain only a fraction of the heritable component for specific diseases. Second, while Mendelian diseases generally result from changes in coding regions of genes, common diseases usually result from changes in gene regulation. Third, the same genetic variants often contribute to different final outcomes, de-pending on the environment and genetic background. Taken together, these realizations provided a rationale for the development of systems biology technologies that in-volve the integration of different omics data types to iden-tify molecular patterns associated with disease.
Each type of omics data, on its own, typically provides a list of differences associated with the disease. These data can be useful both as markers of the disease process and to give insight as to which biological pathways or processes are different between the disease and control groups. However, analysis of only one data type is lim-ited to correlations, mostly reflecting reactive processes rather than causative ones. Integration of different omics data types is often used to elucidate potential causative changes that lead to disease, or the treatment targets, that can be then tested in further molecular studies.
In this review, we focus on the integration of mul-tiple types of omics data (“multi-omics” or “vertical omics”) as applied to research on human disease. This review is divided into three sections. First, we outline considerations that apply to experimental design and
collection of omics data. Second, we discuss general frameworks for integration of omics data in disease research and outline analytic strategies. Finally, we speculate about the future directions of multi-omics approaches.
Box 1. Omics data types
Genomicsis the most mature of the omics fields. In the realm of medical research, genomics focuses on identifying genetic variants associated
with disease, response to treatment, or future patient prognosis. GWAS is a successful approach that has been used to identify thousands of genetic variants associated with complex diseases (GWAS cataloghttps://www.ebi.ac.uk/gwas/home) in multiple human populations. In such studies, thousands of individuals are genotyped for more than a million genetic markers, and statistically significant differences in minor allele frequencies between cases and controls are considered evidence of association. GWAS studies provide an invaluable contribution to our
understanding of complex phenotypes. Associated technologies include genotype arrays [111–114], NGS for whole-genome sequencing [115,116], and exome sequencing [117].
Epigenomicsfocuses on genome-wide characterization of reversible modifications of DNA or DNA-associated proteins, such as DNA methylation
or histone acetylation. Covalent modifications of DNA and histones are major regulators of gene transcription and subsequently of cellular fate [118]. Those modifications can be influenced both by genetic and environmental factors, can be long lasting, and are sometimes heritable [119–121]. While the role of epigenetic modifications as mediators of transgenerational environmental effects remains controversial [122,123], their importance in biological processes and disease development is evident from many epigenome-wide association studies that have been reported. For example, differentially methylated regions of DNA can be used as indicators of disease status for metabolic syndrome [124,125], cardiovascular disease [126], cancer [127], and many other pathophysiologic states [128]. Epigenetic signatures are often tissue-specific [129], and several large consortia are focusing on establishing comprehensive epigenomic maps in multiple human tissues (Roadmap Epigenomics (http://www.roadmapepigenomics.org/) and International Human Epigenome Consortium (http://ihec-epigenomes.org/)). Thus, in addition to insight gained from identifying epigenetic
modifications correlating with diseases, data generated by these studies has great potential to enhance our functional interpretation of genetic variants residing in those regions or of epigenetic markers associated with disease independently of genetic variation ([130] and other Roadmap Epigenomics publications). Associated technology includes assessment of DNA modifications using NGS [130].
Transcriptomicsexamines RNA levels genome-wide, both qualitatively (which transcripts are present, identification of novel splice sites, RNA
editing sites) and quantitatively (how much of each transcript is expressed). The central dogma of biology viewed RNA as a molecular intermediate between DNA and proteins, which are considered the primary functional read-out of DNA. Other examples of RNA function, such as structural (e.g., ribosomal complexes), or regulatory (e.g., Xist in ChrX inactivation) have often been regarded as odd exceptions to the general rule. The advent of large transcriptomic studies in the past decade has shown that while only ~3% of the genome encodes proteins, up to 80% of the genome is transcribed [131]. RNA-Seq studies identified thousands of novel isoforms and showed a larger than previously appreciated complexity of the protein-coding transcriptome [132]. However, an even more significant contribution of these studies was the development of the non-coding RNA field. It is now clear that thousands of long non-coding RNAs transcribed in mammalian cells (http://www.gencodegenes.org/) play essential roles in many physiological processes, for example, brown adipose differentiation [133], endocrine regulation [134], and neuron development [135]. Dysregulation of long non-coding RNAs had been implicated in various diseases, such as myocardial infarction [136], diabetes [137,138], cancer [139], and others [140]. In addition to long non-coding RNA, NGS allows interrogation of short RNAs (microRNAs, piwi-interacting RNAs, and small nuclear RNAs) and identification of circular RNAs, a novel player in the family of RNAs [141]. Much like long non-coding RNAs, a growing body of evidence points to dysregulation of short and circular RNAs in disease [142–144] and the potential use thereof as biomarkers or as therapeutic targets. Associated technologies include probe-based arrays [145,146] and RNA-Seq [147,148].
Proteomicsis used to quantify peptide abundance, modification, and interaction. The analysis and quantification of proteins has been revolutionized
by MS-based methods and, recently, these have been adapted for high-throughput analyses of thousands of proteins in cells or body fluids [149,150]. Interactions between proteins can be detected by classic unbiased methods such as phage display and yeast two-hybrid assays. Affinity purification methods, in which one molecule is isolated using an antibody or a genetic tag, can also be used. MS is then used to identify any associated proteins. Such affinity methods, sometimes coupled with chemical crosslinking, have been adapted to examine global interactions between proteins and nucleic acids (e.g., ChIP-Seq). Finally, the functions of a large fraction of proteins are mediated by post-translational modifications such as proteolysis,
glycosylation, phosphorylation, nitrosylation, and ubiquitination [151,152]. Such modifications play key roles in intracellular signaling, control of enzyme activity, protein turnover and transport, and maintaining overall cell structure [153]. MS can be used to directly measure such covalent modifications by defining the corresponding shift in the mass of the protein (in comparison to the unmodified peptide). There are efforts to develop genome-level analyses of such modifications [154]. Associated technologies include MS-based approaches to investigate global proteome interactions and quantification of post-translational modifications [155,156].
Metabolomicssimultaneously quantifies multiple small molecule types, such as amino acids, fatty acids, carbohydrates, or other products of
cellular metabolic functions. Metabolite levels and relative ratios reflect metabolic function, and out of normal range perturbations are often indicative of disease. Quantitative measures of metabolite levels have made possible the discovery of novel genetic loci regulating small molecules, or their relative ratios, in plasma and other tissues [157–160]. Additionally, metabolomics in combination with modeling has been used extensively to study metabolite flux. Associated technologies include MS-based approaches to quantify both relative and targeted small molecule abundances [161–166].
Microbiomicsis a fast-growing field in which all the microorganisms of a given community are investigated together. Human skin, mucosal
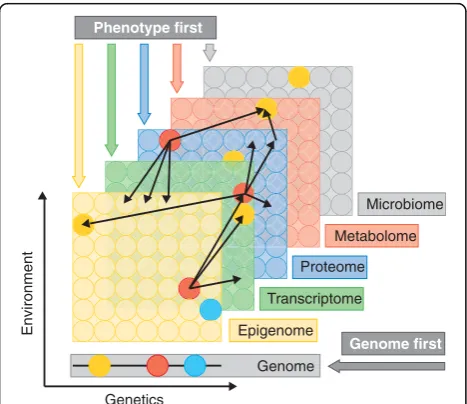
Considerations for the design of omics studies Compared to single omics interrogations (Box 1, Fig. 1), multi-omics can provide researchers with a greater un-derstanding of the flow of information, from the original cause of disease (genetic, environmental, or developmen-tal) to the functional consequences or relevant interac-tions [4, 5]. Omics studies, by their nature, rely on large numbers of comparisons, tailored statistical analyses, and a considerable investment of time, skilled man-power, and money. Therefore, careful planning and exe-cution are required. In this section, we discuss general experimental parameters that should be considered when planning an omics study.
Complexity of disease etiology
An important consideration in the design of a multi-omic study is the nature of the disorder. Simple diseases, arising from single gene mutations, involve few etio-logical factors, and those factors typically play determin-istic roles in disease development, although the severity or progression of many diseases is affected by “modifier genes” or environmental factors. For example, the most
common cause of cystic fibrosis is a single chloride channel mutation, enabling disease-related work to focus on the function of this gene [6]. Thus, concentrated omics efforts at specific time points, focusing on imme-diate molecular changes induced by the causative factor, are expected to produce sufficient insight to promote understanding of potential therapeutic strategies. Note that the prominent etiological factor does not have to be genetic and could, for example, be an infectious agent.
The etiology of complex diseases is far more intricate and is not centered on one specific factor. Different combinations of a variety of factors could converge into phenotypically similar states. Moreover, in the absence of a clear deterministic factor that induces the disease, results from a single layer of data are always associative and, because reactive effects usually outnumber the causative effects in biologic cascades, should be inter-preted as such. Additionally, given that most common, complex diseases develop over time and involve both en-vironmental and genetic factors, full mechanistic insight will require coordinated sets of several omics data at multiple time points, collected from many disease rele-vant tissues.
Downstream analysis, sample sizes, and power
Omics approaches generate data to provide biological insight based on statistical inference from datasets that are typically large. As such, the power to detect associa-tions or the flow of information strongly depends on ef-fect size, heterogeneity of the background noise, and sample size, with the latter often being the only param-eter controlled by researchers. Unfortunately, human studies are affected by a multitude of confounding fac-tors that are difficult or impossible to control for (e.g., diet and lifestyle choices). Thus, the ability of omics ap-proaches to produce meaningful insight into human dis-ease is very much dependent on available sample sizes, and in many settings an underpowered study may not only be a shot in the dark, missing true signals, but it is also more likely to produce false positive results. This issue is well illustrated in the earlier days of candidate gene studies for complex diseases, where lack of appreci-ation of these factors led to many publicappreci-ations of non-reproducible genetic associations. An initial power cal-culation to ensure sufficient sample size and variation in outcomes is increasingly necessary in large-scale studies.
Another potential pitfall of omics approaches is insuf-ficient attention to data analysis requirements, before and during data collection. General analytical pipelines for each type of omics data are available (Box 1); how-ever, most omics fields have not yet developed an agreed gold standard. Moreover, these datasets are often large and complex, and require tailoring of the general statis-tical approach to the specific dataset. An important Genetics
Epigenome Genome
Genome first Transcriptome
Proteome Metabolome
Microbiome Phenotype first
Environment
Fig. 1Multiple omics data types and approaches to disease research. Layers depict different types of omics data (Box 1). Omics data are collected on the entire pool of molecules, represented as
[image:3.595.57.291.369.571.2]aspect of all omics study designs, to make sure that the collected data meet analysis requirements, is to envision the main goal of analysis and the analytical approach, before collecting the data. For example, a common con-sideration when planning RNA-Seq experiments would be the allocation of financial resources to balance the number of samples with depth of coverage. To identify differentially expressed genes between the cases and controls, the power provided by more samples is gener-ally preferable to the increased accuracy provided by higher depth of sequencing. However, if the main pur-pose of the analysis is to identify new transcripts, or examine allele-specific expression, the higher depth of coverage is desirable [7–9] (https://genome.ucsc.edu/ ENCODE/protocols/dataStandards/RNA_standards_v1_ 2011_May.pdf ). In addition to financial limitations, data analysis should guide data collection to avoid or minimize technical artifacts, such as batch effects that could be introduced during all steps of sample process-ing and data acquisition [10–13]. In large studies, some technical artifacts cannot be avoided, and in these cases it is crucial to understand to what extent those artifacts limit our ability to draw conclusions from observations, and possibly introduce controls that would be able to quantify its effect.
Human studies and animal models of disease
Both human and animal model omics studies provide important insight into disease. Humans are the main intended beneficiary of medical research, and naturally findings from human studies have greater translational potential than animal models. Several human centric consortia have produced a large body of transcriptomics and epigenomics data in multiple tissues, for example, the Roadmap Epigenomics Project (http://www.roadma-pepigenomics.org/; Box 1) and GTEx (http://www.gtex-portal.org/home/) analyzed epigenomic signatures and transcriptomics in dozens of human tissues and cell types. In addition, several large biobanks have been cre-ated to collect, store, and analyze thousands of human samples related to diseases. For example, the National Institute of Health and Care in Finland developed a net-work of biobanks across the country [14] to collect spec-imens and measurements from patients with different diseases. The UK biobank [15] collects samples and physiologic measures and follows 500,000 people with respect to their activity. These samples can be character-ized with various omics approaches and used to identify molecular changes that occur during disease, or prior to it when prospective data are available.
While providing useful insight, human omics studies suffer from several limitations that can be addressed in animal studies only, provided the appropriate animal model of the disease is used. One could argue that
primary human cell lines represent a suitable platform to explore disease without the need for animal models, and indeed cell lines have been used quite extensively to dissect detailed individual mechanistic pathways [16]. But their use is limited by the complex nature and con-vergence of multiple cell types causing most complex diseases. The advantages of using animal models include reproducibility, control of environmental factors, acces-sibility of relevant tissues, accurate phenotyping, avail-ability of a virtually unlimited number of exact biological replicates, and the ability to experimentally follow up on hypotheses. Animal studies have been essential for examining the effects of environmental stressors such as responses to variation in diet, which often provide mechanistic insight into the relationship between omics data and the response to a stressor. Additionally, renew-able populations of animal models, such as inbred strains of rats or mice, can be interrogated repeatedly and omics studies of such populations have led to the development of powerful datasets containing detailed omic, physio-logical, and pathological data collected under a variety of conditions [17–19]. Comparison of omics data between human and animal models can help validate biological relevance of the model itself, as was used in a recent study of Alzheimer’s disease (AD) [20]. Yet, animal models also have limitations. Many of the gene-specific models are limited to one genetic background, mouse models may not recapitulate the human biology of complex disease, and some manifestations of human disease can be difficult to test in the mouse model.
Approaches to integrative analysis of multiple omics data
Multi-omics approaches have been applied to a wide range of biological problems and we have grouped these into three categories, “genome first”, “phenotype first”, and “environment first”, depending on the initial focus of the investigation. Thus, the genome first approach seeks to determine the mechanisms by which GWAS loci contribute to disease. The phenotype first approach seeks to understand the pathways contributing to disease without centering the investigation on a particular locus. And the environment first approach examines the envir-onment as a primary variable, asking how it perturbs pathways or interacts with genetic variation. We then discuss briefly some statistical issues around data inte-gration across omics layers and network modeling.
The genome first approach
disease. Such variants constitute a very powerful anchor point for mechanistic studies of disease etiology and mod-eling interactions of other omics layers. GWASs often identify loci harboring the causal variants, but lack suffi-cient power to distinguish them from nearby variants that are associated with disease only by virtue of their linkage to the causative variant. Moreover, the identified loci typ-ically contain multiple genes, which from a genomic point of view could equally contribute to disease. Thus, al-though GWAS results may be immediately useful for risk prediction purposes, they do not directly implicate a par-ticular gene or pathway, let alone suggest a therapeutic target. Locus-centered integration of additional omics
layers can help to identify causal single nucleotide poly-morphisms (SNPs) and genes at GWAS loci and then to examine how these perturb pathways leading to disease.
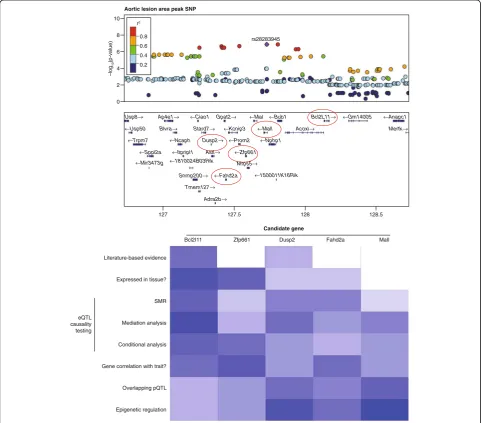
Analyses of causal variants at GWAS loci focused ori-ginally on coding regions, but it has become clear that for many common diseases regulatory variation explains most of the risk burden [21]. Thus, transcriptomics, employing either expression arrays or RNA-Seq (Box 1), has proven to be particularly useful for identifying causal genes at GWAS loci [16, 22–24]. A number of statistical methods have been developed for examining causality based on eQTL at GWAS loci, including conditional analysis and mediation analysis (Fig. 2). Large datasets of
Usp8→ Ap4e1→
Blvra→ Stard7→
Dusp2→
Mrps5→
Snrnp200→
Tmem127→
Astl→
Acoxl→ Mertk→
Gpat2→ Bcl2L11→ ←Ciao1
←Usp50
←Mal
←Kcnip3 ←Mall
10 r2
8 0.8 rs28283945
Aortic lesion area peak SNP
0.6 0.4 0.2
–log
10
(p-value)
6
4
2
0
127 127.5 128
Candidate gene
Bcl2I11
Literature-based evidence
Expressed in tissue?
SMR
Mediation analysis eQTL
causality testing
Conditional analysis
Gene correlation with trait?
Overlapping pQTL
Epigenetic regulation
Zfp661 Dusp2 Fahd2a Mall
128.5 ←Nphp1
←Zfp661
←Fahd2a ←1500011K16Rik
Adra2b→ ←1810024B03Rik
←Mir3473g
←Prom2
←Ncaph
←Trpm7
←Sppl2a ←Itpripl1
←Bub1 ←Gm14005 ←Anapc1
[image:5.595.57.540.252.675.2]eQTLs are now available for a number of tissues in humans and animal models [17, 22, 25, 26].
Identification of causal DNA variants affecting gene expression is complicated as a variety of elements, within the gene and hundreds of kilobases away from the gene, can contribute. Results from the ENCODE (Encyclopedia of DNA elements) and RoadMap Consor-tia have been particularly useful in this regard for defin-ing enhancer and promoters in a variety of tissues in mice and humans (Box 1, Fig. 3). Once the causal vari-ants or gene have been established, other omics layers can help identify the downstream interactions or path-ways. As discussed further below, transcript levels often exhibit poor correlation with protein levels and thus
proteomics data are expected to be more proximal to disease mechanisms. Moreover, proteomics techniques such as yeast two-hybrid screens or“pulldown analyses” can be used to identify interacting pathways contributing to disease [27]. For certain disorders, metabolomics can also be used to bridge genotype to phenotype [28].
A good example of a genome first approach is the study by Claussnitzer and colleagues [16] that involved analysis of the FTO locus that harbors the strongest as-sociation with obesity (Fig. 3). To identify the cell type in which the causal variant acts, they examined chroma-tin state maps of the region across 127 cell types that were previously profiled by the Roadmap Epigenomics Project (Box 1). A long enhancer active in mesenchymal
a
FTO GWAS locus FTO IRX3 IRX5d
Functional mechanismNormal haplotype
Risk haplotype
Chromatin capturing
Computational prediction of rs1421085 as the causative SNP
Correlation and enrichment analysis
Tissue specific inhibition of IRX3 In vitro assays of IRX3 and IRX5
Lipid storage Lipid catabolism Mitochondrial function Adipocyte differentiation
rs1421085 TT→CC CRISPR–Cas9 editing
b
Epigenomec
TranscriptomeFig. 3Genome first approach at FTO GWAS locus. Claussnitzer et al [16] combined genomics, epigenomics, transcriptomics, and phylogenetic analysis to identify the functional element, the causative SNP, and the downstream genes mediating the genetic effect at the FTO locus in obesity.Circlesrepresent genes in the locus andyellow circlesrepresent genes implicated by the respective omics data.aGenomics: the FTO locus, containing several genes (circles), harbors the most significant obesity-associated haplotype in humans. SNPs that are in linkage disequilibrium with the risk allele are color coded—bluerepresents the non-risk (normal) haplotype andredthe risk haplotype.bEpigenomics: publically available epigenomic maps and functional assays were used to narrow down the original associated region to 10 kb containing an adipose-specific enhancer. Chromatin capturing (Hi-C) was used to identify genes interacting with this enhancer.cTranscriptomics: this technique was used to identify which of the candidate genes are differentially expressed between the risk and normal haplotypes, identifying IRX3 and IRX5 as the likely downstream targets. In addition, conservation analysis suggested that rs1421085 (SNP that disrupts an ARID5B binding motif) is the causative SNP at the FTO locus. CRISPR-Cas9 editing of rs1421085 from background (TT) to risk allele (CC) was sufficient to explain the observed differences in expression of IRX3 and IRX5.
[image:6.595.58.539.272.603.2]adipocyte progenitors was shown to differ in activity be-tween risk and non-risk haplotype. They then surveyed long-range three-dimensional chromatin (Hi-C) interac-tions involving the enhancer and identified two genes, IRX3 and IRX5, the expression of which correlated with the risk haplotype across 20 risk-allele and 18 non-risk-allele carriers. To identify the affected biologic processes, Claussnitzer and colleagues examined correlations be-tween the expression of IRX3 and IRX5 with other genes in adipose tissue from a cohort of ten individuals. Sub-stantial enrichment for genes involved in mitochondrial functions and lipid metabolism was observed, which suggests possible roles in thermogenesis. Further work using trans-eQTL analysis of the FTO locus suggested an effect on genes involved in adipocyte browning. Adipocyte size and mitochondrial DNA content were then studied for 24 risk alleles and 34 non-risk alleles and shown to differ significantly, consistent with an adipocyte-autonomous effect on energy balance. Clauss-nitzer and colleagues confirmed the roles of IRX2 and IRX5 using experimental manipulation in primary adipo-cytes and in mice. Finally, the causal variant at the FTO locus was predicted using cross-species conservation and targeted editing with CRISPR-Cas9 identified a sin-gle nucleotide variant that disrupts ARID5B repressor binding.
The phenotype first approach
A different way to utilize omics data to augment our un-derstanding of disease is to simply test for correlations between disease, or factors associated with disease, and omics-based data. Once different entities of omics data are found to correlate with a particular phenotype, they can be fitted into a logical framework that indicates the affected pathways and provide insight into the role of different factors in disease development.
For example, Gjoneska et al. [20] used transcriptomic and epigenomic data to show that genomic and environ-mental contributions to AD act through different cell types. The authors first identified groups of genes that reflect transient or sustained changes in gene expression and cell populations during AD development. Consistent with the pathophysiology of AD, the transcriptomic data showed a sustained increase in immune-related genes, while synaptic and learning functions showed a sustained decrease. The authors then used chromatin immunoprecipitation and next-generation sequencing (NGS) to profile seven different epigenetic modifications that mark distinct functional chro-matin states. They were able to identify thousands of pro-moters and enhancers that showed significantly different chromatin states in AD versus control. Next, the authors showed that these epigenetic changes correspond to the ob-served changes in gene expression, and used enrichment analysis to identify five transcription factor motifs enriched
in the activated promoters and enhancers and two in the repressed elements. Finally, the authors used available GWAS data to see whether genetic variants associated with AD overlap any of the functional regions they identified. Notably, they found that AD-associated genetic variants are significantly enriched in the immune function-related hancers but not promoters or neuronal function-related en-hancers. This led the authors to suggest that the genetic predisposition to AD acts mostly through dysregulation of immune functions, whereas epigenetic changes in the neur-onal cells are mostly environmentally driven.
In another example, Lundby and colleagues [29] used quantitative tissue-specific interaction proteomics, com-bined with data from GWAS studies, to identify a net-work of genes involved in cardiac arrhythmias. The authors began by selecting five genes underlying Men-delian forms of long QT syndrome, and immunoprecipi-tated the corresponding proteins from lysates of mouse hearts. Using mass spectrometry (MS), they then identi-fied 584 proteins that co-precipitated with the five target proteins, reflecting potential protein–protein interac-tions. Notably, many of these 584 proteins were previ-ously shown to interact with ion channels, further validating the physiological relevance of this experiment. They then compared this list of proteins with the genes located in 35 GWAS loci for common forms of QT-interval variation, and identified 12 genes that over-lapped between the two sets. This study provides a mechanistic link between specific genes in some of the GWAS loci to the genotype in question, which suggests a causative link in the locus.
The environment first approach
In this approach, multi-omics analyses are used to inves-tigate the mechanistic links to disease using an environ-mental factor such as diet as the variable. To accurately assess environmental or control factors such as the diet in humans is very difficult and so animal models have proven particularly valuable for examining the impact of the environment on disease. Here, we give three exam-ples of multi-omic study designs used to examine the impact of the environment on disease.
have profound effects on health parameters later in life, offering mechanistic insight into how this is achieved.
The second study design seeks to understand the in-teractions between genetics and the environment. For example, Parks and coworkers [31, 32] recently studied the effects of a high fat, high sucrose diet across about 100 different inbred strains of mice. By examining global gene expression in multiple tissues and metabolites in plasma, they were able to identify pathways and genes contributing to diet-induced obesity and diabetes. In the case of dietary factors, the gut microbiome introduces an additional layer of complexity as it is highly respon-sive to dietary challenges and also contributes signifi-cantly to host physiology and disease. Recent multi-omic studies [31, 33, 34] have revealed an impact of gut microbiota on host responses to dietary challenge and on epigenetic programming.
The third type of study design involves statistical mod-eling of metabolite fluxes in response to specific sub-strates. For example, the integration of bibliographic, metabolomic, and genomic data have been used to re-construct the dynamic range of metabolome flow of or-ganisms, first performed in Escherichia coli [35] and since extended to yeast [36, 37] and to individual tissues in mice [38] and humans [39]. Other applications have explored various connections between metabolome models and other layers of information, including the transcriptome [40] and proteome [41–43]. Refine-ment of these techniques and subsequent application to larger population-wide datasets will likely lead to eluci-dation of novel key regulatory nodes in metabolite control.
Integration of data across multi-omics layers
A variety of approaches can be used to integrate data across multiple omics layers depending on the study de-sign [44]. Two frequently used approaches involve sim-ple correlation or co-mapping. Thus, if two omics elements share a common driver, or if one perturbs the other, they will exhibit correlation or association (Fig. 4). A number of specialized statistical approaches that often rely on conditioning have been developed. In these ap-proaches a statistical model is used to assess whether each element of the model—for example, a SNP and ex-pression change—contributes to the disease independ-ently versus one being the function of the other. For example, a regression-based method termed “mediation analysis” was developed to integrate SNP and gene expression data, treating the gene expression as the me-diator in the causal mechanism from SNPs to disease [45, 46]. Similar approaches have been applied to other omics layers [46, 47]. More broadly, multi-layer omics can be modeled as networks, based on a data-driven ap-proach or with the support of prior knowledge of
molecular networks. A practical consideration in multi-omic studies is the correlation of identities of the same ob-jects across omics layers, known as ID conversion. This is performed using pathway databases such as KEGG and cross-reference tables [47]. Ideally, the multi-omics data-sets will be collected on the same set of samples, but this is not always possible; GWAS and expression data are fre-quently collected from different subjects. In such cases, it is possible to infer genetic signatures (eQTL) or pheno-types based on genopheno-types [48–50].
Investigating the quantitative rules that govern the flow of information from one layer to another is also im-portant when modeling multiple data types. For ex-ample, one of the fundamental assumptions behind many of the RNA co-expression networks is that fluctu-ations in RNA abundance are mirrored by proteins. However, while the tools for effective interrogation of transcriptome are widely available and commonly used, effective interrogation of proteomes at the population level is a relatively new possibility (Box 1). A number of studies have now shown that while levels of many pro-teins are strongly correlated with their transcript levels, with coincident eQTL and protein QTL (pQTL), the correlations for most protein–transcript pairs are mod-est [51–58]. The observed discordance of transcript and protein levels is likely to be explained by regulation of translation, post-translation modifications, and protein turnover. Together these studies suggest that RNA may be a good predictor of abundance of only some proteins, identifying groups of genes that confer to this rule and those that do not. In the context of disease oriented re-search, such studies constitute an important step for cre-ating an analytical framework that will later be applied to interpretation of disease-specific datasets. In addition, especially in context of limited availability of human samples, such studies are useful for choosing among possible experimental approaches.
interactions can also be measured across different layers, such as in ChIP-Seq, which quantifies DNA binding by specific proteins.
For studies of disease, co-expression networks can be constructed based on variations in gene expression that occur among control and affected individuals separately [72–74]. Comparison of network architecture between control and disease groups allows the identification of closely connected nodes (“modules”) most correlated with disease status. In general, co-expression or interaction net-works are“undirected”in the sense that the causal nature of the interactions is unknown. Interaction networks can be experimentally tested, although the high number of suggestive interactions identified in each study makes in-discriminate testing prohibitive. If genetic data, such as GWAS loci for disease or eQTLs for genes, are available it may be possible to infer causality using DNA as an anchor [75–77]. Such integration of gen- etic information with network modeling has been used to highlight pathways that contribute to disease and to identify “key drivers” in biologic processes [72–74, 78]. For example, Marbach and colleagues [79] combined genomics, epigenomics, and transcriptomics to elucidate tissue-specific regulatory cir-cuits in 394 human cell types. They then overlaid the GWAS results of diseases onto tissue-specific regulatory networks in the disease-relevant tissues and identified modules particularly enriched for genetic variants in each disease. In another example, Zhang and coworkers [64] examined transcript levels from brains of individuals with late onset AD and analyzed co-expression and Bayesian causal modeling to identify modules associated with dis-ease and key driver genes important in disdis-ease regulatory pathways. Together, these studies illustrate how network analysis can be used to narrow down the focus of disease research into specific functional aspects of particular cell types or tissues, considerably facilitating downstream mechanistic efforts and hypothesis generation.
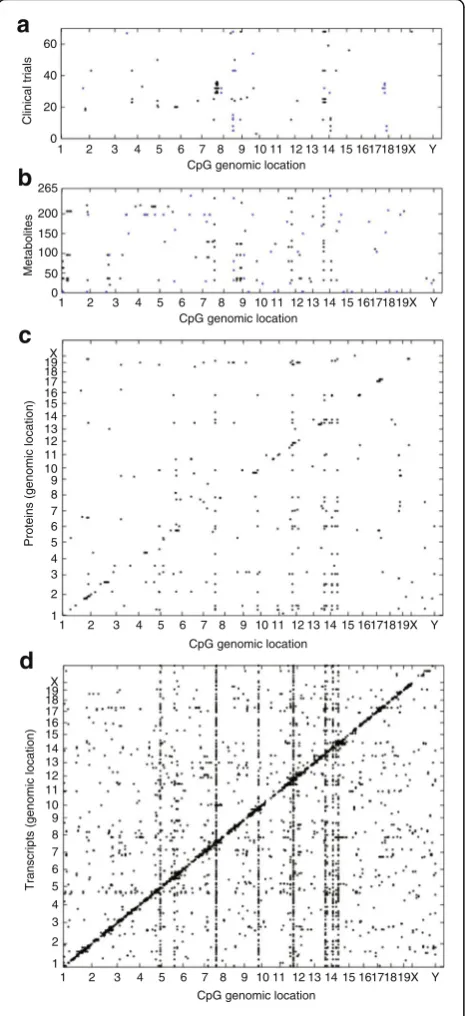
a
60
Clinical trials
b
Metabolites
c
Proteins (genomic location)
d
Transcripts (genomic location)
CpG genomic location CpG genomic location CpG genomic location
CpG genomic location 40
20
0
265
X 19 18 17 16 15 14 13 12 11 10 9 8 7 6 5 4 3
2
1
X 19 18 17 16 15 14 13 12 11 10 9 8 7 6 5
4 3
2
1 200
150
100
50
0
1 2 3 4 5 6 7 8 9 10 11 12 13 14 15 16171819X Y
1 2 3 4 5 6 7 8 9 10 11 12 13 14 15 16171819X Y
1 2 3 4 5 6 7 8 9 10 11 12 13 14 15 16171819X Y
1 2 3 4 5 6 7 8 9 10 11 12 13 14 15 16171819X Y
Fig. 4The flow of biologic information from liver DNA methylation to liver transcripts, proteins, metabolites, and clinical traits. A panel of 90 different inbred strains of mice were examined for DNA methylation levels in liver using bisulfite sequencing. CpGs with hypervariable methylation were then tested for association with clinical traits such asaobesity and diabetes,bliver metabolite levels,cliver protein levels, anddliver transcript levels. Eachdotis a significant association at the corresponding Bonferroni thresholds across CpGs with the clinical traits and metabolite, protein, and transcript levels in liver. The genomic positions of hypervariable CpGs are plotted on thex-axisand the positions of genes encoding the proteins or transcripts are plotted on they-axis. The positions of clinical traits and metabolites on they-axisare arbitrary. The
diagonal line of dotsobserved to be associated with methylation in the protein and transcript data represent local eQTL and pQTL. The
[image:9.595.58.291.89.598.2]Current challenges and future directions Reference populations and phenotyping
Insights gained from omics approaches to disease are mostly comparative. We compare omics data from healthy and diseased individuals and assume that this difference is directly related to disease. However, in complex phenotypes both“healthy” and“disease”groups are heterogeneous with respect to many confounding factors such as population structure, cell type compos-ition bias in sample ascertainment, batch effects, and other unknown factors.
One strategy to overcome the heterogeneity associated with any human population is the “reductionist ap-proach”, which aims to match as closely as possible groups of patients and controls to eliminate many of the environmental factors from this comparison. The prob-lem with this approach is two-fold. First, we do not know about every possible confounding factor, and thus we can only account for known sources of variation (for example, sex, BMI, age, and diet in metabolic disease). And second, insight is limited to the variable factors in-cluded in the study, which might not apply when consid-ering the whole spectrum of disease population or might be entirely secondary to a factor that was excluded. In contrast, an integrative omics approach often relies on a “holistic” view, which attempts to interrogate a suffi-ciently large number of individuals and incorporate the many sources of variability into statistical models. The differences observed between disease and healthy state are then compared to identify factors that have a larger contribution to the disease. Thus, a crucial aspect for success of omics studies is the collection of large data-sets that accurately capture sources of variance in the background population (or “healthy” individuals). Col-lection of such data is becoming feasible. The increasing popularity of lifestyle tracking devices and social media has created an unprecedented opportunity for studying environmental factors that contribute to disease devel-opment and progression on a large scale, and further in-tegration with omics data may provide additional guidance for personalization of treatment. A recent study used an integrative omics approach in personal-ized nutrition. Zeevi et al. [80] used combinatorial ana-lysis of questionnaire data, microbiome data, plasma parameters, and a meal diary among 800 individuals to predict postprandial glycemic index, which was used to provide accurate information on dietary regimens to im-prove metabolic homeostasis.
The power of omics approaches, and their greatest challenge, will be the ability to integrate multiple axes of variance into background models, rather than research-ing age, sex, time, and population specific instances. Thus, we expect future application of omics technologies to focus on understudied groups, particularly in the sex
specificity context, to fill substantial gaps in our know-ledge and lead to the development of more informative models of biological context of disease. Sex is one of the major determinants of biological function, and most dis-eases show some extent of sex dimorphism [81]. Thus, any personalized treatment approaches will have to take sex into account. Indeed, the National Institutes of Health has recognized that need recently and explicitly drives biomedical research towards sex-balanced studies (http://grants.nih.gov/grants/guide/notice-files/NOT-OD-15-102.html).
Human populations that can be interrogated at mul-tiple omics levels or examined under a variety of envir-onmental conditions are proving particularly powerful. For example, the MuTher study [82], consisting of sev-eral hundred female twins from the UK, has been evalu-ated globally at the genome, transcriptome, metabolome, and microbiome levels. Data from this study have yielded a variety of important conclusions, including in-sights into the genetic control of molecular traits, novel pathways involved in metabolic syndrome, and the herit-ability of gut microbiota [78]. Twin studies are particu-larly powerful in their ability to accurately estimate heritability of traits. Another human reference popula-tion is the Metabolic Syndrome In Man (METSIM) co-hort of about 10,000 Finnish men aged 45–65 years from the Kuopio region in Finland. As with the MuTher population, METSIM individuals have been characterized clinically for a variety of metabolic and cardiovascular traits at the genomic, transcriptomic, and metabolomics levels [83–85]. The METSIM population is especially ap-pealing given the broad spectrum of metabolic measure-ments and subsequent follow-ups.
Technological advances and resolution
has been utilized to elucidate novel signaling mecha-nisms [66]. Beyond the phosphoproteome, omics ana-lyses have drawn notable links between human disease and the genetic control of global glycosylation [68], ubi-quitination [67, 69], and many other protein modifica-tions. Continued improvements in these approaches will further our understanding of protein functions.
Recent technological advances have also allowed for NGS to be performed on single cells [89], an area which has received considerable attention [90]. RNA-Seq using a single-cell approach has shown substantial heterogeneity of cell types in various tissues and eluci-dated novel cell populations [91, 92]. Beyond sequen-cing the transcriptome of single cells, this technology has been extended to the genome [93] and DNA methylome [94–96]. Bisulfite sequencing of single cells has shown substantial variations in the pattern of DNA methylation across cells residing in the same tissues, presenting a unique opportunity to explore combina-torial roles for differing cell types presented with a similar “environmental exposure”. Single cell analysis also allows quantification and identification of the omics changes that are observed at the tissue level that are attributable to changes in cell type composition, rather than changes in the respective omics profile of specific cell types—an important aspect of disease physiology.
Analytical challenges
One obvious advantage of large omics datasets is their enduring availability—once the data are collected, they can be reanalyzed with multiple approaches over and over again. Thus, development of statistical methods to extract more information from existent data types is an important part of the omics field. While every omics field presents specific challenges in terms of technical ar-tifacts, a common analytical challenge to all omics fields is distinguishing causal changes from reactive ones in the context of disease. This is particularly difficult because of the correlative nature of each dataset, and potentially impossible if relying on one omics data type collected at one time point, such as the expression in tissues in healthy and diseased individuals postmortem. Development of approaches to differentiate causal changes versus correlative changes should address two questions: first, identifying the variation that causes or drives the association with phenotype; and second, eluci-dating whether that variation precedes the trait or occurs as a result of it. Notably, genomic changes associ-ated with disease are presumed to precede it, and there-fore the question of causality in GWAS loci comes down to identifying the precise variant driving the correlation. Several approaches have been developed to identify drivers of the correlation signals in genomic or
transcriptomic data [11, 97, 98]. However, when the drivers of correlation are identified, with the exception of genomics, differentiating causality from correlation based on omics analysis remains an open question. We envision that development of better statistical methods, overlaying of multiple coordinated data types, prospect-ive studies in humans, and time-course studies in animal models will help narrow the candidates to sufficiently small numbers that can efficiently be tested in cellular and animal models. Yet, the final proof of causation that relates a particular change to a particular phenotype is likely, for the foreseeable future, to rely on molecular studies in vivo and in vitro.
Conceptual shift
The future of medical research envisions personalized treatments, prospective tracking of individual health in-dicators, and a focus on preventive measures that inte-grate into our way of life. A proof of concept study [99] shows that prospective tracking of health with multiple omics approaches could highlight indicators of disease prior to the development of disease, and that beneficial changes in lifestyle might help to prevent it. Further-more, applications of omics technologies within a clin-ical setting can be used in personalized medicine, guided by genome sequence. A poster-child example of such has been implemented through the Vanderbilt PREDICT project [100], whereby genotyping information is gath-ered and referenced to patient data throughout the treat-ment process to identify individual variants that affect clinical outcomes.
consortia may focus on tissue specificity [101], particular disease, or resource development.
Effective and sensible use of publicly available data requires a standard, easily communicable terminology and methodology in all aspects of data collections and analysis—sometimes even at the expense of precision or optimization. Common usage of omics technologies necessitates standardization to allow sufficient integra-tion across studies, an area which becomes increasingly difficult with greater variability and complexity of measurement. For example, RNA-Seq expression stud-ies are only comparable if the same genome version, transcript annotation, and quantification tools are used for all datasets, while new versions of these are pub-lished on a regular basis. For this reason, consortia pro-vide both a large body of data but also detailed analysis pipelines that can be replicated for other datasets with minimal effort. Standardization becomes particularly challenging when measuring various phenotypes and relating from one study to another. Suggestions have been made to apply standardization across measured phenomes. For example, various high-throughput bio-logic assays have been developed to screen mutagenized mice [102–104] or zebrafish [105]. Such assays can be thought of as “subphenotypes” of disease, likely to be much less genetically complex (and, therefore, easier to dissect) than the disease itself. Additional efforts have been made to apply a“phenomics” approach to under-stand human disease [106]. We believe that further im-provement in streamlining the analysis of specific data types, and development of a gold standard for analysis flow, will facilitate new discoveries and shorten the time taken from the generation of data to publication and translation to clinics. Notably, this facet of omics re-search is particularly vulnerable not only to technical problems (e.g., use of different protocols and analysis pipe-lines, changes in data ID numbers, lack of standard no-menclature, etc.), but also to social behavior that drives cutting edge research. A glaring example of this psycho-logical gap was recently demonstrated by the“data para-sites” editorial in a prominent medical journal [107], and the prompt stormy reaction in scientific and social outlets that followed [108–110]. This incident highlights that suc-cessful application of the omics approach does not depend solely on technical factors but requires a serious concep-tual shift in research paradigm for many researchers and clinicians, and potentially in our approach to medical and scientific training and performance evaluation.
Abbreviations
AD:Alzheimer’s disease; eQTL: Expression quantitative trait loci; GWAS: Genome-wide association studies; MS: Mass spectrometry; NGS: Next-generation sequencing; pQTL: Protein quantitative trait loci; SNP: Single-nucleotide polymorphism
Acknowledgements
We would like to thank Rosa Chen for help with manuscript preparation.
Funding
NIH-T32HL69766 (MMS), NIH-T32HL007895 (MMS), NIH-HL30568 (AJL), NIH-HL123295 (AJL), NIH-HL114437 (AJL) and NIH-HL28481 (AJL).
Authors’contributions
YHB, MMS, and AJL designed and prepared the manuscript and revised and discussed crucial changes. All authors read and approved the final manuscript.
Competing interests
The authors declare that they have no competing interests.
Publisher’s Note
Springer Nature remains neutral with regard to jurisdictional claims in published maps and institutional affiliations.
Author details
1
Department of Medicine, University of California, 10833 Le Conte Avenue, A2-237 CHS, Los Angeles, CA 90095, USA.2Department of Microbiology, Immunology and Molecular Genetics, 10833 Le Conte Avenue, A2-237 CHS, Los Angeles, CA 90095, USA.3Department of Human Genetics, University of California, 10833 Le Conte Avenue, A2-237 CHS, Los Angeles, CA 90095, USA.
References
1. LaFramboise T. Single nucleotide polymorphism arrays: a decade of biological, computational and technological advances. Nucleic Acids Res. 2009;37:4181–93. 2. Begum F, Ghosh D, Tseng GC, Feingold E. Comprehensive literature review and
statistical considerations for GWAS meta-analysis. Nucleic Acids Res. 2012;40:3777–84. 3. Manolio TA. Genomewide association studies and assessment of the risk of
disease. N Engl J Med. 2010;363:166–76.
4. Gibson G. A primer of human genetics. 1st ed. Sunderland (Massachusetts): Sinauer Associates, Inc.; 2015.
5. Civelek M, Lusis AJ. Systems genetics approaches to understand complex traits. Nat Rev Genet. 2014;15:34–48.
6. Welsh MJ, Smith AE. Molecular mechanisms of CFTR chloride channel dysfunction in cystic fibrosis. Cell. 1993;73:1251–4.
7. Schurch NJ, Schofield P, Gierlinski M, Cole C, Sherstnev A, Singh V, et al. How many biological replicates are needed in an RNA-seq experiment and which differential expression tool should you use? RNA. 2016;22:839–51. 8. Conesa A, Madrigal P, Tarazona S, Gomez-Cabrero D, Cervera A, McPherson A,
et al. A survey of best practices for RNA-seq data analysis. Genome Biol. 2016; 17:13.
9. Williams AG, Thomas S, Wyman SK, Holloway AK. RNA-seq data: challenges in and recommendations for experimental design and analysis. Curr Protoc Hum Genet. 2014;83:11.13.1–11.13.20.
10. Gilad Y, Mizrahi-Man O. A reanalysis of mouse ENCODE comparative gene expression data. F1000Res. 2015;4:121.
11. Peixoto L, Risso D, Poplawski SG, Wimmer ME, Speed TP, Wood MA, et al. How data analysis affects power, reproducibility and biological insight of RNA-seq studies in complex datasets. Nucleic Acids Res. 2015;43:7664–74. 12. SEQC/MAQC-III Consortium. A comprehensive assessment of RNA-seq
accuracy, reproducibility and information content by the Sequencing Quality Control Consortium. Nat Biotechnol. 2014;32:903–14.
13. Hartley SW, Mullikin JC. QoRTs: a comprehensive toolset for quality control and data processing of RNA-Seq experiments. BMC Bioinformatics. 2015;16:224. 14. Biobanking and Biomolecular resources Research Infrastructure. http://
bbmri-eric.eu/. Accessed 15 Nov 2014.
15. Sudlow C, Gallacher J, Allen N, Beral V, Burton P, Danesh J, Downey P, Elliott P, Green J, Landray M, et al. UK biobank: an open access resource for identifying the causes of a wide range of complex diseases of middle and old age. PLoS Med. 2015;12:e1001779.
16. Claussnitzer M, Dankel SN, Kim KH, Quon G, Meuleman W, Haugen C, et al. FTO obesity variant circuitry and adipocyte browning in humans. N Engl J Med. 2015;373:895–907.
18. Gatti DM, Svenson KL, Shabalin A, Wu LY, Valdar W, Simecek P, et al. Quantitative trait locus mapping methods for diversity outbred mice. G3 (Bethesda). 2014;4:1623–33.
19. Threadgill DW, Churchill GA. Ten years of the Collaborative Cross. Genetics. 2012;190:291–4.
20. Gjoneska E, Pfenning AR, Mathys H, Quon G, Kundaje A, Tsai LH, et al. Conserved epigenomic signals in mice and humans reveal immune basis of Alzheimer’s disease. Nature. 2015;518:365–9.
21. Wahl S, Drong A, Lehne B, Loh M, Scott WR, Kunze S, et al. Epigenome-wide association study of body mass index and the adverse outcomes of adiposity. Nature. 2016;541:81–6.
22. Brem RB, Kruglyak L. The landscape of genetic complexity across 5,700 gene expression traits in yeast. Proc Natl Acad Sci U S A. 2005;102:1572–7. 23. Braenne I, Civelek M, Vilne B, Di Narzo A, Johnson AD, Zhao Y, et al.
Prediction of causal candidate genes in coronary artery disease loci. Arterioscler Thromb Vasc Biol. 2015;35:2207–17.
24. Musunuru K, Strong A, Frank-Kamenetsky M, Lee NE, Ahfeldt T, Sachs KV, et al. From noncoding variant to phenotype via SORT1 at the 1p13 cholesterol locus. Nature. 2010;466:714–9.
25. Consortium GT. The genotype-tissue expression (GTEx) project. Nat Genet. 2013;45:580–5.
26. Doss S, Schadt EE, Drake TA, Lusis AJ. Cis-acting expression quantitative trait loci in mice. Genome Res. 2005;15:681–91.
27. Behrends C, Sowa ME, Gygi SP, Harper JW. Network organization of the human autophagy system. Nature. 2010;466:68–76.
28. Hartiala JA, Tang WH, Wang Z, Crow AL, Stewart AF, Roberts R, et al. Genome-wide association study and targeted metabolomics identifies sex-specific association of CPS1 with coronary artery disease. Nat Commun. 2016;7:10558. 29. Lundby A, Rossin EJ, Steffensen AB, Acha MR, Newton-Cheh C, Pfeufer A,
et al. Annotation of loci from genome-wide association studies using tissue-specific quantitative interaction proteomics. Nat Methods. 2014;11:868–74. 30. Solon-Biet SM, McMahon AC, Ballard JW, Ruohonen K, Wu LE, Cogger VC, et al.
The ratio of macronutrients, not caloric intake, dictates cardiometabolic health, aging, and longevity in ad libitum-fed mice. Cell Metab. 2014;19:418–30. 31. Parks BW, Nam E, Org E, Kostem E, Norheim F, Hui ST, et al. Genetic control
of obesity and gut microbiota composition in response to fat, high-sucrose diet in mice. Cell Metab. 2013;17:141–52.
32. Parks BW, Sallam T, Mehrabian M, Psychogios N, Hui ST, Norheim F, et al. Genetic architecture of insulin resistance in the mouse. Cell Metab. 2015;21:334–46. 33. Org E, Parks BW, Joo JW, Emert B, Schwartzman W, Kang EY, et al. Genetic
and environmental control of host-gut microbiota interactions. Genome Res. 2015;25:1558–69.
34. Plovier H, Everard A, Druart C, Depommier C, Van Hul M, Geurts L, et al. A purified membrane protein from Akkermansia muciniphila or the pasteurized bacterium improves metabolism in obese and diabetic mice. Nat Med. 2017;23:107–13.
35. Edwards JS, Palsson BO. TheEscherichia coliMG1655 in silico metabolic genotype: its definition, characteristics, and capabilities. Proc Natl Acad Sci U S A. 2000;97:5528–33.
36. Forster J, Famili I, Fu P, Palsson BO, Nielsen J. Genome-scale reconstruction of theSaccharomyces cerevisiaemetabolic network. Genome Res. 2003;13:244–53. 37. Herrgard MJ, Swainston N, Dobson P, Dunn WB, Arga KY, Arvas M, et al. A
consensus yeast metabolic network reconstruction obtained from a community approach to systems biology. Nat Biotechnol. 2008;26:1155–60. 38. Sigurdsson MI, Jamshidi N, Steingrimsson E, Thiele I, Palsson BO. A detailed
genome-wide reconstruction of mouse metabolism based on human Recon 1. BMC Syst Biol. 2010;4:140.
39. Rolfsson O, Palsson BO, Thiele I. The human metabolic reconstruction Recon 1 directs hypotheses of novel human metabolic functions. BMC Syst Biol. 2011;5:155. 40. Saito K, Hirai MY, Yonekura-Sakakibara K. Decoding genes with coexpression networks and metabolomics– ‘majority report by precogs’. Trends Plant Sci. 2008;13:36–43.
41. Yizhak K, Benyamini T, Liebermeister W, Ruppin E, Shlomi T. Integrating quantitative proteomics and metabolomics with a genome-scale metabolic network model. Bioinformatics. 2010;26:i255–60.
42. Mayr M, Yusuf S, Weir G, Chung YL, Mayr U, Yin X, et al. Combined metabolomic and proteomic analysis of human atrial fibrillation. J Am Coll Cardiol. 2008;51:585–94.
43. Saghatelian A, Cravatt BF. Global strategies to integrate the proteome and metabolome. Curr Opin Chem Biol. 2005;9:62–8.
44. Palsson B, Zengler K. The challenges of integrating multi-omic data sets. Nat Chem Biol. 2010;6:787–9.
45. Huang YT, Vanderweele TJ, Lin X. Joint analysis of snp and gene expression data in genetic association studies of complex diseases. Ann Appl Stat. 2014;8:352–76.
46. Sun YV, Hu YJ. Integrative analysis of multi-omics data for discovery and functional studies of complex human diseases. Adv Genet. 2016;93:147–90. 47. Yugi K, Kubota H, Hatano A, Kuroda S. Trans-Omics: how to reconstruct
biochemical networks across multiple‘omic’layers. Trends Biotechnol. 2016;34:276–90.
48. Gusev A, Ko A, Shi H, Bhatia G, Chung W, Penninx BW, et al. Integrative approaches for large-scale transcriptome-wide association studies. Nat Genet. 2016;48:245–52.
49. He X, Fuller CK, Song Y, Meng Q, Zhang B, Yang X, et al. Sherlock: detecting gene-disease associations by matching patterns of expression QTL and GWAS. Am J Hum Genet. 2013;92:667–80.
50. Hormozdiari F, Kang EY, Bilow M, Ben-David E, Vulpe C, McLachlan S, et al. Imputing phenotypes for genome-wide association studies. Am J Hum Genet. 2016;99:89–103.
51. Battle A, Khan Z, Wang SH, Mitrano A, Ford MJ, Pritchard JK, et al. Genomic variation. Impact of regulatory variation from RNA to protein. Science. 2015;347:664–7.
52. Chick JM, Munger SC, Simecek P, Huttlin EL, Choi K, Gatti DM, et al. Defining the consequences of genetic variation on a proteome-wide scale. Nature. 2016;534:500–5.
53. Foss EJ, Radulovic D, Shaffer SA, Ruderfer DM, Bedalov A, Goodlett DR, et al. Genetic basis of proteome variation in yeast. Nat Genet. 2007;39:1369–75. 54. Ghazalpour A, Bennett B, Petyuk VA, Orozco L, Hagopian R, Mungrue IN,
et al. Comparative analysis of proteome and transcriptome variation in mouse. PLoS Genet. 2011;7:e1001393.
55. McAlister GC, Nusinow DP, Jedrychowski MP, Wuhr M, Huttlin EL, Erickson BK, et al. MultiNotch MS3 enables accurate, sensitive, and multiplexed detection of differential expression across cancer cell line proteomes. Anal Chem. 2014;86:7150–8.
56. Ting L, Rad R, Gygi SP, Haas W. MS3 eliminates ratio distortion in isobaric multiplexed quantitative proteomics. Nat Methods. 2011;8:937–40. 57. Williams EG, Wu Y, Jha P, Dubuis S, Blattmann P, Argmann CA, et al. Systems
proteomics of liver mitochondria function. Science. 2016;352:aad0189. 58. Wu Y, Williams EG, Dubuis S, Mottis A, Jovaisaite V, Houten SM, et al.
Multilayered genetic and omics dissection of mitochondrial activity in a mouse reference population. Cell. 2014;158:1415–30.
59. Collins FS, Green ED, Guttmacher AE, Guyer MS, Institute USNHGR. A vision for the future of genomics research. Nature. 2003;422:835–47.
60. Barabasi AL, Bonabeau E. Scale-free networks. Sci Am. 2003;288:60–9. 61. Huan T, Zhang B, Wang Z, Joehanes R, Zhu J, Johnson AD, et al. A systems
biology framework identifies molecular underpinnings of coronary heart disease. Arterioscler Thromb Vasc Biol. 2013;33:1427–34.
62. Newman MEJ. Networks: an introduction. 1st ed. Oxford: Oxford University Press; 2010.
63. Subramaniam S, Nadeau JH. Systems medicine–viewed through the real and computing lenses. Wiley Interdiscip Rev Syst Biol Med. 2010;2:383–4. 64. Zhang B, Gaiteri C, Bodea LG, Wang Z, McElwee J, Podtelezhnikov AA, et al.
Integrated systems approach identifies genetic nodes and networks in late-onset Alzheimer’s disease. Cell. 2013;153:707–20.
65. Jeong H, Tombor B, Albert R, Oltvai ZN, Barabasi AL. The large-scale organization of metabolic networks. Nature. 2000;407:651–4. 66. Ravasz E, Somera AL, Mongru DA, Oltvai ZN, Barabasi AL. Hierarchical
organization of modularity in metabolic networks. Science. 2002;297:1551–5. 67. Ghazalpour A, Doss S, Zhang B, Wang S, Plaisier C, Castellanos R, et al.
Integrating genetic and network analysis to characterize genes related to mouse weight. PLoS Genet. 2006;2:e130.
68. Langfelder P, Horvath S. Epigene networks for studying the relationships between co-expression modules. BMC Syst Biol. 2007;1:54.
69. Neto EC, Keller MP, Attie AD, Yandell BS. Causal graphical models in systems genetics: a unified framework for joint inference of causal network and genetic architecture for correlated phenotypes. Ann Appl Stat. 2010;4:320–39. 70. Rao VS, Srinivas K, Sujini GN, Kumar GN. Protein–protein interaction detection: methods and analysis. Int J Proteomics. 2014;2014:147648. 71. Vidal M, Cusick ME, Barabasi AL. Interactome networks and human disease.
72. Emilsson V, Thorleifsson G, Zhang B, Leonardson AS, Zink F, Zhu J, et al. Genetics of gene expression and its effect on disease. Nature. 2008;452:423–8. 73. Romanoski CE, Che N, Yin F, Mai N, Pouldar D, Civelek M, et al. Network for activation of human endothelial cells by oxidized phospholipids: a critical role of heme oxygenase 1. Circ Res. 2011;109:e27–41.
74. Sarwar R, Cook SA. Genomic analysis of left ventricular remodeling. Circulation. 2009;120:437–44.
75. Aten JE, Fuller TF, Lusis AJ, Horvath S. Using genetic markers to orient the edges in quantitative trait networks: the NEO software. BMC Syst Biol. 2008;2:34. 76. Schadt EE, Lamb J, Yang X, Zhu J, Edwards S, Guhathakurta D, et al.
An integrative genomics approach to infer causal associations between gene expression and disease. Nat Genet. 2005;37:710–17.
77. Yang X, Deignan JL, Qi H, Zhu J, Qian S, Zhong J, et al. Validation of candidate causal genes for obesity that affect shared metabolic pathways and networks. Nat Genet. 2009;41:415–23.
78. Heinig M, Petretto E, Wallace C, Bottolo L, Rotival M, Lu H, et al. A trans-acting locus regulates an anti-viral expression network and type 1 diabetes risk. Nature. 2010;467:460–4.
79. Marbach D, Lamparter D, Quon G, Kellis M, Kutalik Z, Bergmann S. Tissue-specific regulatory circuits reveal variable modular perturbations across complex diseases. Nat Methods. 2016;13:366–70.
80. Zeevi D, Korem T, Zmora N, Israeli D, Rothschild D, Weinberger A, et al. Personalized nutrition by prediction of glycemic responses. Cell. 2015;163:1079–94. 81. Arnold AP, van Nas A, Lusis AJ. Systems biology asks new questions about
sex differences. Trends Endocrinol Metab. 2009;20:471–6. 82. Nica AC, Parts L, Glass D, Nisbet J, Barrett A, Sekowska M, et al. The
architecture of gene regulatory variation across multiple human tissues: the MuTHER study. PLoS Genet. 2011;7:e1002003.
83. Civelek M, Wu Y, Pan C, Raulerson CK, Ko A, He A, et al. Genetic regulation of adipose gene expression and cardio-metabolic traits. Am J Hum Genet. 2017;100:428–43.
84. Laakso M, Kuusisto J, Stancakova A, Kuulasmaa T, Pajukanta P, Lusis AJ, et al. The metabolic syndrome in men study: a resource for studies of metabolic and cardiovascular diseases. J Lipid Res. 2017;58:481–93.
85. Fizelova M, Jauhiainen R, Stancakova A, Kuusisto J, Laakso M. Finnish diabetes risk score is associated with impaired insulin secretion and insulin sensitivity, drug-treated hypertension and cardiovascular disease: a follow-up study of the METSIM cohort. PLoS One. 2016;11:e0166584.
86. Ley RE, Turnbaugh PJ, Klein S, Gordon JI. Microbial ecology: human gut microbes associated with obesity. Nature. 2006;444:1022–3.
87. Ridaura VK, Faith JJ, Rey FE, Cheng J, Duncan AE, Kau AL, et al. Gut microbiota from twins discordant for obesity modulate metabolism in mice. Science. 2013;341:1241214.
88. Hsiao EY, McBride SW, Hsien S, Sharon G, Hyde ER, McCue T, et al. Microbiota modulate behavioral and physiological abnormalities associated with neurodevelopmental disorders. Cell. 2013;155:1451–63.
89. Tang F, Barbacioru C, Wang Y, Nordman E, Lee C, Xu N, et al. mRNA-Seq whole-transcriptome analysis of a single cell. Nat Methods. 2009;6: 377–82.
90. Shapiro E, Biezuner T, Linnarsson S. Single-cell sequencing-based technologies will revolutionize whole-organism science. Nat Rev Genet. 2013;14:618–30.
91. Grun D, Lyubimova A, Kester L, Wiebrands K, Basak O, Sasaki N, et al. Single-cell messenger RNA sequencing reveals rare intestinal Single-cell types. Nature. 2015;525:251–5.
92. Jaitin DA, Kenigsberg E, Keren-Shaul H, Elefant N, Paul F, Zaretsky I, et al. Massively parallel single-cell RNA-seq for marker-free decomposition of tissues into cell types. Science. 2014;343:776–9.
93. Knouse KA, Wu J, Whittaker CA, Amon A. Single cell sequencing reveals low levels of aneuploidy across mammalian tissues. Proc Natl Acad Sci U S A. 2014;111:13409–14.
94. Guo H, Zhu P, Wu X, Li X, Wen L, Tang F. Single-cell methylome landscapes of mouse embryonic stem cells and early embryos analyzed using reduced representation bisulfite sequencing. Genome Res. 2013;23:2126–35. 95. Gravina S, Dong X, Yu B, Vijg J. Single-cell genome-wide bisulfite
sequencing uncovers extensive heterogeneity in the mouse liver methylome. Genome Biol. 2016;17:150.
96. Farlik M, Sheffield NC, Nuzzo A, Datlinger P, Schonegger A, Klughammer J, et al. Single-cell DNA methylome sequencing and bioinformatic inference of epigenomic cell-state dynamics. Cell Rep. 2015;10:1386–97.
97. Hooper LV, Macpherson AJ. Immune adaptations that maintain homeostasis with the intestinal microbiota. Nat Rev Immunol. 2010;10:159–69. 98. Turnbaugh PJ, Ley RE, Hamady M, Fraser-Liggett CM, Knight R, Gordon JI.
The human microbiome project. Nature. 2007;449:804–10.
99. Chen R, Mias GI, Li-Pook-Than J, Jiang L, Lam HY, Chen R, et al. Personal omics profiling reveals dynamic molecular and medical phenotypes. Cell. 2012;148:1293–307.
100. Pulley JM, Denny JC, Peterson JF, Bernard GR, Vnencak-Jones CL, Ramirez AH, et al. Operational implementation of prospective genotyping for personalized medicine: the design of the Vanderbilt PREDICT project. Clin Pharmacol Ther. 2012;92:87–95.
101. Bernstein BE, Stamatoyannopoulos JA, Costello JF, Ren B, Milosavljevic A, Meissner A, et al. The NIH roadmap epigenomics mapping consortium. Nat Biotechnol. 2010;28:1045–8.
102. Papathanasiou P, Goodnow CC. Connecting mammalian genome with phenome by ENU mouse mutagenesis: gene combinations specifying the immune system. Annu Rev Genet. 2005;39:241–62.
103. Grubb SC, Bult CJ, Bogue MA. Mouse phenome database. Nucleic Acids Res. 2014;42:D825–34.
104. Aigner B, Rathkolb B, Herbach N, Kemter E, Schessl C, Klaften M, et al. Screening for increased plasma urea levels in a large-scale ENU mouse mutagenesis project reveals kidney disease models. Am J Physiol Renal Physiol. 2007;292:F1560–7.
105. Cheng KC, Xin X, Clark DP, La Riviere P. Whole-animal imaging, gene function, and the zebrafish phenome project. Curr Opin Genet Dev. 2011;21:620–9.
106. Freimer N, Sabatti C. The human phenome project. Nat Genet. 2003;34:15–21. 107. Longo DL, Drazen JM. Data sharing. N Engl J Med. 2016;374:276–7. 108. Valencia A, Markel S, Gaeta B, Gaasterland T, Lengauer T, Berger B, et al.
ISCB’s initial reaction to New England Journal of Medicine editorial on data sharing. F1000Res. 2016;5:157.
109. Bonnie B, Theresa G, Thomas L, Christine AO, Bruno G, Scott M, et al. ISCB’s initial reaction to New England Journal of Medicine editorial on data sharing. PLoS Comput Biol. 2016;12:e1004816.
110. Drazen JM. Data sharing and the journal. N Engl J Med. 2016;374:e24. 111. Voight BF, Kang HM, Ding J, Palmer CD, Sidore C, Chines PS, et al.
The metabochip, a custom genotyping array for genetic studies of metabolic, cardiovascular, and anthropometric traits. PLoS Genet. 2012;8:e1002793.
112. Ragoussis J. Genotyping technologies for genetic research. Annu Rev Genomics Hum Genet. 2009;10:117–33.
113. Hirschhorn JN, Daly MJ. Genome-wide association studies for common diseases and complex traits. Nat Rev Genet. 2005;6:95–108.
114. Wang WY, Barratt BJ, Clayton DG, Todd JA. Genome-wide association studies: theoretical and practical concerns. Nat Rev Genet. 2005;6:109–18. 115. Koboldt DC, Steinberg KM, Larson DE, Wilson RK, Mardis ER. The next-generation
sequencing revolution and its impact on genomics. Cell. 2013;155:27–38. 116. Cirulli ET, Goldstein DB. Uncovering the roles of rare variants in common
disease through whole-genome sequencing. Nat Rev Genet. 2010;11:415–25. 117. Ng SB, Turner EH, Robertson PD, Flygare SD, Bigham AW, Lee C, et al.
Nature. 2009;461:272–6.
118. Piunti A, Shilatifard A. Epigenetic balance of gene expression by Polycomb and COMPASS families. Science. 2016;352:aad9780.
119. Gut P, Verdin E. The nexus of chromatin regulation and intermediary metabolism. Nature. 2013;502:489–98.
120. Liu L, Li Y, Tollefsbol TO. Gene–environment interactions and epigenetic basis of human diseases. Curr Issues Mol Biol. 2008;10:25–36. 121. Taudt A, Colome-Tatche M, Johannes F. Genetic sources of population
epigenomic variation. Nat Rev Genet. 2016;17:319–32.
122. Barres R, Zierath JR. The role of diet and exercise in the transgenerational epigenetic landscape of T2DM. Nat Rev Endocrinol. 2016;12:441–51. 123. Nestler EJ. Transgenerational epigenetic contributions to stress responses:
fact or fiction? PLoS Biol. 2016;14:e1002426.
124. Horvath S. DNA methylation age of human tissues and cell types. Genome Biol. 2013;14:R115.
125. Multhaup ML, Seldin MM, Jaffe AE, Lei X, Kirchner H, Mondal P, et al. Mouse–human experimental epigenetic analysis unmasks dietary targets and genetic liability for diabetic phenotypes. Cell Metab. 2015;21:138–49. 126. Kim M, Long TI, Arakawa K, Wang R, Yu MC, Laird PW. DNA methylation as a
![Fig. 3 Genome first approach at FTO GWAS locus. Claussnitzer et al [16] combined genomics, epigenomics, transcriptomics, and phylogeneticthe candidate genes are differentially expressed between the risk and normal haplotypes, identifying IRX3 and IRX5 as t](https://thumb-us.123doks.com/thumbv2/123dok_us/8596431.864641/6.595.58.539.272.603/claussnitzer-epigenomics-transcriptomics-phylogeneticthe-differentially-expressed-haplotypes-identifying.webp)