Problem solving in Linear Equations using a
graphing calculator
Mary Ann Serdina Parrot, University of Malaya, Malaysia
Leong Kwan Eu, University of Malaya, Malaysia
Introduction
With advances in information and communication technology, it is not possible to avoid the impact of technology on mathematical problem solving. Among those technologies, there has been a steady increase in interest in using hand-held technologies, in particular graphing calculators, by mathematics educators and curriculum developers and teachers (Kissane, 2000). Using graphing calculators in learning mathematics will allow students to explore and model mathematical problems and create multiple representations of mathematical problems. Technology that supports multiple representations can increase students’ use of visualization in problem solving and enhance understanding (Center for Technology in Learning, 2007).
Literature review
Students need to learn to solve problems because this is a skill needed for success in life. To become a good problem solver in mathematics, one must develop a base of mathematics knowledge (Wilson, Fernandez, & Hadaway, 1993). In Malaysia, studies have shown that students faced difficulty in mathematics especially in problem solving because they lacked understanding and were unable to retrieve concepts, formulae, facts and procedures: they lacked the ability to visualize mathematics problems and concepts, ineffectively executed logical thinking and had poor strategic knowledge in problem solving (Kadir et al., 2003; Tambychik, 2005; Tay, 2005). A study conducted on 242 Form Four students to evaluate the level of Malaysian students’ problem-solving ability showed that students have a fairly good command of basic knowledge and skills, but they did not show the use of problem-solving strategies. The mastery of problem solving skills among Malaysian students remains at a low level (Zanzali & Lui, 1999). In the Programme for International Student Assessment (PISA) on problem solving, Malaysia ranked 39th out of 44 countries, with a mean score of 422 which is below the OECD average (OECD, 2014).
Graphing calculators
Graphic calculators are handheld, battery powered devices equipped with functions to plot graphs; give numerical solutions to equations; perform statistical calculations; operate on matrices, and; perform more advanced mathematical functions, such as algebra, geometry and advanced statistics (Kor & Lim, 2003). Demana and Waits noted that, “the use of handheld technology can provide more classroom time for the development of better understanding of mathematical concepts by eliminating the time spent on mindless paper-and-pencil manipulations” (Waits & Demana, 1998). The graphing calculator as new technology brought many exciting changes in the mathematics curriculum (Choi-Koh, 2003).
recommendations for best uses of the TI-Nspire CX based on analysis by SRI International (2006).
Problem solving using a graphing calculator
Problem solving with a graphing calculator can be enhanced on many levels. It can be argued that the highest level integrates graphical analysis and that the lowest level involves simple arithmetic (Crippen, 1999). According to Kutzler, using graphing calculators in teaching means that educators or teachers can tackle more complex and realistic problems. Kutzler proposed three steps characterizing problem solving with the use of a graphing calculator (Kutzler, 2000).
The first step is choosing the model and translating the real world problem into the language of the model, which requires us to grasp and understand the problem. The second step is applying the available algorithms to solve the model problem, and yield a solution. Students use the graphing calculator in this phase to calculate and solve. The final step is to translate the model solution into a real world solution. A graphing calculator can be used to check the answer.
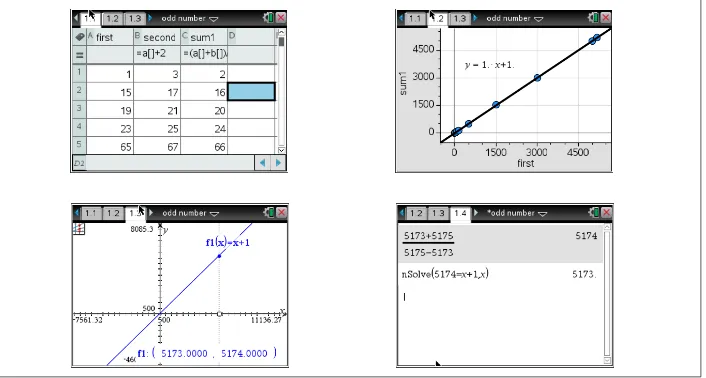
Problem 1: The number 5174 is the sum of two consecutive odd integers divided by the difference between the two consecutive odd integers. What are the two odd integers?
The first step according to Kutzler is to translate words into mathematical expressions or symbols. By using the List and Spreadsheet application, each column is given to each variable. Data and Statistics application allows the students to generate the mathematical equation from the data on variables in the List and Spreadsheet page. From the model problem, instead of solving the linear equation using an algebraic procedure, the graphical approach becomes the main strategy. Finally, the solution requires a final check to justify the answer by using the Calculator application.
[image:2.499.73.426.410.599.2]
Researchers in different settings have investigated various studies regarding graphing calculator usage in teaching, learning, achievement and attitude in various domains of mathematics. Rich (1991)
,
in a study of two high school pre-calculus classes, found that students were more willing to tackle problem solving activities when they had access to graphing calculators. The students were also able to solve non-routine problems that might have been too difficult for them without the availability of a graphing utility; this permitted the introduction of problem solving situations that were of interest to the students.Purpose and research questions
The purpose of this study was to investigate the impact of graphing calculators on students’ ability in solving problems involving linear equations and their attitude toward problem solving in mathematics. The study was guided by the following research questions:
1. Is there a significant difference in students’ ability to solve linear equation problems between the experimental and control groups?
2. Is there a significant difference in students’ attitude toward problem solving in mathematics between the experimental and control groups?
Methodology
The researcher chose to employ the quasi-experimental non-equivalent control-group design for the study. The population for the study included Form Four students in the state of Sarawak in Malaysia. The study took place in one of the public secondary schools, which has approximately 1500 students. The sample of this study consists of 60 Form Four students who are taking Mathematics as their core subject. Only two classes were randomly chosen as samples of this study. One of the classes served as the experimental group involved in using graphing calculators while the other class learned using the traditional approach.
At the beginning of this study, all participants were required to complete the pre-test. The experimental group was provided with graphing calculators and was allowed to use these to complete the test. Throughout this study, the control group received traditional instruction in learning the concept of linear equations and the experimental group received an intervention, which involved the use of graphing calculators in a problem-based learning environment. Approximately four weeks after the administration of the pre-test and upon completion of the series of lessons, participants of both groups were required to complete the post-test.
Instrumentation
of the Analytic Problem Solving Rubric developed by Charles, Lester and O’Daffer (1987) and Krulik and Rudnick (1998) which has been widely used in other problem solving research (Quinones, 2005; Rosli, Goldsby, & Capraro, 2013; Wittcop, 2008; Yeo, 2011).
The second instrument used to measure students’ attitude towards problem solving, was adopted from the student attitudes’ instrument developed by Charles, Lester, and O'Daffer (1987). The Mathematical Problem Solving Questionnaire contained 20 items, which utilizes the 5-point Likert scale. Item responses were coded so that a higher score indicated a more positive attitude toward problem solving. In general, a total score of 50 indicates a neutral attitude toward problem solving.
Results
Research question 1
[image:4.499.70.428.335.400.2]The first research question was analyzed using the independent t-test. The dependent variable is the students’ scores in the test and the independent variable is the treatment type for both groups. Independent t-test has three conditions: the independency of scores, normality and homogeneity of variances. The first condition is satisfied because data were collected from two different groups. To check on normality, Shapiro-Wilk’s test was used. Finally, Levene’s test of equality was used to determine the homogeneity of variances.
Table 1. Mean score differences between groups using independent t-test
Group Mean S.D. t-value Sig (2 tailed) Experimental
(n = 30) 7.50 3.57 1.99 .052 Control
(n = 30) 5.77 3.18
[image:4.499.71.430.489.548.2]Table 1 shows that the experimental group scored higher with a mean score of 7.50 while the control group obtained a mean score of 5.77. However, the p-value was 0.052 (p > .05) indicating that the difference in the mean score of the two groups was not significant. This result illustrated that both groups have similar abilities before the intervention was administered.
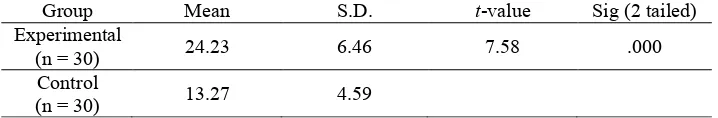
Table 2. Independent t-test for post-test
Group Mean S.D. t-value Sig (2 tailed) Experimental
(n = 30) 24.23 6.46 7.58 .000 Control
(n = 30) 13.27 4.59
[8.07, 13.86], t(58) = 7.58, p < .001. The effect size of this analysis (d = 1.95), was found to exceed Cohen’s (1988) convention for a large effect (d = .80). This indicates that approximately 97% students of the experimental group would score higher than the control group.
[image:5.499.73.431.244.306.2]Next, a paired-samples t-test was used to determine whether there was a statistically significant mean difference between the pre-test and post-test scores of both groups. Results for the test are shown in Table 3. The mean score difference between the post-test and pre-post-test of the experimental group was 16.73 as compared to the control group with 6.97. There was a significant difference between the pre-test and post-test means for both groups in favor of the post-test, experimental (t(29) = 16.20, p < .001, d = 2.96) and control (t(29) = 6.98, p < .001, d = 1.27). This implies that the individual students’ scores in the post-test were significantly higher than in the pre-test.
Table 3. Mean score differences between groups using paired samples
Group Mean S.D. t-value Sig (2 tailed) Experimental
(n = 30) 16.73 5.66 16.20 .000 Control
(n = 30) 7.50 5.89 6.98 .000
Research question 2
The second research question was addressed using data gathered from the Mathematical Problem Solving Questionnaire that measured the students’ attitude toward problem solving. The results are presented in Table 4 and Table 5.
Table 4. Overall mean differences between groups for pre-survey
Group Mean S.D. t-value Sig (2 tailed) Experimental
(n = 30) 59.27 6.97 -1.67 .099 Control
(n = 30) 62.00 5.58
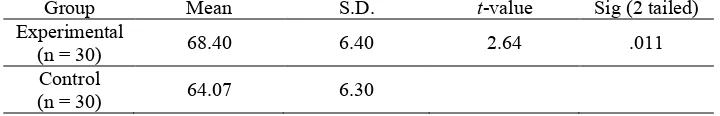
Table 5. Overall mean differences between groups for post-survey
Group Mean S.D. t-value Sig (2 tailed) Experimental
(n = 30) 68.40 6.40 2.64 .011 Control
(n = 30) 64.07 6.30
[image:5.499.70.430.470.528.2]control groups. These findings indicated that both groups had different attitudes toward problem solving in mathematics after the intervention. The experimental group had a more positive attitude towards problem solving in mathematics compared to the control group.
Discussion and conclusion
Problem solving is viewed as an important part of understanding and learning mathematics, and emphasis is increasingly being placed upon improving problem solving abilities in mathematics. It is therefore important to investigate ways to improve problem-solving skills, and using graphing calculators is one of the suggested ways. The purpose of the current study was to investigate the impact of a graphing calculator on students’ abilities to solve linear equation problems.
Previous research have shown that students who have access to graphing calculators scored significantly higher in problem solving compared to their counterparts who did not use graphing calculators (Allison, 2000; Bitter & Hatfield, 1991; Carter, 1995; Hatem, 2010; Rich, 1991; Tan, Harji, & Lau, 2011). These findings are compatible with the results obtained in this study. An independent sample t-test was conducted in order to determine whether there were significant differences between those using the traditional approach and those using graphing calculators. Results obtained showed that the experimental group that had access to graphing calculators during the lesson and test scored significantly higher than the control group. This indicates that the use of graphing calculators had a positive impact on students’ problem solving ability. This was supported by other researchers who reviewed that students are better problem solvers when graphing calculators are used in class and during assessment (Pilipczuk, 2006; Schrupp, 2007). However, the discrepancy in scores could also be due to either the teaching approach used or the individual differences in problem solving skills.
With respect to attitudes toward problem solving, students who received the intervention had a better outlook and perception on the problem-solving task compared to those who were taught using the traditional approach. This result supports the findings obtained by Szetela and Super (1987) and Dibble (2013) who reported that students had a better attitude toward problem solving when using the graphing calculator. This improved attitude stemmed from a variety of reasons. One unique feature in the graphing calculator technology is that it allows students to view more than one representation in the split-screen mode. This multiple representation of linear equations was in the form of graphical, tabular, and computation modes. The representation can be dynamically linked so that any changes made will result in changes to each representation. Students have more time to think about the problem without worrying about long algebraic procedures. Graphing calculators allow multiple representations of a concept and this makes it clearer and easier for students to understand. Thus, it is highly recommended that graphing calculators be used for a longer period until students become acquainted with the various functions available in the graphing calculator.
References
Allison, J. A. (2000). High school students' problem solving with a graphing calculator.
http://search.proquest.com/docview/304595892?accountid=28930 ProQuest Dissertations & Theses Global database.
Bitter, G. G. & Hatfield, M. M. (1991). Here's a math-teaching strategy that's calculated to work. Executive Educator, 13, 19-21.
Carter, H. H. (1995). A visual approach to understanding the function concept using
graphing calculators. (9602812 Ph.D.), Georgia State University, Ann Arbor.
Retrieved from http://search.proquest.com/docview/304199069?accountid=28930
ProQuest Dissertations & Theses Global database.
Center for Technology in Learning. (2007). Why should a teacher use technology in his or her mathematics classroom? United Kingdom: SRI International, Texas Instruments.
Charles, R. I., Lester, F. K., & O'Daffer, P. G. (1987). How to evaluate progress in
problem solving: National Council of Teachers of Mathematics.
Choi-Koh, S. S. (2003). Effect of a graphing calculator on a 10th-Grade student's study of Trigonometry. The Journal of Educational Research, 96(6), 359-368. doi: 10.1080/00220670309596619
Crippen, K. J. (1999). Problem solving suggestions for graphing calculators. from
http://dwb.unl.edu/calculators/help/variables.html
Dibble, A. J. (2013). Impact of Graphing Calculators on Students' Problem-Solving
Abilities and Students' Attitudes Towards Mathematics. (1523829 M.S.E.),
Southwest Minnesota State University, Ann Arbor. Retrieved from
http://search.proquest.com/docview/1441947194?accountid=28930 ProQuest
Dissertations & Theses Global database.
Hatem, N. (2010). The effect of graphing calculators on student achievement in college
algebra and pre-calculus mathematics courses. (3438537 Ed.D.), University of
Massachusetts Lowell, Ann Arbor. Retrieved from
http://search.proquest.com/docview/847259113?accountid=28930 ProQuest
Dissertations & Theses Global database.
Kadir, Z. A., Kadir, Z. A., Bejor, J., Nathiman, R., Moamed, B., & Khamis, J. (2003). Meningkatkan Kemahiran Membentuk Ungkapan Kuadratik. Jurnal Penyelidikan
Pendidikan, 7(2003), 12-19.
Kissane, B. (2000). Technology and the curriculum: The case of the graphics
calculator. Paper presented at the An International Conference on Technology in
Mathematics Education, Auckland, New Zealand.
Kor, L. K., & Lim, C. S. (2003). Learning statistics with graphic calculator: A case
study. Paper presented at the Proceedings of 1st National Conference on Graphing
Calculators, Penang, Malaysia.
Kutzler, B. (2000). The Algebraic Calculator as a Pedagogical Tool for Teaching Mathematics. International Journal of Computer Algebra in Mathematics
Education, 7(1), 5-23.
OECD. (2014). PISA 2012 Results: Creative Problem Solving (Vol. V): OECD Publishing.
Pilipczuk, C. H. (2006). The effect of graphing technology on students' understanding of
functions in a precalculus course. Retrieved from
http://search.proquest.com/docview/305324162?accountid=28930
Quinones, C. K. (2005). The Effects of Journal Writing on Student Attitudes and
Performance in Problem Solving. (Master of Education in K-8 Mathematics and
Rich, B. S. (1991). The effect of the use of graphing calculators on the learning of
function concepts in precalculus mathematics. (9112475 Ph.D.), The University of
Iowa, Ann Arbor. Retrieved from
http://search.proquest.com/docview/303868313?accountid=28930 ProQuest
Dissertations & Theses Global database.
Rosli, R., Goldsby, D., & Capraro, M. M. (2013). Assessing students’ mathematical problem-solving and problem-posing skills Asian Social Science;, 9(16), 7. doi: 10.5539/ass.v9n16p54
Schrupp, R. D. (2007). Effects of using graphing calculators to solve quadratics with
high school mathematics students. (1443824 M.S.E.), Southwest Minnesota State
University, Ann Arbor. Retrieved from
http://search.proquest.com/docview/304705471?accountid=28930 ProQuest
Dissertations & Theses Global database.
SRI International. (2006). TI-Nspire™ Math and Science Learning Handhelds: What Research Says and What Educators Can Do (pp. 27). Menlo Park, CA: SRI International.
Tambychik, T. (2005). Penggunaan Kaedah Nemonik Berirama dalam Pembelajaran
Matematik bagi Pelajar Lemah: Satu Kajian kes. (Master Degree), Universiti
Kebangsaan Malaysia, Malaysia.
Tan, C.-K., Harji, M. B., & Lau, S.-H. (2011). Graphing calculator for probability students: How was it perceived? IBIMA Business Review, 2011(2011). doi: 10.5171/2011.167702
Tay, L. H. (2005). Problem Solving Abilities and Strategies in Solving Multistep
Mathematical Problems among Form 2 Students. (Master Degree), University of
Malaya, Kuala Lumpur, Malaysia.
Waits, B. K., & Demana, F. (1998). The Role of Graphing Calculators in Mathematics Reform. In E. D. Laughbaum (Ed.), Hand-held technology in mathematics and
science education: A collection of papers (pp. 72-75). Columbus.
Wilson, J. W., Fernandez, M. L., & Hadaway, N. (1993). Mathematical problem solving. In P. S. Wilson (Ed.), Research Ideas for the Classroom: High School
Mathematics. New York: MacMillan.
Wittcop, M. A. (2008). The Effects of Problem Solving Strategy Instruction, Journal Writing and Discourse on 6th Grade Advanced Mathematics Student Performance.
(Master of Education), University of Central Florida, Orlando, Florida.
Yeo, K. K. J. (2011). An exploratory study of primary two pupils’ approach to solve word problems. Journal of Mathematics Education, 4(1), 9.
Zanzali, N. A. A., & Lui, L. N. (1999). Evaluating the levels of problem solving abilities in mathematics. Research Management Centre, Universiti Teknologi Malaysia.
http://math.unipa.it/~grim/Jzanzalinam.PDF
_______________________ Mary Ann Serdina Parrot Faculty of Education
University of Malaya, Kuala Lumpur [email protected]
Leong Kwan Eu Faculty of Education