Safe behaviour analysis to the application for
personal protective equipment working at high
with
Do-it methods in Pt.X
Octavianus Hutapea1#, Tjipto Suwandi1, Linda Dewanti 2 Faculty of Public Health, Airlangga University, Surabaya, Indonesia1,2
Faculty of Medical, Airlangga University, Surabaya, Indonesia3
Abstract— Working at high (WAH) always be health and safety concern, because the accident occurred not only in oil and gas industry but also covers other industrial sectors such as construction, mining, services and other sectors. Departing from the variation of the findings observed in unsafe action and unsafe condition of working at height in PT.X and case fatality that occurred on working at height activity in March 2014 made the first step to do research on safe behaviour. The purpose of this study was to analyse the implementation of safe behaviour on personal protective equipment for work at height with DO-IT (Define, Observe, Intervene, Test) method in PT.X. The benefit of this research is to give an overview of the behaviour and determine the safe behaviour factors. Research findings showed that 11 workers can well define how to work safely at height, 8 workers working under the safe behaviour index standard, and based on the results of analysis show that 8 workers received the test results with good criteria. Correlation results between test variable with define, observe, and intervene variable showed statistically significant relationship. Positive reinforcement and negative reinforcement was a form of intervention that also has a significant relationship to the results of the intervention. Conclusion: based on the results of the correlation analysis the define variables affect the outcome of the test results on workers by 42.25%, observation variables affect the outcome of the test result at 37.21%, and all intervention programs had correlation with test results.
Keywords— Working at High, Safe behaviour, DO-IT
I. INTRODUCTION
Oil and gas industry is an industry that is based on the upstream, downstream, pipeline, marine, service and supply. The same thing is said by the American Petroleum Institute (API) which divides the industrial oil and gas into five sectors include upstream, downstream, pipeline, marine, service and supply which is potentially the level of risk work such as accidents and occupational diseases (Buddaraju, 2011). Activities production process continues to run for 24 hours must be maintained and preserved by the workers to avoid the sudden cessation of the production process that can be caused by human factor failure, equipment failure and weather condition.
Workplace accidents or occupational accidents occur on the job not only altitude but also applies to all types of work, therefore we need a system of implementation of occupational health and safety (K3) is good to avoid such misfortune. Workplace accidents or occupational accident is an event that is unplanned and uncontrolled as a result of an action or reaction of an object, material, or the radiation that resulted in injury or other possibilities (Heinrich, Peterson, and Roos, 1980).
Safe behavior is a process that forms a safety partnership between management and labor to always focus attention and action on oneself, others, and the environment (Cooper, 2009). According to Heinrich (1980) in Halimah (2010), safe behavior is an act or acts of a person or persons of employees that minimize the possibility of injury to employees. The purpose of the process is safe behavior to reduce the occurrence of incidents triggered by unsafe behavior.
II. RESEARCHMETHODS
Research is a type of observational study and according to the place of execution. This study is a research field. Based on the nature of the problem and the analysis of the data including the type of analytic research with a quantitative approach. The research location is in PT.X. Time data collection began on 1st February - 15th February, 2015. The populations in this study were all workers who work at height on PT.X. The total populations into research subjects are as many as 15 workers of PT.X. Total numbers of research subjects are 15 workers engaged in work at height in the workplace of PT.X
III.RESULTS
A. Individual characteristics (Workers) Work at Height with PT. X
The highest age workers who work at height is 41 years and the lowest age of workers is 25 years. Workers with the longest tenure is 19 years old and working period is at least 2 years. 1 worker (6.67%) had a primary school education, six workers (40%) had secondary school education, 5 workers (33.33%) had a high school education, and three workers (20%) had a college education.
B. Results Identification Define Stages
Define stages of the identification process is done by filling the questionnaire sheet. Results of questionnaires based on data obtained in March 2014. Record active care tool 11 workers (73%) can define work safely at heights well, which means that workers can have a good perception and behave safely when working at height. Instead of workers who do not have a good perception and not to behave safely when working at height is 4 workers (27%) classified as not able to define other working safely at heights well.
C. Observe the results of Phase Identification
Observe the stages of the identification process are done by charging sheet checklist (critical behavior checklist). Results charging checklist based on observational data obtained in February 2015, while the observation data in March 2014 to use comparable data before getting the stages of intervention (Intervene). There is a rise in the number of workers employed in accordance with the standards of safe behavior in 2014 amounted to three workers, whereas in 2015 increased to 7 workers. The number of workers who work not in accordance with the standards of safe behaviour in 2014 amounted to 12 employees, while in 2015 was reduced to 8 workers.
D. Results Identification of Stages Intervene
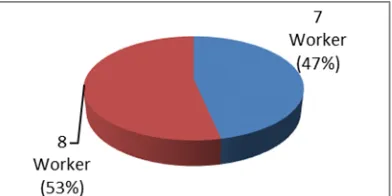
[image:3.612.209.405.607.705.2]Intervene stage identification process is done by filling the questionnaire sheet. Results of questionnaires based interventions that exist in the company and acquired by the worker, and the results of the identification phase Intervene presented in the following figure:
Figure 1. Identification Intervention Program Training and Education Work at Height PT.X worker at, 2015
Based on the picture above, it is known that workers who answered no rule K3 regarding safe work at height amounts to 7 workers (47%), and the answer is no rule K3 regarding safe work at heights are 8 workers (53%). Results of further intervention programs can be observed in the following figure:
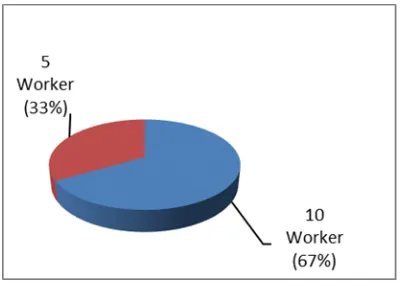
Figure 3 Identification Intervention Program Work at Height K3 procedure PT.X, 2015
[image:4.612.205.410.348.468.2]Based on the picture above, it is known that workers who answered no procedure K3 regarding safe work at height totaled 10 workers (67%), and the answer is no K3 procedures regarding safe work at heights are 8 workers (33%). Results of further intervention programs can be observed in the following figure:
Figure 4. Identification of Positive Reinforcement Intervention Program at Work in Altitude Worker PT.X, 2015
Based on the picture above, it is known that workers who answered got positive reinforcement amounted to 9 workers (60%), and the answer does not get positive reinforcement consists of 3 workers (20%), while the answer is uncertain amounted totaling 3 workers (20%). Results of further intervention programs can be observed in the following figure:
Figure 5. Identification of Negative Reinforcement Intervention Program at Work in Altitude Worker PT.X, 2015
[image:4.612.204.409.553.682.2]and the answer is not received negative reinforcement consists of 4 workers (27%), while the answer is uncertain amounted to amounted to five workers (33%). Results of further intervention programs can be observed in the following figure:
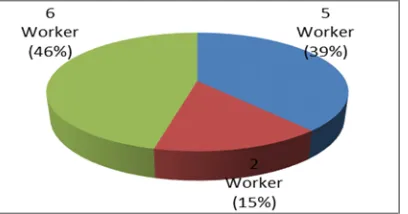
Figure 6. Identification Intervention Program Punishment at Work in Altitude Worker PT.X, 2015
Based on the picture above, it is known that workers who answered got the punishment amounted to 6 workers (46%), and the answer is not got the punishment amounted to five workers (39%), while the answer is uncertain amounted to amounted to 2 workers (15%).
E. Stages Identification Test Results
The process of identifying the stages of tests carried out by filling a questionnaire sheet. The results of this questionnaire carried out in February 2015 as a process of evaluating the behavior of workers after the intervention program. Good test results workers are 8 workers (53%) which mean that after getting intervention worker perceives safe behavior when working at heights well. Workers who are not good test results are 7 workers (47%), which mean that after receiving the intervention of workers is not perceived safe behavior when working at heights well.
[image:5.612.207.411.97.204.2]Analysis of the results of Phase Define the Worker Behavior Test Results
Table 1 Relationship Define Safe Conduct Behavior Test Results Workers with Workers with a job at the height of PT.X, 2015
Define Behavior
Behavior Test
Totaly
Good Bad
f % F % f %
Good 8 72.7 3 27.3 11 100
Not Good 0 0.00 4 100.0 4 100
Correlation Phi = 0.65 (pvalue = 0.013)
Based on the above data it is known that the distribution of workers who can define the behavior of safe work at heights well, 8 workers showed good test results (72.7%), and 3 workers showing test results were not good (27.3%). Workers who define the behavior of safe working at height with no good, all of which test results were not good (100%). Test associative with the test results of 0.65 with a significance value (p value = 0.013), which means there is a statistically significant relationship, define phase of the test results performed.
[image:5.612.113.501.404.483.2]F. Results Analysis Observation (Observe) Safe Behavior with Behavioral Test Results Workers with a job at the height of PT.X, 2015
Table 2 Analysis Observation (Observe) Safe Behavior by Behavior Test Results Workers with a job at the height of PT.X, 2015.
Observation (SBI)
Behavior Test
Totaly
Good Bad
F % F % F %
appropriate 6 85.7 1 14.3 7 100
not appropriate 2 25.0 6 75.0 8 100
Based on the above data it is known that the distribution of workers with safe results according to the standard behavior (score ≥ 85%) with good test results (85.7%) was higher than the group of workers with safe results is not appropriate behavior (score <85%) with good results (75.0%).
Associative test with test results for 0645 with a significance value (p value = 0.019), which means there is a statistically significant relationship, observation stages of the test results performed.
[image:6.612.106.506.193.275.2]G. Results Analysis Intervention Program (Intervene) with the Behavior Test Results Workers with a job at the height of PT.X, Year 2015
Table 3 Analyses of Relationship Training and Education Program with the Behavior Test Results Workers with Work at Height PT.X, in 2015.
Training and Education
Behavior Test
Totaly
Good Bad
F % F % F %
Yes 7 77.8 2 22.2 9 100
No 1 16.7 5 83.3 6 100
Correlation Phi = 0.6 (pvalue. = 0.020)
[image:6.612.114.501.384.465.2]Based on the above data it is known that the distribution of worker training and education, 7 workers showed good test results (77.8%), and two workers showed test results are not good (22.2%). Workers who do not follow training and education, one worker showed good test results (16.7%), and 5 workers shows the test results are not better (83.3%). Test associative with the test results of 0.6 with a significance value (p value = 0:02) which means there is a statistically significant relationship, program training and education on the results of tests conducted.
Table 4 Analysis of Relationship Rule K3 with Behavioral Test Results Workers with a job at the height of PT.X, 2015.
Rule Health and safety
Behavior Test Totaly
Good Bad
F % F % F %
Yes 6 85.7 1 14.3 7 100
No 2 25.0 6 75.0 8 100
Correlasi Phi = 0.60 (Pvalue = 0.02)
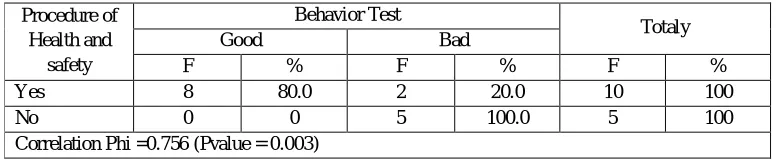
Based on the above data it is known that the distribution of workers who know the work rules for research with excellent test results (87.5%) than the group of workers who claim there is no rule K3 with the test results are not good (75%). Test associative observational correlation with test results of 0.60 with a significance value (p value = 0:02) which means there is a statistically significant relationship to the K3 regulatory test results performed.
Table 5 Relationship Analysis Procedure K3 with Behavioral Test Results Workers with Work at Height PT.X, 2015
Procedure of Health and
safety
Behavior Test
Totaly
Good Bad
F % F % F %
Yes 8 80.0 2 20.0 10 100
No 0 0 5 100.0 5 100
Correlation Phi =0.756 (Pvalue = 0.003)
[image:6.612.112.500.562.642.2]Table 6 Analysis of Positive Reinforcement relationship with the Behavior Test Results Workers with Work at Height PT.X, 2015 Positive Reinforcement Behavior Test Totaly
Good Bad
F % F % F %
Yes 8 88.9 1 11.1 9 100
Uncertainty 0 0 3 100 3 100
No 0 0 3 100 3 100
Correlation Phi = 0.873 (Pvalue = 0.003)
[image:7.612.168.445.312.405.2]Based on the above data it is known that the distribution of workers who expressed their positive reinforcement with good test results (88.9%) is greater (8 workers) than the group of workers who do not declare their positive reinforcement with the test results are not good (100% or 3 employees). Test associative observational correlation with test results for 0.873 with a significance value (p value = 0.003), which means there is a statistically significant correlation between positive reinforcement work with the results of tests conducted
Table 7 Analysis of Relationship Test Results Negative reinforcement with Behavioral Workers with Work in Altitude PT.X, 2015
Based on the above data it is known that the distribution of workers who expressed their negative reinforcement with good test results (83.3%) than the group of workers who do not declare the existence of negative reinforcement with excellent results (100%). Associative test with test results for 0.675 with a significance value (p value = 0.333), which means there is a statistically significant correlation between negative reinforcement with the results of tests conducted.
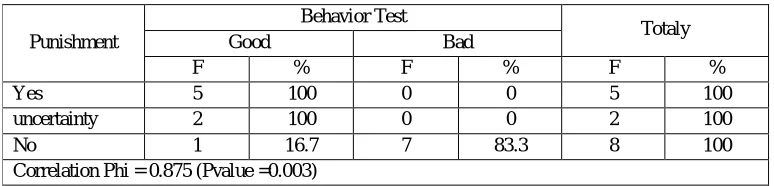
Table 8 Analysis of the Relationship Punishment Behavior Test Results Workers with Work at Height PT.X, 2015
Punishment
Behavior Test
Totaly
Good Bad
F % F % F %
Yes 5 100 0 0 5 100
uncertainty 2 100 0 0 2 100
No 1 16.7 7 83.3 8 100
Correlation Phi = 0.875 (Pvalue =0.003)
Based on the above data it is known that the distribution of workers stating that there is punishment for the research work related test results (100%) fewer (5 employees) compared to the group of workers who claim there is no punishment with the test results are not better (83.3% or 7 workers). Associative test with test results for 0875 with a significance value (p value = 0.003), which means there is a statistically significant relationship punishment against the results of interventions.
IV.DISCUSSION
The process of collecting this data is a major feature that distinguishes the process of Behavioral Safety with periodic inspection or audit activities so was the fundamental reason the effectiveness of the process in reducing the incidence rate. Based on the results of questionnaires filling workers working at height, 11 workers (73.3%) can define well how to work safely at heights.
Negative Reinforcement
Behavior Test
Totaly
Good Bad
F % F % F %
Yes 5 83.3 1 16.7 6 100
uncertainty 3 60.0 2 40.0 5 100
No 0 0 4 100.0 4 100
[image:7.612.113.500.500.593.2]develop a result (outcomes) of a behavior will be different from the interventions made to develop directly observed behavior (Geller, 2001).
One of the main techniques used to change the behavior in the Behavior-Based Safety observation and feedback. (Geller, 2001). Based on observations conducted observer, using Critical Behavioral Checklist (CBC) developed according to the case study, the result that 8 workers (53.3%) working under the safe standard behavior index. Research carried out for the construction workers working at heights with a low index of safe behavior, the index rose after BBS approach (Oostakhan et al., 2012). Intervention phase is an important stage in the BBS after the third determined what behavior would intervene. Based on the results of analysis throughout the program interventions made by companies related to the final behavior of workers. The root of intervention based behavior is a cause of clinical psychology focus on behavior that seemed allows the empirical assessment of the output of therapy or intervention in this case.
The last stage of the BBS is the stage of the overall evaluation of the previous step (test). Based on the results of analysis show that 8 workers (53.3%) received test results with both criteria. The goal of this stage is to look at the effectiveness of program interventions made. Given the behavior change requires a process that cannot be predicted accurately, it is advisable not to be careless in its assessment that an intervention is not effective. It could be another factor influencing labor-risk behavior thus becomes less effective intervention programs
V. CONCLUSIONS
A. Conclusions
1) 11 workers can define well how to work safely at heights. There is a statistically significant relationship, define phase of the test results performed, the test results of 0.65 with a significance value (p value = 0.013).
2) There is a rise in the number of workers employed in accordance with the standards of safe behavior in 2014 amounted to three workers, whereas in 2015 increased to 7 workers.
3) The intervention program includes education and training, rule K3, K3 procedures, positive reinforcement, negative reinforcement and punishment, associated with unsafe behavior of workers.
4) 8 workers get test results with both criteria, and the remaining 7 workers get test results are not good criteria.
B. Suggestion
1) The management company should be more proactive in implementing the concept of BBS program, because the program as a concept that is run during this tends to be waiting for a report from the team in the field, while the company's management does not understand the constraints of what is happening in the field so far, as well as the improvement progress to be taken for an improvement to the field work, especially working at height.
2) The company should be able to maximize the positive reinforcement of intervention, negative reinforcement, for all workers in order to raise the spirit positive or added value both for the workers and companies, and in terms of punishment the management company must be firm and precise in taking the measures and decisions that are expected to cause effects prevalent or significant changes to any altitude work.
3) Addition of personnel in the company safety officer is urgent in order to increase oversight of labor and work in progress, so there is only one safety officer for surveillance personnel in all areas, or management company is obliged to equip the area technician with in-depth training on the program and safety regulations as well as occupational safety and health regulations so that implementation can help the safety officer.
4) The Company is obliged to tighten the minimum requirements that must be met for workers who will do the job height such as job training certificates altitude and altitude emergency safety on the job.
REFERENCES
[1] Buddaraju, D. 2011. Performance of Control Room Operators in Alarm Management. Thesis: Lousiana State University. [2] Cooper, Dominic, 2009. Behavioral Safety A Framework for success. Indiana: BSMS Inc.
[3] Geller, E. Scott, 2001. The Psychology of Safety Handbook. USA: Lewis Publisher.
[4] Halimah, Siti, 2010. Faktor – Faktor yang Mempengaruhi Perilaku Aman Karyawan di Area Produksi PT. SIM Plant Tambun II Tahun 2010. Skripsi. Jakarta; FKIK UIN.
[5] Heinrich, H.W., Peterson D. & Roos N. 1980. Industrial Accident Prevention. 5th ed. USA: McGraw-Hill.