Mouse ES and iPS cells can form similar
definitive endoderm despite differences in
imprinted genes
Constantina Christodoulou, … , Gustavo Mostoslavsky,
Darrell N. Kotton
J Clin Invest.
2011;
121(6)
:2313-2325.
https://doi.org/10.1172/JCI43853
.
The directed differentiation of iPS and ES cells into definitive endoderm (DE) would allow
the derivation of otherwise inaccessible progenitors for endodermal tissues. However, a
global comparison of the relative equivalency of DE derived from iPS and ES populations
has not been performed. Recent reports of molecular differences between iPS and ES cells
have raised uncertainty as to whether iPS cells could generate autologous endodermal
lineages in vitro. Here, we show that both mouse iPS and parental ES cells exhibited highly
similar in vitro capacity to undergo directed differentiation into DE progenitors. With few
exceptions, both cell types displayed similar surges in gene expression of specific master
transcriptional regulators and global transcriptomes that define the developmental
milestones of DE differentiation. Microarray analysis showed considerable overlap between
the genetic programs of DE derived from ES/iPS cells in vitro and authentic DE from mouse
embryos in vivo. Intriguingly, iPS cells exhibited aberrant silencing of imprinted genes
known to participate in endoderm differentiation, yet retained a robust ability to differentiate
into DE. Our results show that, despite some molecular differences, iPS cells can be
efficiently differentiated into DE precursors, reinforcing their potential for development of
cell-based therapies for diseased endoderm-derived tissues.
Research Article
Stem cells
Find the latest version:
Mouse ES and iPS cells can form similar
definitive endoderm despite differences
in imprinted genes
Constantina Christodoulou,1,2 Tyler A. Longmire,1 Steven S. Shen,3 Alice Bourdon,4
Cesar A. Sommer,5 Paul Gadue,6 Avrum Spira,1,2,3 Valerie Gouon-Evans,4
George J. Murphy,7,8 Gustavo Mostoslavsky,5,8 and Darrell N. Kotton1,2,8
1Boston University Pulmonary Center, 2Department of Genetics and Genomics, and 3Section of Computational Biomedicine, Department of Medicine,
Boston University School of Medicine, Boston, Massachusetts, USA. 4Mount Sinai School of Medicine, Department of Gene and Cell Medicine,
New York, New York, USA. 5Section of Gastroenterology, Department of Medicine, Boston University School of Medicine, Boston, Massachusetts, USA. 6Center for Cellular and Molecular Therapeutics, Children’s Hospital of Philadelphia, Philadelphia, Pennsylvania, USA.
7Section of Hematology and Medical Oncology, Department of Medicine, and 8Center for Regenerative Medicine,
Boston University School of Medicine, Boston, Massachusetts, USA.
The directed differentiation of iPS and ES cells into definitive endoderm (DE) would allow the derivation
of otherwise inaccessible progenitors for endodermal tissues. However, a global comparison of the relative
equivalency of DE derived from iPS and ES populations has not been performed. Recent reports of molecular
differences between iPS and ES cells have raised uncertainty as to whether iPS cells could generate
autolo-gous endodermal lineages in vitro. Here, we show that both mouse iPS and parental ES cells exhibited highly
similar in vitro capacity to undergo directed differentiation into DE progenitors. With few exceptions, both
cell types displayed similar surges in gene expression of specific master transcriptional regulators and global
transcriptomes that define the developmental milestones of DE differentiation. Microarray analysis showed
considerable overlap between the genetic programs of DE derived from ES/iPS cells in vitro and authentic DE
from mouse embryos in vivo. Intriguingly, iPS cells exhibited aberrant silencing of imprinted genes known
to participate in endoderm differentiation, yet retained a robust ability to differentiate into DE. Our results
show that, despite some molecular differences, iPS cells can be efficiently differentiated into DE precursors,
reinforcing their potential for development of cell-based therapies for diseased endoderm-derived tissues.
Introduction
It is widely accepted that early in embryonic development, broad-ly multipotent definitive endoderm (DE) progenitor cells of the developing foregut are specified into organ domains, such as the primordial thyroid, lung, liver, and pancreas fields (1–4). Within each domain of DE, organized along an anterior-posterior axis, these primordial progenitors rapidly give rise to all the differen-tiated epithelial progeny of each endodermally derived tissue. Hence, those interested in purifying thyroid, lung, liver, or pancre-atic stem or progenitor cells for disease therapies are increasingly focused on using the developing embryo as a “road map” to derive these progenitors in vitro through the directed differentiation of cells whose phenotype resembles the early embryo, such as plu-ripotent ES cells or iPS cells (5, 6).
The recent discovery of iPS cells (7, 8) thus presents unprec-edented opportunities to apply the protocols developed for the directed differentiation of ES cells in order to similarly obtain iPS cell–derived progenitor cells for tissues of all germ layers, including DE (9). Since iPS cells can be generated by reprogram-ming somatic cells taken from diseased adults (10, 11), we can also consider the exciting possibility of deriving autologous, dis- ease-specific cells, such as endodermal progenitors, for poten-tial regenerative therapies for lung, liver, or pancreatic epithelia, without fear of allogeneic rejection. Because both ES and iPS
cells resemble pluripotent cells of the early blastocyst embryo, the developmental progenitor populations derived from either population also provide novel in vitro platforms from which to evaluate the transcriptomes, epigenomes, and mechanisms that control cell fate decisions and differentiation of multipotent definitive endodermal progenitors (5, 12–14).
Several groups have recently detected differences in global gene expression profiles between ES and iPS cells, raising appropriate uncertainty as to whether iPS cells are molecularly and functionally equivalent to ES cells (15–21). If the proposed gene expression differences adversely impact the capacity of iPS cells to undergo directed differentiation into desired lineages, this would significantly dampen enthusiasm for the prospect of deriving disease-specific or patient-specific iPS cells to model and treat diseases affecting these lineages (19). With regard to endoderm, if ES or iPS cells are to be applied for the treat-ment of diseases affecting endoderm-derived epithelia, such as emphysema, cystic fibrosis, diabetes, and cirrhosis, it is critical to determine whether any putative difference between ES and iPS cells affects the relative endodermal potential of each cell type. Since protocols for the efficient derivation of DE from ES cells were only recently developed (6, 22), not surprisingly this germ layer has been the last to be derived from iPS cells, and only very recently have proof-of-concept studies been reported demonstrating the in vitro capacity of iPS cells to express puta-tive endodermal markers or to form pancreatic, hepatocyte, or gut progenitors in culture (9, 11, 23, 24).
Conflict of interest: The authors have declared that no conflict of interest exists.
Here, we perform a detailed comparison of the capacity of iPS cells versus ES cells to undergo directed differentiation to definitive endodermal progenitors. Like ES cells, iPS cells respond to specified soluble ligands by proceeding through a sequence of differentiation steps that mimic the known sequence of developmental milestones encountered during authentic DE formation in the embryo. Despite these similarities, we did find notable differences in the global gene expression programs of undifferentiated iPS cells compared with those of blastocyst-derived ES cells, and some of these differences increase during endodermal differentiation, most significantly in the expression levels of maternally inherited imprinted genes local-ized to the delta-like 1 homolog–deiodinase, iodothyronine type III [Dlk1-Dio3] gene cluster on chromosome 12qF1. Although several of these imprinted genes are known to play a role in the development of endoderm-derived organs, such as the lung and liver, surprisingly, aberrantly imprinted iPS cells appear to retain robust functional capacity to undergo directed differentiation to DE progenitors and their progeny of early hepatic lineage. Results In order to test the capacity of pluripotent stem cells to under-go directed differentiation to DE, we used a 2-stage serum-free culture protocol, developed by Keller and colleagues (6, 14), to recapitulate the early stages of endodermal differentiation that occur in the gastrulating embryo (Figure 1A). To establish the differentiation kinetics of pluripotent stem cells, we first used a well-characterized control 129/Ola ES cell line that features reporter transgenes, GFP and hCD4, targeted to brachyury (T) and Foxa2 loci, respectively (13, 14). As previously published (13), this cell line demonstrated that nodal-activin signaling directed the differentiation of pluripotent stem cells into cells, reminis-cent of the embryo’s anterior primitive streak (defined by the phenotype T+/Foxa2+/ckit+/CXCR4+
), followed by differentia-tion of these intermediates into DE (defined by the phenotype T–/Foxa2+/ckit+/CXCR4+; ref. 14) within 6 days in culture (Figure
1, B–D). After this first differentiation stage, the resulting DE pro-
genitors underwent lineage specification (stage 2 hepatic-induc-ing media; ref. 14 and Figure 1E) into cells expressing the initial transcriptional regulators or markers of primordial liver (albu-min [Alb ]) and also expressing low levels of lung or thyroid (thy-roid transcription factor 1 [Ttf1]) and pancreatic and duodenal homeobox 1 (Pdx1). The waves of gene expression that define the kinetics of this differentiation sequence were evident either when assessing cells purified at intermediate stages of differentiation by flow cytometry or in unfractionated populations maintained without any cell sorting (Figure 1E). However, purification of T+/
Foxa2+/ckit+ anterior primitive streak–like cells on day 4 resulted
in more sustained overall expression of the endodermal marker, Foxa2, from day 7–15 of the culture protocol, presumably due to decreased heterogeneity in the cultured progeny of sorted cells.
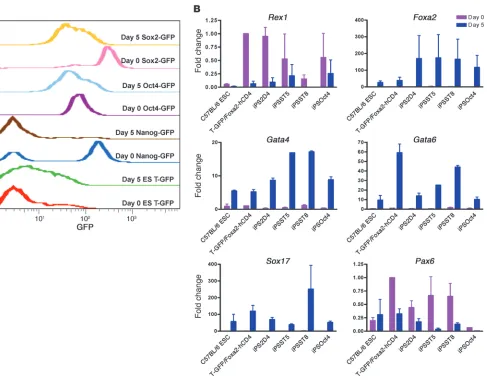
Clone-to-clone variability in capacity of ES and iPS cell lines to undergo directed differentiation to DE in vitro. Based on the differentiation kinetics of ES cells, we selected day 5 of in vitro differentiation as an optimal time when the majority of cells in each culture have differ-entiated into DE but have not yet undergone lineage specification to liver, thyroid, or lung. Hence, we sought to compare the capacity of iPS cells versus ES cells to undergo directed differentiation to DE over this 5-day period. We selected 4 iPS cell lines for initial testing: we previously generated the ST5 and ST8 cell lines from postnatal tail-tip fibroblasts from a Sox2-GFP knockin mouse using a doxycycline-inducible single lentiviral stem cell cassette vector (Tet-STEMCCA; ref. 25); an additional Oct4-GFP iPS cell line was generated with this vector from tail-tip fibroblasts taken from an Oct4-GFP knockin mouse (26); and a well-characterized 2D4 cell line was generated previously from Nanog-GFP knockin mice using 4 retroviral reprogramming vectors (12). Importantly, all 4 iPS cell lines tested in vivo were able to efficiently form all germ layers, including DE, in teratoma assays, in mouse chimeras after blastocyst transplantation, and (for ST8 and 2D4 lines) in sec-ond generation mice generated after germ line transmission (refs. 12, 25, and Supplemental Figure 1; supplemental material avail- able online with this article; doi:10.1172/JCI43853DS1). Compar-ing these 4 iPS cell lines to 2 ES cell lines, we found that all 6 cell lines responded to the 5-day culture protocol by downregulating the expression of pluripotent transcriptional regulators (e.g., Rex1,
Nanog, Oct4, and Sox2 ; Figure 2) and upregulating the set of essen-tial endodermal master transcriptional regulators, such as Foxa2,
Sox17, Gata4, and Gata6 (Figure 2). Transcriptional regulators that are selectively active in other lineages, such as Pax6 for neuroecto-derm and Sox7 for extraembryonic endoderm, were not upregulated over this 5-day period (Figure 2 and Supplemental Figure 2A), fur-ther suggesting that directed differentiation preferentially to the DE germ layer was accomplished in all 4 iPS cell lines. However, we noted marked clone-to-clone variability in the magnitude of this endodermal response to activin across all cell lines tested. We considered whether the observed variability in endodermal dif-ferentiation capacity between all tested ES and iPS cell lines might be due to (a) differences in genotypes between the 2 ES lines and 3 out of the 4 iPS cell lines, (b) low levels of variable leaky expression of the integrated reprogramming transgenes in the iPS cell clones (25, 27), (c) effects of haploinsufficiency of the different loci targeted to make the different knockin reporter lines (Nanog-GFP, Sox2-GFP, or Oct4-GFP), (d) heterogeneity of cell populations produced without the use of cell sorting, or (e) inherent biological differences in the epigenetic states of each cell line. Hence, to control for genotype or knockin effects, we tested the strain-matched Sox2-GFP ES cell line used to make the mice from which the ST5 and ST8 iPS cell lines were derived Figure 1
Kinetics of differentiation of ES cells into DE. (A) Schematic of the mouse E8.25–E9.0 developing embryo, indicating transcription fac-tors and marker genes induced as the foregut endoderm is patterned into prospective organ domains of thyroid, lung, liver, and dorsal/ven-tral pancreas. Hrt, heart; vp, vendorsal/ven-tral pancreas; Li, liver; Lu, lung; Th, Thyroid; dp, dorsal pancreas. (B) Flow cytometry quantification of the kinetics of endodermal differentiation of the 129/Ola ES cell line containing GFP and hCD4 reporters knocked-in to the brachyury (T) and Foxa2 loci, respectively. Numbers in each quadrant indicate the percentage of cells in that quadrant. (C) Summary of endodermal dif-ferentiation kinetics of ES cells, displayed as the percentage of cells at each time point, displaying the flow cytometry profile of anterior primitive streak–like (APS-like) cells (T+/Foxa2+) or DE-like cells (T–/
Foxa2+), or coexpressing ckit+/CXCR4+ cells, which are considered
surrogate markers of endoderm differentiation. Error bars represent average ± SEM. (D) Day 0 versus day 5 expression of transcription factors during endodermal differentiation of ES cells, as assessed by qRT-PCR. Error bars represent average ± SEM. (E) qRT-PCR assessment of the kinetics of gene expression of ES cells in a 2-step protocol designed to accomplish DE differentiation (stage 1), followed by lineage specification (stage 2; day 6–18). T+/Foxa2+/ckit+ APS-like
research article
(26). We found that Sox2-GFP ES cells responded to the entire 15-day endoderm differentiation protocol with slightly slower differentia-tion kinetics compared with those of 129/Ola ES cells of a different genetic background (Supplemental Figure 2B). Differentiation in par-allel with these strain-matched Sox2-GFP ES cells versus ST5 and ST8 iPS cell lines revealed highly similar differentiation kinetics quantified by percentages of cells expressing established surface markers, CXCR4 and ckit, as well as a recently described endoderm-specific cell surface marker, ENDM1 (ref. 28 and Figure 3, A and B). Although ST8 iPS cells appeared to differentiate into endoderm slightly faster than ES or ST5 cells (Figure 3B; 2-way ANOVA, P = 0.04), there was no statistically significant difference in the overall peak endodermal differentiation efficiency of each cell line, quantified by the percentage of cells reach-ing similar ENDM1 expression by day 6 (Figure 3B; ANOVA, P = 0.08). All 3 cell lines showed the capacity to robustly proliferate in these con-ditions, although growth kinetics were slightly better for the parental ES cell line in 7 out of 8 repeated experiments (Figure 3B).
[image:5.585.56.543.80.463.2]Next we compared the capacity of both ES and iPS cell–derived putative multipotent DE progenitors to undergo further lineage specification in response to inductive signals (stage 2 differentia-tion; Figure 3C). Reminiscent of the sequence of differentiation observed in developing embryos, after stimulation of the putative ES and iPS cell–derived endodermal progenitors with a defined serum-free media supplemented with lineage specifying growth factors, including BMP4, FGF2, and HGF designed to favor hepat-ic lineage specification, we observed sequential induction of the early liver marker genes, α-fetoprotein (Afp) and α-1 antitrypsin (Aat), followed by induction of Alb mRNA and Alb protein expres-sion in both ES and iPS cell lines (Figure 3, C, D, and F). After 19 days of differentiation, the resulting cells also displayed glycogen storage capacity (Figure 3E). As expected for a protocol favoring directed differentiation to hepatic lineages, only low-level lineage specification to other nonhepatic endodermal lineages was detect-able in all 3 cell lines, evidenced by late and transient expression of
Figure 2
Ttf1, thyroid stimulating hormone receptor (Tshr), intestinal fatty acid binding protein (Ifabp), and Pdx1. In this protocol, there was no induction of additional pancreatic lineage markers, such as pancreas transcription factor 1 subunit α (Ptf1a) (Supplemental Figure 3A and data not shown). When each cell line was exposed to an established 3-stage culture protocol (29) designed to favor pancreatic lineage specification via inhibition of Shh and supple- mentation of FGF10 and retinoic acid, all 3 clones displayed simi-lar early pancreatic lineage specification, indicated by induction of Hnf6, Pdx1, and Ptf1α (Supplemental Figure 3). Taken together, these waves of gene expression during differentiation to endo- derm-derived lineages further supported the definitive endoder-mal capacity of the day 5 cells derived from each cell line in vitro. Furthermore, to demonstrate in vivo functional potential to form endoderm, unsorted day 5 iPS cell–derived putative endodermal progenitors were transplanted beneath the kidney capsules of SCID mice. These cells displayed robust capacity to form endo-dermal epithelia expressing nuclear Foxa2 protein (Supplemental Figure 4A), confirming the in vivo functional potential of iPS cell– derivatives following in vitro directed differentiation. In contrast to the favorable growth kinetics we observed dur-ing differentiation of ST5 and ST8 cells, we found that additional syngeneic iPS cell lines (SEF4 and SEF11) that exhibit high-level reprogramming transgene overexpression driven by a constitu-tively active EF1α promoter (EF1α-STEMCCA; refs. 25, 27) did not robustly form endoderm in this 5-day differentiation proto-col (Supplemental Figure 2C). SEF4 and SEF11 iPS cells, which showed more than 50-fold leak of reprogramming transgenes compared with that of ST5 and ST8 cells, failed to increase their cell numbers over 5 days of directed differentiation, findings in keeping with our prior work documenting the adverse effects of reprogramming transgene overexpression on the endodermal developmental capacity of iPS cells (27).
Sox2-GFP downregulation distinguishes ES and iPS cell–derived endo-derm from nonendoendo-derm. Although directed differentiation of the ES and iPS cell clones over 5 days into DE appeared to be efficient, heterogeneity of the cells at each time point was evident, based on (a) the residual presence of some ckit–, CXCR4–, or ENDM1– cells
(Figure 3A); (b) the presence of some cells failing to express the endoderm transcriptional regulator, Foxa2, by immunostaining (Supplemental Figure 5); (c) detectable expression of mesoder-mal genes, Myf5 and Gata1 (Supplemental Figure 2A); and (d) the residual presence of cells on day 5 with nonendodermal or pluripo-tent potential, as reflected by the capacity of iPS cell–derived day 5 cells to form some nonendodermal lineages, such as mesodermal (smooth muscle actin+) and neuroectodermal (Tuj1+) cells in vivo
after kidney capsule transplantation (Supplemental Figure 4A). We evaluated potential strategies for distinguishing and purify- ing ES and iPS cell–derived DE progenitors from other cells pres-ent on day 5 of differentiation. Based on the differentiation kinetics of control ES cells (Figures 1 and 3), putative endodermal pro-genitors derived from ES/iPS cells by day 5 should be identifiable based on the surface phenotype ckit+/CXCR4+/ENDM1+. Analysis
of the kinetics of expression of the Sox2-GFP knockin reporter also revealed residual Sox2 locus activity but at consistently lower intensity (one-half–log drop in fluorescence), as ES or iPS cells dif-ferentiated into ckit+/CXCR4+/ENDM1+ cells (Figure 2A). Indeed,
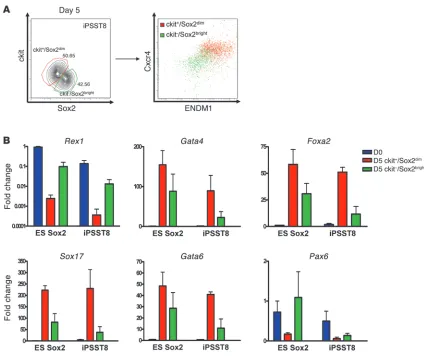
quantitative RT-PCR (qRT-PCR) analysis of sorted day 5 popula- tions confirmed that putative endodermal cells could be distin-guished from other cells using a Sox2-GFPdim/ckit+ sort algorithm,
since endodermal marker genes were expressed preferentially in this population (Figure 4A). “Contaminating” cells expressing residual levels of Nanog and Rex1 localized to the Sox2bright/ckit– population
outside this sort gate. Most importantly, decreasing the heteroge-neity of the day 5 cell population by cell sorting, produced ES and iPS cell–derived endodermal cells expressing highly similar levels of endodermal master transcriptional regulators (Figure 4B). Overall, 77% ± 7.59% (average ± SEM), 18% ± 7.32% (average ± SEM) (2-tailed
t test, P = 0.005) of cells in the sorted Sox2-GFPdim/ckit+ populations
expressed a putative endodermal phenotype, defined as coexpres-sion of the endodermal markers ENDM1 and CXCR4; whereas only 18% ± 13% of Sox2-GFPbright/ckit– cells coexpressed ENDM1 and
CXCR4 (P = 0.005).
To evaluate the in vivo differentiation potential of each sorted pop-ulation derived from each ES and iPS cell clone, we performed kidney capsule transplantations in 36 SCID mice (Supplemental Figure 4). Four weeks after transplanting identical numbers of day 5 Sox2-GFPdim/ckit+ cells, day 5 Sox2-GFPbright/ckit– cells, or day 18 hepatic
differentiated cells (also sorted on day 5 Sox2-GFPdim/ckit+ cells;
data not shown), we found all transplanted cells typically gave rise to very small tumors localized to kidney capsules (0.09 ± 0.21 cm2; n = 4 recipients per group). There was no statistically significant difference among groups in tumor size resulting from each dif-ferentiated, sorted cell population from each ES and iPS cell clone (ANOVA, P = 0.16). In contrast, an identical number of control undifferentiated stem cells (sorted day 0 ES Sox2-GFPbright/ckitdim
cells) required recipient harvest at the 4-week end point of the study, due to abdominal distension, resulting from rapid overgrowth of the expected large 1.73 cm2 teratoma (Supplemental Figure 4B), a
size consistent with our prior experiments using day 0 ES cells (refs. 25, 27, and data not shown). As has been published by others (6), these findings suggest that endodermal directed differentiation of pluripotent stem cells reduces their tumorigenicity after transplan-tation, compared with that of undifferentiated stem cell transplants. Histological scoring of each ES and iPS cell–derived tumor revealed that endodermal epithelium was the predominant differentiated tis-sue type arising from each population sorted after 5 days of activin stimulation; however, no sorted population was completely deplet-ed of mesodermal and ectodermal structures (Supplemental Figure 4D). Overall, the tumors arising from the day 5 endoderm-enriched sorted transplants were more well differentiated than the immature large teratomas that were found to arise from undifferentiated ES or iPSST5 and ST8 cell transplants, whose histology predominantly consisted of immature neural rosettes and other ectodermal keratin-ized derivatives in addition to endoderm and mesoderm (ref. 25 and Supplemental Figure 4B). Furthermore, in comparison with tumors arising from sorted day 5 Sox2-GFPbright/ckit– cells or from day 0
cells, the tumors arising from the sorted day 5 Sox2-GFPdim/ckit+
population were relatively depleted of ectodermal skin-like keratin-ized epithelia (Supplemental Figure 4D). None of the 36 recipients showed any malignant features in the benign growths arising from the sorted transplants.
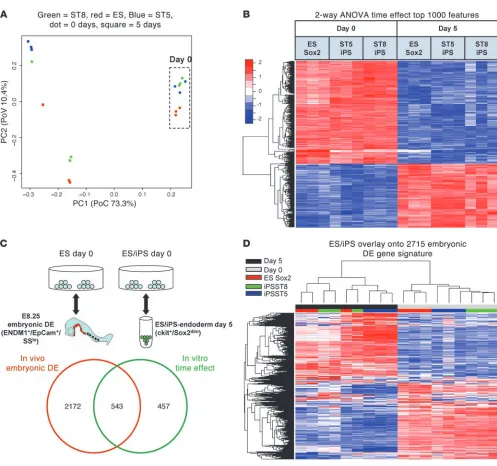
analysis across all genes measured on the array indicated that, in the undifferentiated state, the ST5 and ST8 iPS cell transcriptomes were highly similar to each other but slightly different from their parental ES cell line (Figure 5A). Differentiation over 5 days was responsible for the vast majority of the variability in gene expres-sion across all samples (first principal component PoV = 73.3%); however, there was some variability in gene expression between different cell lines during differentiation (second principal com-ponent PoV = 10.4%; Figure 5A). In order to interrogate the kinetics of global gene expression of each cell line during directed differentiation to endoderm, we used 2-way ANOVA of all 18 samples to identify (a) genes that are dif-ferentially expressed between day 0 and 5 of differentiation (time effect); (b) genes that are differentially expressed between ES, ST5, and ST8 cell lines (cell-type effect); and (c) gene expression differ-ences during differentiation that are modulated by the cell line type (interaction effect of time and cell type). Endodermal dif-ferentiation from day 0 to day 5 was associated with a very large number of gene expression changes (approximately 8,000 out of approximately 29,000 probe sets were significantly associated with the time effect at false discovery rate [FDR] < 0.001). Importantly, all master endodermal transcriptional regulators (Foxa2, Gata4,
Gata6, Sox17 ) that were differentially expressed by qRT-PCR analy- sis between day 0 and day 5 (Figure 4B) were also found to be dif-ferentially expressed by this global gene expression analysis. Next, we designated the top 1,000 of these transcripts (ranked by time effect, FDR-adjusted P value) as a putative “1,000-gene endoderm kinetic” signature and performed cluster analysis to compare this differentiation kinetic among each cell line (Figure 5B). When studying the directed differentiation of pluripotent stem cells, an important issue is determining how closely a putative lineage generated in vitro mimics the phenotype of its authentic counterpart that is specified during normal development in the embryo. Hence, we sought to establish whether the 1,000-gene endoderm kinetic established in our in vitro model overlapped with the authentic global gene kinetic of DE development in the mouse embryo in vivo (hereafter referred to as embryonic DE). In order to establish the global gene kinetic of embryonic DE, we prepared RNA extracts from embryonic DE cells purified by
flow cytometry from E8.25 mouse embryos based on an estab-lished ENDM1+/EpCam+/side scatter low algorithm (ref. 28 and
Figure 5C). We compared the transcriptomes of these embryonic DE cells with those of undifferentiated ES cells and found 2,715 differentially expressed transcripts at the significance level of FDR < 0.001. We found this embryonic DE kinetic signature over-lapped with more than 50% of the in vitro 1,000-gene endoderm kinetic (Figure 5C). These results indicate that ES and iPS cell– derived DE resembles but is not identical to E8.25 embryonic DE. Moreover, when the 2,715 genes that define embryonic DE were used to generate an unsupervised clustering dendogram of all 18 ES and iPS cell–derived samples, ES and iPS cell–derived endoderm clearly clustered together and were distinct from the transcriptome programs of undifferentiated ES and iPS cells (Figure 5D). This cluster analysis also demonstrated that endoderm derived from the ST8 iPS cell clone appeared more similar to endoderm derived from the parental ES cells than that from the ST5 iPS cell clone.
Endodermal differentiation accentuates differences in expression levels of imprinted genes between ES and iPS cells . To evaluate potential differ-ences in the gene expression programs of ES cells versus iPS cells, we first compared cells in both the differentiated and undifferentiated states. We found that 111 transcripts (including mRNA, microRNA [miRNA], and small nucleolar RNA) were differentially expressed across the 3 cell lines regardless of differentiation state (cell-type effect FDR < 0.001; Figure 6A). Clustering analysis illustrated that the majority of these transcripts distinguished the 2 iPS cell clones from their parental ES cells. Remarkably, we found 36 of these dif-ferentially expressed transcripts were encoded by the Dlk1-Dio3– imprinted gene cluster on mouse chromosome 12qF1 (Figure 6, A and B, and Table 1). For example, 2 of the top 3 most differentially expressed genes between iPS and ES cells were maternally expressed 3 (Gtl2, also known as Meg3) and maternally expressed 8 (Rian, also known as Meg8 or Irm ), which appeared to have low to undetect-able expression levels in both ST5 and ST8 cell lines compared with those in ES cells (qRT-PCR; Figure 6C). Both these genes are noncoding RNA members of the Dlk1-Dio3–imprinted cluster that are typically monoallelically expressed from only the maternally inherited allele along with 5 other noncoding RNAs (30–32). Of 11 remaining transcripts that distinguished iPS cells from ES cells with more than 4-fold differential expression (fold-change cut-off set to ensure all genes met Figure 6’s FDR < 0.001 cutoff; Table 1), 10 were miRNAs encoded by the Dlk1-Dio3 gene cluster, and all 10 appeared to be silenced in both iPS cell clones. Overall, 63 mem-bers of this gene cluster had known probe IDs on our microarray platform, and 36 of these were differentially expressed between ES and iPS cell lines with FDR < 0.001 (Fisher’s exact test for enrich-ment, P = 1.5 × 10–63). These results suggested aberrant silencing of
many maternally expressed members of this imprinted gene cluster in both iPS cell lines in both differentiation states. Next we focused on gene expression differences that might dis-tinguish ES cells from iPS cells during endodermal differentiation. Analyzing the interaction of time effect and cell type, we found that 105 transcripts were differentially expressed (FDR < 0.01; Sup-plemental Figure 6), indicating that differences in expression levels of these genes emerged between the 3 cell lines during the 5 days of directed differentiation. The top-most differentially expressed of all genes was the imprinted maternally expressed gene Gtl2 (P value interaction of time and cell type = 3.59 × 10⁻⁵
). By qRT-PCR analysis, we confirmed that endodermal differentiation exacerbated the difference in Gtl2 expression levels between the 3 cell lines, as Gtl2 was upregulated in ES cells during endodermal
Figure 3
Comparison of strain-matched ES and iPS cell capacity to undergo directed differentiation to DE, followed by hepatic lineage specifica-tion. (A) iPS cell clones (ST5 and ST8) and their parental syngeneic ES cells (Sox2-GFP) were differentiated in parallel to endoderm. The kinetics of expression of ckit, CXCR4, and the DE marker ENDM1 were measured by flow cytometry. PE indicates autofluorescence. Numbers in each quadrant indicate the percentage of cells in that quadrant. (B) Summary of kinetics and cell counts from 3 repeated experiments. (C
research article
differentiation and hepatic lineage specification but remained silenced in both ST5 and ST8 iPS clones (Figure 6, C and D). In contrast, a paternally expressed gene, Dlk1, in this cluster was not silenced in iPS cells and was upregulated more in differentiating iPS cells than in ES cells (Figure 6C), suggesting that silencing of the maternally inherited genes was due to aberrant imprinting of the cluster rather than global silencing of both alleles of this genomic region. These findings also demonstrated that silencing of the transcripts normally expressed from the maternally inherited allele was not simply due to the differentiation state of the iPS cells.
Parental origin-specific expression of imprinted genes is typi-cally regulated by differential DNA methylation of paternal and maternal alleles in the germline. Imprinting of the Dlk1-Dio3 gene cluster is regulated by differentially methylated regions (DMRs), including a key intergenic region (IG-DMR) located between the
Dlk1 and Gtl2 genes (refs. 31, 33, and Figure 6B). We found that approximately 50% of IG-DMR CpG islands were methylated in the parental ES cells or tail-tip fibroblasts prior to reprogramming, as would be expected for germ line imprinted regions (Figure 6E). In contrast, close to 100% of IG-DMR CpG islands were methylated
in ST5 and ST8 cells, both before and after endodermal differentia-tion. Aberrant methylation of DNA CpG islands was not evident at other loci in iPS cells, such as the Oct4 proximal promoter region, which was appropriately reprogrammed to an exclusively unmeth- ylated state in both iPS cell lines and was amenable to developmen-tally appropriate initiation of CpG methylation during subsequent endodermal differentiation (Supplemental Figure 7). In addition, CpG islands around the transcriptional start site of the key endo- dermal master regulator, Foxa2, remained unmethylated in fibro- blasts, ES cells, and iPS cell lines both before and after endoder-mal differentiation (Supplemental Figure 7), indicating that, in contrast to Gtl2 gene regulation, epigenetic mechanisms distinct from CpG methylation are responsible for regulating expression of Foxa2 early in development. Taken together our findings sup-port recent reports (20) suggesting that iPS cells exhibit aberrant imprinting of the Dlk1-Dio3 gene cluster in an exclusively paternal pattern, with resultant silencing of maternally expressed genes and overexpression of the paternally expressed imprinted gene, Dlk1.
[image:9.585.78.502.80.442.2]We speculated that gene expression differences between ES and iPS cell lines might be particularly important if these differences
Figure 4
Methodology for purification of ES/iPS cell–derived endoderm. (A) Representative flow cytometry analysis of ckit and Sox2 expression levels in iPS cells after 5 days of directed differentiation and expression of CXCR4 and ENDM1 cell surface markers within each indicated subgate. (B) Comparison of gene expression profiles (qRT-PCR) of Sox2-GFPdim/ckit+ and Sox2-GFPbright/ckit– sorted cell populations. Sox2-GFPdim/ckit+
fractions preferentially express endodermal gene markers, while Sox2-GFPbright/ckit– fraction expresses residual Rex1 and the neuroectodermal
were associated with an altered capacity to undergo directed dif-ferentiation or lineage specification to desired target cell lineages, such as endoderm. Indeed deletion of maternally inherited Gtl2 in mice is known to result in early postnatal defects in at least 2 endo-dermally derived epithelia, such as pulmonary alveolar hypoplasia
[image:10.585.43.540.75.541.2]and hepatocellular necrosis (32). Thus, we sought to determine whether silencing of Gtl2 due to aberrant imprinting of the Dlk1-Dio3 gene cluster in iPS cells might be associated with altered endo-dermal differentiation capacity compared with ES cells. Although we had found no detectable difference among ST5 cells, ST8 iPS
Figure 5
cells, and ES cells in terms of upregulation of early endodermal markers (Figures 2 and 3), we did note that significant differential expression of BMP4 emerged during endoderm differentiation (3.5-fold higher expression in iPS cells than ES cells; interaction of time and cell type, P = 0.008). Since BMP4 is one predicted target of miRNA-380, encoded in the Dlk1-Dio3 cluster and aberrantly silenced in iPS cells (Table 1), differential upregulation of BMP4 between iPS and ES cells during endoderm differentiation would be expected. Since higher expression levels of BMP4 and Dlk1 in endodermal precursors may potentially impact their capacity to undergo liver lineage specification and differentiation (14, 34, 35), we quantified hepatic lineage specification across all 3 cell lines and noted the induction of Afp, α-1 antitrypsin, and albumin in ST5 and ST8 iPS clones to be greater than that in their parental ES cells in 4 out of 4 repeated experiments (Figure 3, C and D). Thus, the aberrant imprinting of the Dlk1-Dio3 gene cluster in ST5 and ST8 iPS cell lines did not appear to be associated with any detect-able decrement in the capacity of those lines to undergo directed differentiation to DE or early hepatic lineage specification in vitro. Only after further hepatic differentiation to day 19 did 1 out of the 2 aberrantly imprinted clones (ST8) show a statistically signifi-cant, yet subtle, functional decrement in glycogen storage capacity relative to that of ES cells (P = 0.03; Figure 3E).
Discussion Our results indicate that iPS and ES cells undergo directed differ-entiation to DE with induction of remarkably similar global gene expression programs. The key pioneer factors and transcriptional regulators known to be important in DE development, such as Foxa2, Gata4/6, and Sox17 (36, 37), are all similarly upregulated during endodermal directed differentiation of ES and iPS cells, and the waves of marker genes (e.g., Afp and Alb ) expressed during sub-sequent lineage specification of ES and iPS cell–derived endoderm also follows a sequence that has been described in the developing embryo. Beyond these specific individual genes, our results indicate significant overlap in the global gene expression programs of DE precursors derived in vitro from pluripotent stem cells compared with that of embryonic DE from the developing mouse embryo. We found ES and iPS cells do differ significantly in the expression levels of other genes encoded or targeted by transcripts normally expressed from the imprinted Dlk1-Dio3 gene cluster. Aberrant imprinting of this gene cluster in the majority of mouse iPS cell lines in the undifferentiated state was recently described and was found to correlate with impaired functional capacity of iPS cells to form “all-iPS–derived mice” after transplantation into 4n blas-tocysts (20, 38). While genes in this cluster have also been reported to have functional roles in mouse development (30–33), we found a surprisingly intact capacity of aberrantly imprinted iPS cells to undergo directed differentiation into DE in vitro. This is in marked contrast to recent observations of a reduced capacity of human iPS cell lines to undergo neuronal directed differentiation, compared with ES cells (19). Since the iPS cell–derived early hepatic lineages that co-express Afp and albumin in our studies correlate roughly to E8.5–E10.5 in the mouse embryo, this developmental stage may be too early to detect defects in iPS cell–derived liver cells. Indeed, liver abnormalities in mice with deletions of maternally inherited Gtl2 genes were only evident postnatally, and in mice with unipa-rental paternal disomy of distal chromosome 12, lethality was only evident at midgestation (30, 32, 33, 39). Although, the aberrantly imprinted iPS cells in our studies were able to contribute efficient-ly to E11.5 mouse chimeras after blastocyst transplantation (25), displayed germ line competence, and formed chimeric postnatal mice with high coat color chimerism (Supplemental Figure 1) and grossly normal chimeric lungs and livers (25), it remains possible that a detailed functional evaluation of mature endodermal tissues in vivo might reveal more subtle abnormalities of iPS cell–derived endodermal epithelia. Conversely, it is also possible that increased expression lev-els of Dlk1 and BMP4 in aberrantly imprinted iPS cells might result in faster or more efficient endodermal or hepatic differ-entiation. Although expression levels of Afp and albumin were higher in both our iPS cell clones than in ES cells, evaluation of many more syngeneic iPS and ES cell clones would be required to sufficiently test this hypothesis. In addition, derivation of syngeneic properly imprinted iPS cell lines would be required to definitively assess the effects of aberrant imprinting on iPS cell differentiation capacity. Overall our results have considerable implications for those wishing to develop cell-based therapies to reconstitute diseased endoderm-derived tissues. Regardless of imprinted status, iPS cells can be differentiated efficiently into DE precursors using the same serum-free culture protocols developed to derive endoderm from ES cells. As with ES cells, flow cytometry–based sorting algorithms can be devised to both reduce heterogeneity of iPS cell–derived populations and to reduce the presence of undifferentiated cells expressing residual Nanog or Rex1. Future studies will now need to focus on the relevance of aberrant imprinting in iPS cells to in vivo functioning of iPS cell–derived endodermal lineages. Methods
ES and iPS cell culture. Undifferentiated ES and iPS cells were expanded on mitomycin C–inactivated mouse embryonic fibroblasts. Prior to differen-tiation, all ES and iPS cell lines were adapted to serum-free maintenance media, consisting of 50% Neurobasal medium (Gibco), 50% DMEM/ F12 medium (Gibco) supplemented with N2 and B27+RA supplements (Gibco), 1% penicillin/streptomycin, 0.05% BSA, 10 ng/ml LIF, 200 mM l-glutamine, 10 ng/ml human BMP-4 (R&D Systems), and 4.5 × 10⁻⁴ M
monothioglycerol (MTG) (Sigma-Aldrich). The following mouse ES cell Figure 6
Analysis of cell-type effects between ES and iPS cell samples, regard-less of differentiation stage, reveals aberrant silencing of genes encod-ed by the Dlk1-Dio3–imprinted gene cluster on chromosome 12qF1. (A) Unsupervised clustering analysis of the top 111 transcripts differ-entially expressed due to cell-type effects, based on 2-way ANOVA with FDR< 0.001. Yellow highlighting indicates the 36 transcripts that localize to chromosome 12qF1 in the region of the Dlk1-Dio3
gene cluster. (B) Schematic representation of the mouse Dlk1-Dio3– imprinted gene cluster. (C) Validation of microarray analysis through qRT-PCR quantification of each indicated gene, normalized to 18S rRNA (n = 3; data shown as average ± SEM). (D) qRT-PCR analysis of Gtl2 expression kinetics during 15 days of endoderm differentia-tion, followed by hepatic lineage specification. During differentiadifferentia-tion,
research article
lines were used where indicated in the text: 129/Ola T-GFP/Foxa2-hCD4 cells (13) (a gift of Gordon Keller, Mount Sinai School of Medicine); ES_ W4129S6 cells (Taconic); ES-C57BL/6 (ATCC SCRC-1002); and ES Sox2- GFP Rosa26-M2RTTA cells (26) (a gift of Konrad Hochedlinger, Massa-chusetts General Hospital, Boston, Massachusetts, USA). The mouse iPS cell lines included iPS-2D4 (12) (gift of Konrad Hochedlinger), generated previously with 4 retroviral vectors; iPS-ST5 and ST8, generated previously with pHAGE-Tet-STEMCCA reprogramming vector (25); and SEF4 and 11, generated previously with pHAGE-EF1a-STEMCCA (25). The mouse iPS Oct4-GFP cell line was generated by infecting tail-tip fibroblasts from a postnatal Oct4-GFP Rosa26-M2RTTA knockin mouse (40) with the doxy-cycline-inducible pHAGE-Tet-STEMCCA lentivirus, and colonies were picked for passaging after 20 days as previously described (25).ES and iPS cell endoderm and hepatocyte differentiation. DE differentiation was performed in serum-free differentiation (SFD) medium, consisting of 75% IMDM (Gibco), 25% Ham’s Modified F12 (Cellgro) with N2 and B27+RA supplements, 0.05% supplemented with 200 mM l-glutamine, 0.05 mg/ml ascorbic acid (Sigma-Aldrich), and 4.5 × 10⁻⁴
MTG as previ-ously described (14). Briefly, ES or iPS cells were plated under nonadherent conditions and allowed to spontaneously differentiate and form embryoid bodies (EBs) for 2 days. On day 2, EBs were trypsinized and reaggregated in complete SFD medium with 50 ng/ml Activin A (R&D Systems). On day 5, EBs were dissociated and harvested for RNA extraction, DNA extraction, or flow cytometry. For hepatocyte differentiation, day 4 EBs were trypsinized and reaggregated in SFD medium supplemented with 200 mM l -gluta-mine, 4.5 × 10⁻⁴
M MTG, 50 ng/ml Activin A, 50 ng/ml BMP-4 (R&D Sys- tems), 10 ng/ml bFGF (R&D Systems), and 10 ng/ml VEGF (R&D Sys-tems). On day 5, EBs were trypsinized and plated on gelatin-coated plates with SFD medium supplemented with 200 mM l-glutamine, 4.5 × 10⁻⁴M
MTG, 50 ng/ml BMP-4, 20 ng/ml EGF (R&D Systems), 10 ng/ml FGF2, 20 ng/ml HGF (R&D Systems), 20 ng/ml TGF-α (R&D Systems), 10 ng/ml VEGF, and 10–7
M dexamethasone. For pancreatic differentiation, activin-stimulated ES and iPS cells were exposed to KAAD-cyclopamine, FGF10, and retinoic acid, according to an established differentiation protocol (29) detailed in the Supplemental Methods.
Flow cytometry and cell sorting . EBs were dissociated with trypsin/EDTA (1 min-ute, 37°C) and stained for 30 minutes on ice with the following monoclonal antibodies: APC-conjugated anti-mouse c-kit (BD Biosciences), PE-conjugated anti-human CD4 (Caltag), anti-mouse CXCR4-biotin/streptavidin-Cy7APC (BD Biosciences), or non-conjugated anti-mouse ENDM1 (28), followed by APC-conjugated donkey anti-rat IgG. Parallel aliquots of each sample were exposed to nonspecific isotype control antibodies. Cells were either analyzed using an LSRII machine (BD Biosciences) or sorted using a MoFlo High Speed Cell Sorter (DAKO). Detailed methods for characterizing sorted cell popula- tions by assessment of glycogen storage capacity, kidney capsule transplanta-tions, immunostainings, and CpG methylation mapping are available in the Supplemental Methods. All animal studies were approved by the Institutional Animal Care and Use Committee of Boston University School of Medicine. qRT-PCR. Total RNA extraction was performed using an miRNeasy Mini Kit (Qiagen), and 1 μg DNAse-treated RNA was reverse transcribed using TaqMan Reverse Transcription Reagents (Applied Biosystems). qRT-PCR of cDNAs was performed in a StepOnePlus Real-Time PCR System (Applied Biosystems) using TaqMan inventoried primers. The SYBR Green System (Applied Biosystems) was used for Dlk1, Gtl2, Rian, and Oct4. A full inven-tory of all probes and primers is available in the Supplemental Methods. Reactions were performed in duplicate, using 1:20 diluted cDNA. mRNA expression levels were normalized to 18S rRNA or GAPDH, and quantifica-tion of relative gene expression, presented as fold change compared with the relevant baseline, was calculated using the 2-[delta][delta]CT method. Biological replicates from repeat experiments were used to calculate aver-age fold change as well as the SEM for each fold change in gene expression, represented by error bars where indicated.
Microarrays and bioinformatics analysis of cell cultures and mouse embryos. All ES cell– and iPS cell–derived samples were purified by flow cytom-etry sorting of either Sox2-GFPbright
undifferentiated (day 0) cells or dif-ferentiated (day 5) cells, using the sort gate detailed in the text. Three biological replicates of each of 3 cell lines (ES, ST5, and ST8) at 2 time points were prepared (total 18 samples), and total RNA was extracted using a miRNeasy Mini Kit (Qiagen). Quality-assessed RNA samples were hybridized to Affymetrix GeneChip Mouse Gene 1.0 ST arrays, which fea-ture probe sets for 28,853 genes and 344 microRNAs, with an average of 27 probes spread across the full length of each gene. Eighteen raw data files obtained by the Affymetrix scanner passed data quality control steps prior to RMA normalization through the Affymetrix expression console. The normalized data underwent statistical analysis as follows: 2-way ANOVA was used to determine differentially expressed genes affected by cell type, time, and the interaction between cell type and time, using FDR-adjusted P values indicated in the text.
To assess the transcriptome of embryonic DE, previously published DNAse-treated RNA extracts from developing mouse E8.25 DE were used (28) (a gift of Gordon Keller). Three biological replicates of these RNA extracts (embryonic DE) were obtained from 25,000–35,000 cells, sorted from pooled E8.25 mouse embryos, based on an established EpCam+/
ENDM1+/side scatter low algorithm (28). Amplified cDNAs from the 3
[image:13.585.53.276.124.287.2]embryonic DE RNA extracts and 3 replicates each of extracts from day 0 and day 5 sorted ES cells (9 samples total) were prepared using the WT- OvationT Pico System (NuGEN), converted into sense-strand cDNA tar-gets using WT-Ovation Exon Module (NuGEN), and finally labeled with the Encore Biotin Module (NuGEN) for analysis on Affymetrix GeneChip Mouse Gene 1.0 ST arrays. For statistical analysis of these 9 samples, 1-way ANOVA and follow-up post-hoc analysis was used to identify genes differ- entially expressed between day 0 ES cells and embryonic DE, with an FDR-adjusted P value cutoff of 0.001. All microarray data files are available for free download at the Gene Expression Omnibus (GEO accession number GSE27087; http://www.ncbi.nlm.nih.gov/geo/).
Table 1
Top differentially expressed transcripts in iPS cells versus ES cells with ±4 fold change
FC Transcript mRNA accession P valueB
(iPS/ES cells)A
–4.1 RianC AF357355 2.74 × 10⁻¹²
–3.3 Mir380C mmu-mir-380 7.22 × 10⁻⁶
–2.9 Mir410C mmu-mir-410 9.67 × 10⁻⁷
–2.9 Mir382C mmu-mir-382 9.67 × 10⁻⁷
–2.8 Mir300C mmu-mir-300 5.84 × 10⁻⁷
–2.7 Mir377C mmu-mir-377 2.80 × 10⁻⁵
–2.7 Gtl2C NR_003633 1.45 × 10⁻⁵
–2.6 Mir329C mmu-mir-329 4.45 × 10⁻⁷
–2.3 Mir381C mmu-mir-381 0.00057
–2.2 Mir539C mmu-mir-539 0.00032
–2.2 Mir487bC mmu-mir-487b 4.31 × 10⁻⁵
–2.1 Mir411C mmu-mir-411 0.001
6.6 Nr1h5 NM_198658 2.09 × 10⁻⁸ Top fold change (FC) values (log2 transformed) for iPS cells versus ES
cells (subset of FDR < 0.001) are shown. AFold change values shown