© 2017, IRJET | Impact Factor value: 5.181 | ISO 9001:2008 Certified Journal
| Page 1324
MULTI OBJECTIVE OPTIMIZATION OF PLASTIC WELDING PARAMETERS
IN USPW OF PMMA CM-205 USING GREY RELATIONAL ANALYSIS
Sathananthan R
1, Madhu Mohan
2, Dr. Suresh K S
31
PG Scholar, Dept. Of Mechanical Engineering
NSS College of Engineering, Palakkad-8
2,3
Assistant Professor, Dept. of Mechanical Engineering
N S S College of Engineering, Palakkad-8
---***---Abstract -
Ultrasonic Plastic Welding (USPW) has received significant attention in the past few years and has become more durable & suitable for a wide range of uses. The major aspect of this study is to have a good understanding of the joint design will ensure the good quality of weld. Since, the joint configurations find its most importance in USPW to ensure that plastic assemblies are adequately joined. Because, the joint configurations is considered to be one of the major influencing parameter that responsible for transferring energy to the welding zone & the main objectives of this study investigate and evaluate the effect of different USPW parameters (Joint configurations, Hold time, Weld time & Pressure) on welding tensile strength & percent elongation of PMMA. Poly(methyl methacrylate) PMMA is also known as acrylic glass, it is a transparent thermoplastic and is used as an shatter- resistant alternative to glass. It is having a very wide range of applications in automobile industry like, assembling vehicle light units and dashboard instruments etc.., In this paper various parameters involved in USPW of PMMA is investigated for obtaining optimal welding condition at which the maximum weld joint strength can achieve to improve weld-ability of plastic material & production rate. Minitab 17 is used for L27 full factorial DOE & Taguchi method is used for analysis. Grey Relational Analysis (GRA) method was employed to determine the optimal set of parameters for the best quality of weld.Key words: USPW, PMMA, Minitab 17, Taguchi design, GRA
1. INTRODUCTION
1.1
Importance of Plastics in Engineering:
Within the basic engineering materials widely utilized and accepted now a days, plastics have attained firm place. As with any particular material or materials, plastics in general are no issues for design problems. However, necessary degree of action is to be taken in their application otherwise disappointing results may lead to wrong
impressions regarding their more possible advantages. As is characteristic with other types of production, where machining, fitting, assembling and finishing operations can be minimized/ eliminated, plastics molding may prove highly in economical. The critical design consideration thus highly that of suitability of the material for the uses. The suitability factor cannot be over-emphasized. Properly applied plastic materials provide a host of unusual properties which suit them for a wide range of applications. Generally, Plastics are strong, light, highly di-electric in nature, workable, corrosion and chemical resistant and durable. Satisfactory applications range over a wide variety of machine parts from hard wheels, gears and levers to housing, frames, and insulators. It would be difficult to think our modem world without plastics. Now a day’s they are an integral part of everyone’s lifestyle with applications varying from commonplace domestic articles to modern scientific and medical instruments. Today designers and engineers readily turn to plastics because they provide combinations of properties which are not available in any other materials. Plastics provides advantages such as lightness, resilience, resistance to corrosion, colour, fastness, transparency, ease of processing, etc., and although they have their own limitations like burns out or distorted at higher temperature, their developments is limited only by the ingenuity of the designers.[1]
1.2
What is ultrasonic?
© 2017, IRJET | Impact Factor value: 5.181 | ISO 9001:2008 Certified Journal
| Page 1325
low-and high-intensity applications. In low-intensityapplications, the intent is to convey information about or through a system, while in high-intensity applications; the intent is to permanently alter a system. To some extent, the low- and high-intensity fields are also delineated by a frequency range and power level. Thus, low-intensity applications typically involve frequencies on the order of 106Hz or higher and power levels on the order of mille watts. High-intensity applications will typically involve frequencies of 5 to 100 kHz and powers of hundreds to thousands of watts. In actual fact, the total frequency range of all ultrasonic applications is enormous, ranging from 5-10 kHz to as high as 10 GHz. There are also applications, such as sonar, which are exceptions to the previous categorizations, since intense power levels are involved in conveying information via underwater sound.[2]
1.3
Concept of Ultrasonic plastic Welding
:
Ultrasonic plastic welding is the joining of plastic through the use of heat generated from high-frequency mechanical motion. It is accomplished by converting high-frequency electrical energy into high-high-frequency mechanical motion. That mechanical motion, along with applied force, creates frictional heat at the plastic components mating surfaces (joint area) so the plastic material will melt and form a molecular bond between the parts. No solvents, adhesives, mechanical fasteners, or other consumables are required, and finished assemblies are strong and clean. Ultrasonic plastic Welding is the fastest and most cost effective method used today to join and assemble plastic parts. Ultrasonic plastic welding is cost effective and a green technology. Ultrasonic welding eliminates the need to use fasteners, glues and/or solvents. Ultrasonic plastic Welding can be used to join all rigid thermoplastics. Ultrasonic welding uses an acoustic tool called an ultrasonic horn made to match your parts design. Ultrasonic Welding is converted to heat through friction that melts the plastic. The main components of an ultrasonic welding system are the actuator and power supply, converter/booster and ultrasonic horn, part holding weld fixture/jig.[3]
1.4
Ultrasonic Plastic Welding Principle:
[image:2.595.307.557.100.280.2]Connecting hard plastics by ultrasonic is done through friction on the contact surfaces. The principle is to touch the surface of the work pieces vertically with a tool that oscillates with a high frequency (e.g.20 KHz). This tool, oscillating with the frequency produced by the machine (called sonotrode) touches the plastic work piece & transfers energy.
Figure -1: Principle of USPW [6]
The work piece as the element of energy transformation gets the most possible energy for the welding process if the losses between the two contact surfaces of sonotrode and plastic are the smallest possible. The work piece begins to oscillate in the standing transverse wave train, and the maximum begins to form itself on the contact surfaces of the two pieces of plastic to be connected. This phenomena is similar to the one discovered by MELDE, called the effect of the oscillating ropes (loop of oscillation at the loose end!). Under the effect of the ultrasonic, transmitted through the sonotrode, the energized part begins oscillating on its surface in a locally limited way, while the other part – the one to be connected – does not move. Under the influence of a set pressure, superimposed by ultrasonic, a secondary friction of a high frequency begins to heat up the contact surfaces of the parts to be connected. The plastic melts immediately and after cooling off a sturdy & homogeneous weld is obtained.
2. EXPERIMENTAL PROCEDURES
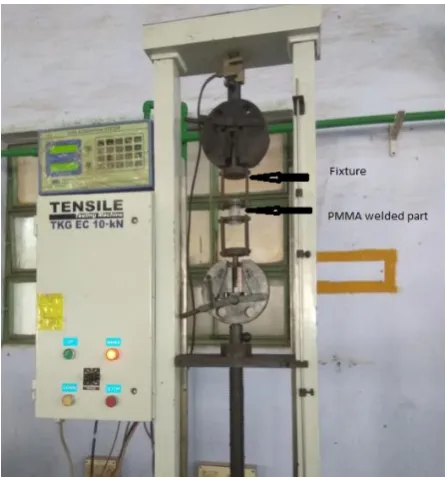
2.1 Experimental Setup
© 2017, IRJET | Impact Factor value: 5.181 | ISO 9001:2008 Certified Journal
| Page 1326
Figure -2: USPW MachineHorn made of Al-Ti alloy was used for this study. The horn (Bezier) used for welding had diameters of 28 and 30mm for near field welding, the material investigated is PMMA (amorphous).
Table -1: Properties of PMMA
Material PMMA cm-205
Colour Transparent
Density (ρ) 1190
Melting point ( (104-118)
Decomposition temperature ( >288
Flexural modulus (GPa) 2.8
Maximum tensile strength (Mpa) 70
Maximum tensile elongation (%) 12
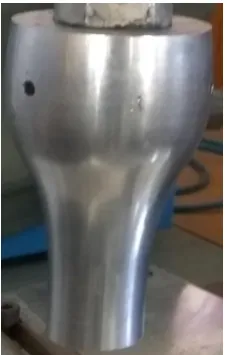
The standard sample shown in Figure 3 (developed by Nedulandse Philips) [5] was used for analysis and experimental work.
Figure -3: Model used for analysis and experimental work
[image:3.595.43.277.437.646.2]A standardized sample (which was developed by Nedulandse Philips) was used in all the experiments in near field welding. The specimen with different energy directors were made by injection molding. A ZWICK 1484 tensile tester was used to measure the strengths of the welded joints. Test procedures according to ASTM standard D638-97 (Standard Test Method for Tensile properties of plastics) were used. The deformation rate used in the testing was 20 mm/min.
[image:3.595.331.555.449.688.2]© 2017, IRJET | Impact Factor value: 5.181 | ISO 9001:2008 Certified Journal
| Page 1327
2.2 USPW Parameters
Table -2: Properties of PMMA
Parameter Levels
1 2 3
Joint Configuration T C S
Hold Time (sec) 2 2.5 3
Weld Time (sec) 2 2.25 2.5
Pressure (bar) 2 2.5 3
An experiment must be designed so that the information about the parameters affecting the process and inference about the system can be drawn with minimum of efforts & time being consumed. Design of Experiments (DOE) is a methodology which helps us exactly do this. Hence, the experimental work is planned using the DOE procedure. The design of experiments is indicated in Table 3. The first & foremost consideration is to select the parameters which are to be controlled i.e. independent variables or confounding variables & the parameters that are to be measured as the response parameters representing the quality of the process. The key parameters for ultrasonic plastic welding are joint configurations, hold time, weld time & pressure.
[image:4.595.105.219.522.700.2]Tensile strength and Percentage of elongation at breaking load are taken as the response variables. The frequency of generator is not taken as parameter for the experiment. as the machine is having fixed generator frequency (i.e. 20 kHz). Also the Bezier horn [4] as shown in figure 5. Is tuned at only one frequency.
Figure -5: Bezier shaped Horn
3. RESULTS AND DISCUSSIONS
Experiments were conducted as per L27 full factorial DOE. The results obtained after USPW is represented in Table 4.
Table -3: Design of Experiments
Exp. No.
Joint Configuration
Hold Time (sec)
Weld Time (sec)
Pressure (bar)
1 T 2 2 2
2 T 2 2.25 2.5
3 T 2 2.5 3
4 T 2.5 2 2.5
5 T 2.5 2.25 3
6 T 2.5 2.5 2
7 T 3 2 3
8 T 3 2.25 2
9 T 3 2.5 2.5
10 C 2 2 2
11 C 2 2.25 2.5
12 C 2 2.5 3
13 C 2.5 2 2.5
14 C 2.5 2.25 3
15 C 2.5 2.5 2
16 C 3 2 3
17 C 3 2.25 2
18 C 3 2.5 2.5
19 S 2 2 2
20 S 2 2.25 2.5
21 S 2 2.5 3
22 S 2.5 2 2.5
23 S 2.5 2.25 3
24 S 2.5 2.5 2
25 S 3 2 3
26 S 3 2.25 2
27 S 3 2.5 2.5
© 2017, IRJET | Impact Factor value: 5.181 | ISO 9001:2008 Certified Journal
| Page 1328
noise ratios of the output responses were found using higherthe better criterion for both the Tensile strength and Percentage of elongation. The values of S/N ratios are shown in Table 5.Now, the grey relational coefficients and grey relational grades are calculated as shown in the Table 6 and Table 7 respectively.
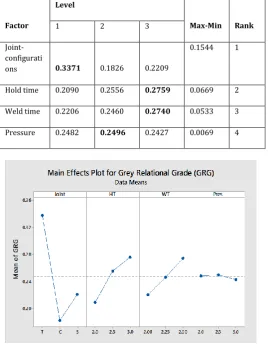
Higher the GRG, higher is the performance.Table 8 presents response table for mean of GRG. From this table, it is clear that that the most influencing factor is Joint configurations. Then it is Hold time, weld time and finally the pressure. Also, from this table, we obtain the optimum set of parameters. The optimum parameters was predicted to be Triangular shaped joint configurations, Hold time = 3sec, Weld time = 2.5sec and Pressure = 2.5bar. Figure 9 depicts the same things discussed in the response table. Optimum sets of parameters are those levels in which the mean of GRG is maximum.
(a)
[image:5.595.331.537.94.291.2](b)
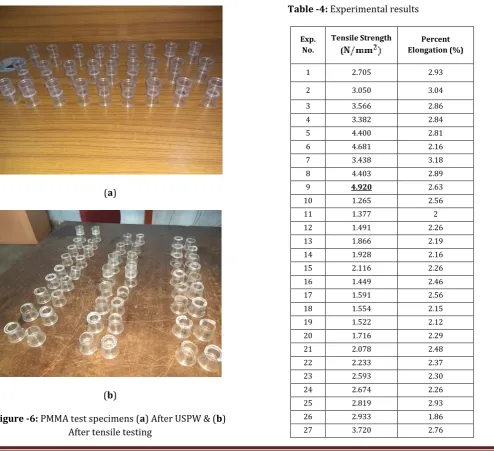
Figure -6: PMMA test specimens (a) After USPW & (b) After tensile testing
Figure -7: Stress vs Strain curve of PMMA
Table -4: Experimental results
Exp. No.
Tensile Strength (
Percent Elongation (%)
1 2.705 2.93
2 3.050 3.04
3 3.566 2.86
4 3.382 2.84
5 4.400 2.81
6 4.681 2.16
7 3.438 3.18
8 4.403 2.89
9 4.920 2.63
10 1.265 2.56
11 1.377 2
12 1.491 2.26
13 1.866 2.19
14 1.928 2.16
15 2.116 2.26
16 1.449 2.46
17 1.591 2.56
18 1.554 2.15
19 1.522 2.12
20 1.716 2.29
21 2.078 2.48
22 2.233 2.37
23 2.593 2.30
24 2.674 2.26
25 2.819 2.93
26 2.933 1.86
[image:5.595.51.546.328.779.2]© 2017, IRJET | Impact Factor value: 5.181 | ISO 9001:2008 Certified Journal
| Page 1329
Table -5: Values of S/N ratios0 S/N (T.S) S/N (% E)
1 8.6433 9.3374
2 9.6860 9.6575
3 11.0436 9.1273
4 10.5835 9.0664
5 12.8691 8.9741
6 13.4068 6.6891
7 10.7261 10.0485
8 12.8750 9.2180
9 13.8393 8.3991
10 2.0418 8.1648
11 2.7787 6.0206
12 3.4696 7.0822
13 5.4182 6.8089
14 5.7021 6.6891
15 6.5103 7.0822
16 3.2214 7.8187
17 4.0334 8.1648
18 3.8290 6.6488
19 3.6483 6.5267
20 4.6903 7.1967
21 6.3529 7.8890
22 6.9778 7.4950
23 8.2761 7.2346
24 8.5432 7.0822
25 9.0019 9.3374
26 9.3462 5.3903
27 11.4109 8.8182
Table -6:Grey Relational Coefficients
Exp No.
Grey Relational Coefficient
Tensile Strength GRC Elongation GRC
1 0.4520 0.7252
2 0.4942 0.8250
3 0.5744 0.6734
4 0.5430 0.6600
5 0.7784 0.6407
6 0.8843 0.3928
7 0.5521 1.0000
8 0.7794 0.6947
9 1.0000 0.5454
10 0.3333 0.5156
11 0.3402 0.3586
12 0.3476 0.4177
13 0.3743 0.4000
14 0.3791 0.3928
15 0.3945 0.4177
16 0.3449 0.4782
17 0.3544 0.5156
18 0.3518 0.3905
19 0.3497 0.3837
20 0.3632 0.4258
21 0.3913 0.4852
22 0.4048 0.4489
23 0.4398 0.4285
24 0.4486 0.4177
25 0.4651 0.7252
26 0.4790 0.3333
27 0.6036 0.6111
Table -7:Grey Relational Grades
Exp No. GRG Rank
1
0.2396 11
2
0.2636 9
3
0.2921 7
4
0.2773 8
5
0.3823 4
6
0.4175 2
7
0.2984 6
8
0.3855 3
9
0.4772 1
10
0.1757 26
11 0.1710 27
12
0.1773 24
13
0.1884 19
14
0.1902 18
15
0.1984 17
16
© 2017, IRJET | Impact Factor value: 5.181 | ISO 9001:2008 Certified Journal
| Page 1330
170.1852 20
18 0.1778 23
19
0.1765 25
20
0.1847 21
21 0.2003 16
22
0.2046 15
23
0.2193 14
24 0.2227 13
25
0.2455 10
26
0.2322 12
27
[image:7.595.45.279.96.269.2]0.3021 5
[image:7.595.308.559.134.255.2]Table 9 presents the results of USPW performance using initial and optimal input variables. The results show that the GRG has improved while USPW using the predicted optimum sets of parameters.
Table -8: Response table for mean of GRG
Figure -8: Main effects plot for GRG
Table -9: Results of USPW performance using initial and optimal input variables
Initial parameter
setting
Optimal USPW parameter
Predicted Experimental
Setting level A1 B1 C1 D1
A1 B3 C3 D2
A1 B3 C3 D2
Tensile Strength
2.7050 4.9200
% Elongation 2.93 2.63
GRG 0.2396 0.4772
Improvement in GRG =0.2376
3. CONCLUSIONS
Experimental study on USPW of PMMA CM-205 has been done using a Bezier horn. The following conclusions were made.
1. From GRA method, the most influential factor affecting the quality of weld was joint configuration. Then hold time, weld time & pressure respectively. A Triangular shaped energy director shows the best quality weld than the other shaped (circular & square) energy directors.
2. The predicted optimum parameters was Triangular shaped joint configurations, hold time 3 sec, weld time of 2.5 sec & pressure of 2.5 bar.
3. The GRG of optimum parameter yielded an improvement of 0.2376. Therefore, it can be concluded that GRA method coupled with Taguchi design of experiments can improve the weld quality. 4. From this experimental study, the results show that, the values obtained for one of the response variable i.e., percentage of elongation having the values in the range of (2-2.5%). So we can able to conclude that, the values of percent elongation at the break load is very less for PMMA specimen as compared to the other materials, due to its brittle behavior in response to applied load. Nonetheless, brittle nature can be minimized by adding rubber toughening into the specimen to increase the toughness of PMMA, owing to its brittle behavior in response to applied load.
Results of present study have been very much useful to choose the optimal welding condition, at which the maximum weld joint-strength can achieve to improve weld-ability of non-metallic materials and production rate.
Factor
Level
Max-Min Rank
1 2 3
Joint-configurati
ons 0.3371 0.1826 0.2209
0.1544 1
Hold time 0.2090 0.2556 0.2759 0.0669 2
Weld time 0.2206 0.2460 0.2740 0.0533 3
[image:7.595.31.300.378.723.2]© 2017, IRJET | Impact Factor value: 5.181 | ISO 9001:2008 Certified Journal
| Page 1331
ACKNOWLEDGEMENTThe authors gratefully acknowledge the support provided by the N. S. S. College of Engineering for this study. Thanks are due to the Management and the Principal, PSG College of Technology, Coimbatore for providing the necessary infrastructure to setup the laboratory with Department of Production Engineering, PSG College of Technology for the tensile testing of specimens is gratefully acknowledged.
REFERENCES
[1] Rajani(2008)A M.Tech Thesis on “some investigations in effect of ultrasonic welding process parameters on lap joint of plastics.”
[2] K.C.Srivastava “Hand book of ultrasonic testing” published by International-2001(page no.1).
[3] Sunil K. Patel, A thesis on “Experimental investigation and Parametric characteristics of an Ultrasonic Plastic Welding for ABS, Polycarbonate and Acrylic material,” Ganpat University.
[4] M.Roopa Rani, R. Rudramoorthy, Computational modeling and experimental studies of the dynamic performance of ultrasonic horn profiles used in plastic welding, 2012
[5] A. Benatar, R.V. Eswaran, S.K. Nayar, Ultrasonic welding of thermoplastics in the near field, Polym. Eng. Sci. 29 (23) (1989) 1689–1698.
[6] http://www.bransoneurope.eu/products/ultrasonic-welding/technology
BIOGRAPHIES
![Figure -1: Principle of USPW [6]](https://thumb-us.123doks.com/thumbv2/123dok_us/8159634.805287/2.595.307.557.100.280/figure-principle-of-uspw.webp)