© 2016, IRJET | Impact Factor value: 4.45 | ISO 9001:2008 Certified Journal
| Page 107
Internet based Smart Poultry Farm using LabVIEW
Sneha. M
1, T. N. Raghavendra
2, Dr. H. Prasanna Kumar
3
PG Scholar (C&I), Dept. of EE, UVCE, Bangalore, Karnataka, India
1Assistant Professor, Dept. of EE, UVCE, Bangalore, Karnataka, India
2Assistant Professor, Dept. of EE, UVCE, Bangalore, Karnataka, India
3---***---Abstract
-
Contemporary agriculture must incorporateautomation to improve production efficiency; hence automation is crucial in poultry farming industry too. This paper deals with the integration of wireless sensors and mobile system network to control and monitor following environmental parameters: temperature, relative humidity, air impurity levels in a poultry farm. DHT22 sensor module is used for temperature and relative humidity measurements. MQ135 sensor module is used for air pollution level measurement. Temperature and relative humidity are remotely monitored through internet. Remote monitoring is achieved by means of a computer system that acquires values sensed by sensor and communicates the same to a smart phone connected to the internet. Values of measured variables can be monitored in any smart phone that has the app DATA DASHBOARD FOR LABVIEW installed in it. Only temperature control is dealt with in this paper since temperature is the most crucial factor in the environment of a poultry farm.
Key Words: Contemporary Agriculture, automation, DHT22, MQ135, Data Dashboard FOR LabVIEW.
1. INTRODUCTION
In the past few decades, there has been an increase in awareness regarding the safety factor of foodstuffs and high demand has become evident for quality in food. The demand for food supply has steeply increased as a result of the increase in the world’s population. Hence researchers have been putting considerable effort into methodologies to make food production more efficient and economic. The environmental conditions in poultry houses have major influence on the well being and health of production staff and also that of the birds. When the environmental standards are inadequate, respiratory, digestive and behavioral disorders are highly prevalent. Unhealthy birds cannot be expected to perform optimally.
A hatched chick cannot maintain a proper body temperature without help. In the first three weeks of life, a chick should not be exposed to cool temperatures. Exposing the young bird to cool temperatures(20°C or 70°F) for a day or two on the farm can cause the bird to die from heart problems later. Hence heated premises are a must for brooding. Temperature should be reduced by 3°C (5°F) per week, until the room temperature of 20°C (70°F) is reached. After six weeks of age, desirable temperature range is 18 to 21°C (65 to 70°F) .The most widely used source of heat is a heat lamp for small flocks of birds.
Relative humidity of over 70% is undesirable and should be contained through use of ventilation in buildings and if below 50%, it can result in large production of dust and air borne microbes. During the summer season, birds experience discomfort due to high humidity combined with high temperatures. High CO2 levels result in lethargic chicks with reduced weight gains, while high NH3 levels result in poor feed conversion, reduced weight gain and increased susceptibility to disease. Ammonia levels of around 25 ppm can depress growth and decrease feed conversion efficiency in broilers, and levels of 50-75 ppm have been found to increase mortality rates. Ammonia levels should not exceed 20 ppm over any 8-hour period or 35 ppm over any 10 minute period during the poultry production cycle. The general accepted level of CO2 in poultry production houses is 3000 ppm over a long period of time (8 hour) and 5000 ppm over a shorter period (10 minute).
© 2016, IRJET | Impact Factor value: 4.45 | ISO 9001:2008 Certified Journal
| Page 108
[image:2.595.42.283.160.490.2]2. SYSTEM MODEL
Fig. 1: Block Diagram of the system model built
The system model has been built for remotely monitoring temperature and humidity in a poultry farm through Internet and maintaining temperature at desired set point by implementing temperature control. Air pollution level is also monitored by means of a gas sensor. The designed system comprises of control and monitoring subsystems as shown in figure 1. Monitoring module comprises of digital temperature and humidity sensor (dht22) module and MQ-135 air quality sensor module while control module comprises of Arduino MEGA 2560 micro controller board. The above mentioned parameters are continuously monitored. Remote monitoring of data is made possible by the software application Data Dashboard for LabVIEW that is supported in android and iOS phones.
When temperature in the farm exceeds the set point (set in prior), fan is automatically switched ON. On the contrary,when the temperature falls below the set point,
bulb is switched ON for heating. DHT22 sensor measures values of temperature and relative humidity inside the farm. MQ135 sensor measures level of air pollution in the farm detecting the gases NH3 and C02. These two sensors are interfaced to microcontroller. Microcontroller controls on/off of relay thus controlling on/off of fan/bulb.
Remote monitoring of LabVIEW-based systems from a mobile platform is an important aspect to a flexible and efficient system. Data Dashboard for LabVIEW is a mobile application which enables the creation of custom user interfaces to monitor and control LabVIEW applications remotely. Here this software is used to monitor values of temperature and humidity.
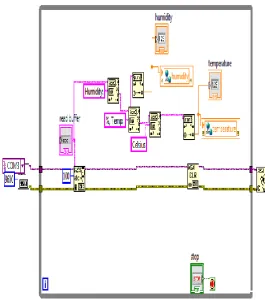
3. IMPLEMENTATION
Fig. 2: VI implemented
[image:2.595.306.572.338.639.2]NI-© 2016, IRJET | Impact Factor value: 4.45 | ISO 9001:2008 Certified Journal
| Page 109
VISA is supported by code written in Arduino IDE. [image:3.595.52.279.148.614.2]Flowchart of this code is shown in figure 3.
Fig. 3: Flowchart of code written in Arduino IDE
4. RESULTS AND DISCUSSION
When the VI is run, Temperature and Relative Humidity(RH) readings are displayed in numeric indicators and simultaneously displayed in charts. In chart indicator, measured variable is displayed as a function of time. For illustration of working of model, set point is set at 27℃. When temperature is beyond 27℃, fan is ON.
Values of measured variables displayed in serial monitor of Arduino IDE up until temperature reaches 27℃ is shown in table 1.
Temperature in ℃
Relative humidity in %
Air pollution level in ppm
27.3 52.50 48
27.3 52.50 48
27.3 52.30 47
27.3 52.30 47
27.2 52.90 47
27.2 52.70 47
27.2 52.90 46
27.2 52.70 46
27.1 52.70 46
27.1 52.50 46
27.1 52.60 46
27.1 52.80 46
27.1 52.90 46
Table 1: Readings displayed in serial monitor of Arduino IDE when the FAN is ON
Once value of temperature reaches 27℃, BULB is turned ON. Temperature drops to 26.9℃ and due to heating action of bulb, temperature crosses set point again and FAN is ON again. Temperature and RH readings recorded till 26.9℃ is shown in figure 4. Temperature and RH readings taken after crossing set point due to heating action of BULB is shown in figure 5.
[image:3.595.286.558.159.581.2]© 2016, IRJET | Impact Factor value: 4.45 | ISO 9001:2008 Certified Journal
| Page 110
indicator, shared values of measured variables will bedisplayed as shown below:
[image:4.595.370.482.117.313.2]Snapshots of RH and Temperature values displayed in the mobile system on which data dashboard app is run are shown in figure 6 and 7 respectively.
Fig. 4: Temperature(℃) and RH(%) readings recorded in front panel of VI when BULB is turned ON
Fig. 5: Temperature(℃) and RH(%) readings after the BULB is turned OFF
Fig 6: Snapshot of humidity reading displayed in dashboard
Fig 7: Snapshot of temperature reading displayed in dashboard
5. CONCLUSION
[image:4.595.39.299.176.320.2] [image:4.595.373.523.359.549.2] [image:4.595.37.299.469.645.2]© 2016, IRJET | Impact Factor value: 4.45 | ISO 9001:2008 Certified Journal
| Page 111
evaporative cooling. Body temperatures must remainclose to 41 degree centigrade; an increase beyond the regulated range (more than 4 degree centigrade) will result in an irreversible chain of thermoregulatory events. At these higher temperatures, the birds consume less food, and convert the feed less efficiently.
If ventilation is not sufficient, heat stress can occur at a variety of temperatures. In cooler climates, birds are susceptible to cold stress. Cold temperatures during the initial stages of the broiler cycle could result in impaired immune and digestive systems, which will result in reduced growth and an increased probability of contracting diseases. When birds lose heat at an uncontrolled rate, cold stress occurs. If bird feed is converted to heat energy for warmth, bird daily growth rate is reduced.
Since temperature is the most critical factor in the environment of the poultry farm, efficient control of temperature is implemented in the system model built in this project. Temperature and relative humidity levels can be monitored remotely by means of a mobile system.
FUTURE ENHANCEMENT
The concept of smart farming is quickly catching on in the agricultural business. Offering useful data collection and automated control techniques, there are certainly many advantages a networked farm has to offer over a regular farm. The system model built in this project is an example of networked farm. The developed system only monitors the parameters of poultry farm through internet, controlling of parameters is not implemented through internet. However, in future it may be possible to monitor and control the environmental parameters through the internet of things (IOT).
REFERENCES
[1] Drishti Kanjilal, Divyata Singh, Rakhi Reddy, Prof Jimmy Mathew, “Smart Farm: Extending Automation To The Farm Level”, International Journal Of Scientific & Technology Research, Volume 3, Issue 7, July 2014
[2] Rupali B. Mahale, Dr. S. S. Sonavane, “Smart Poultry Farm Monitoring Using IOT and Wireless Sensor Networks”, International Journal of Advanced Research in Computer Science,Volume 7, No. 3, May-June 2016
[3] Junho Bang, Injae Lee, Myungjun Noh, Jonggil Lim and Hun Oh, “Design and Implementation of a Smart Control System for Poultry Breeding's Optimal LED Environment”, International Journal of Control and Automation, Vol.7, No.2 (2014), pp.99-108
[4] Gerard Corkery, Shane Ward, Colum Kenny and Phil Hemmingway, “Incorporating Smart Sensing Technologies
into the Poultry Industry”, Journal of World's Poultry Research 3(4): 106-128, 2013
[5] Boopathy.S, Satheesh kumar.M, Mohamed Feroz.A, Dinesh.R, “Performance Optimization of Poultry Farm By Using Instrumentation with Help of Embedded Automation”, International Conference on Engineering Technology and Science-(ICETS’14), Volume 3, Special Issue 1, February 2014
[6] Rupali B. Mahale,Dr. S. S. Sonavane, “Smart Poultry Farm: An Integrated Solution Using WSN and GPRS Based Network”, International Journal of Advanced Research in Computer Engineering & Technology,Volume 5, Issue 6, June 2016