© 2017, IRJET | Impact Factor value: 5.181 | ISO 9001:2008 Certified Journal
| Page 3563
Multi-Objective Teaching Learning Based Optimization Technique for
Loss Reduction and Fast Voltage Stability Index Minimization
Mitali Chakravorty
1, Sarmila Patra
21
Lecturer, Department of Electrical Engineering, Assam Engineering Institute, Assam, India
2Associate Professor, Department of Electrical Engineering, Assam Engineering College, Assam, India
---***---Abstract -
This paper presents the application ofMulti-Objective Teaching Learning Based Optimization (MOTLBO) Technique to Voltage Stability Analysis of transmission systems. Simultaneous minimization of Real Power Loss and improvement of Voltage Stability margin in an overloaded transmission network ensures that the system is stable and efficient even under stressed conditions. Fast voltage Stability Index (FVSI) is used here to assess the health of the lines and the weak buses are identified for reactive power compensation. Flexible AC Transmission System (FACTS) devices are applied to the stressed lines to prevent occurrence of voltage collapse. The paper demonstrates the superiority of Multi-objective TLBO over other Optimization methods like Genetic Algorithm (GA), in determining the optimum ratings of FACTS devices for simultaneous minimization of Total Real power loss and FVSI in the weak lines. Bus voltage enhancement, improved line flows and loss reduction with application of series FACTS compensation have also been discussed. The tests have been carried out on an IEEE 30 bus system.
Key Words: Multi-Objective optimization, voltage stability, Reactive power compensation, FVSI, FACTS
1. INTRODUCTION
With the ever increasing demands on the power system networks all over the world, transmission systems tend to operate under extremely stressed conditions. With increased demand of the power system utilities all over the world, the lines become heavily stressed and this leads to a low voltage condition or voltage collapse. Many power system blackouts are caused by such a condition and hence voltage stability analysis is of utmost importance in ensuring the smooth function of large transmission networks. As the name indicates, voltage stability can be defined as the capability of a power system to retain voltages at all buses within acceptable limits under normal conditions and when subjected to a disturbance [1]. Voltage instability results in voltage collapse, which means the voltage falls to a low unacceptable value [2]. Voltage collapse is a common phenomenon in power systems which are usually heavily loaded, faulted and/or has reactive power shortages [3].
Improvement of the voltage profile and prevention of voltage collapse can be achieved with application of
sources of reactive power like shunt capacitors and/or Flexible AC Transmission System (FACTS) controllers at strategic and appropriated locations [4]. The power transfer capability is also enhanced and line losses minimized by introduction of FACTS devices. Shunt FACTS controllers are applied to the weakest bus whereas series FACTS devices are applied to the line which is most heavily stressed [5]. TCSC (Thyristor Controlled Series Capacitor) is a series connected FACTS device, used to increase power flow capacity in stressed lines and decrease system losses significantly.
In this paper, TCSC of optimum ratings are applied to the stressed lines to enhance the line flows and minimize the real power losses. FVSI (Fast voltage Stability Index) is used to identify the location of the TCSCs and for parameter settings Multi-objective TLBO algorithm is used. TLBO is a new evolutionary population-based method and uses a population of solutions to proceed to the global solution. It is based on the effect of the influence of a teacher on the output of the learners in a class [6]. It is easily implemented and requires less computational memory [6, 7].
Nomenclature
i Sending end bus or node
j Receiving end bus or node
Zij Impedance of line connecting bus i and bus j
Xij Impedance of line connecting bus i and bus j
Qj Reactive power flow at the receiving end bus j
Vi Voltage magnitude at bus i
Vj Voltage magnitude at bus i
XTCSC TCSC Reactance
© 2017, IRJET | Impact Factor value: 5.181 | ISO 9001:2008 Certified Journal
| Page 3564
2. FAST VOLTAGE STABILITY INDEX (FVSI)
FORMULATION
The power system network is observed to have higher number of lines than the number of buses, in order to ensure power delivery to the utilities and to improve system stability. Hence, it is essential that the weak lines of the network be identified and corrective measures taken to avoid outages and system collapse. There are several line voltage stability indices used for stressed line identification. Some of them are Lmn index, FVSI index, LQP index, VCPI (Power) Index, VCPI (Losses) index etc. [8, 9, 10, 11]. The Line Stability Index FVSI (Fast Voltage Stability Index) was proposed by I. Musirin et al [9]. It is based on the concept of power flow through a single line. It results from the voltage quadratic equation at the receiving bus of a two-bus system [9, 11, 12, 13, 14].
In an interconnected transmission line, the stability index is calculated by (1):
(1)
The line having FVSI value close to 1 is approaching its instability point. Any further increase in load may lead to either of the buses connecting the line to experience voltage collapse. FVSI > 1 implies that the line is experiencing voltage instability. FVSI helps to identify the weakest buses and the most heavily loaded lines. Therefore, the knowledge of the FVSI also helps in proper placement of reactive power compensation in the power system network.
3. TCSC MODELLING
Among all important FACTS controllers, SVC (Static VAR Compensator) and TCSC are most suitable for voltage control [15]. TCSC is one of the most popular series FACTS controllers, which allows rapid and continuous modulation of the transmission line impedance. It consists of a capacitor (C) inserted directly into the transmission line and the TCR are mounted in parallel with the capacitor [16]. The structure of TCSC is shown in Fig.1.
Fig-1: Structure of TCSC
The TCSC is connected in series with the line to compensate the inductive reactance of the transmission line. The reactance of the TCSC depends on its compensation ratio and the reactance of the transmission line where it is located [17]. The model of TCSC is shown in Fig. 2
Fig.2: TCSC Model
The TCSC modeled by the reactance, XTCSC is given as
follows: [6, 17, 18]:
Xij= Xline + XTCSC (2)
XTCSC=
γ
TCSC .Xline (3)
The level of applied compensation of the TCSC varies between 20% inductive reactance and 80% capacitive reactance.
4. TLBO METHOD
The Teaching Learning Based Optimization (TLBO)
algorithm is a global optimization method originally
developed by R.V Rao et al., inspired by the nature of
influence of a teacher on learners. Compared to other
algorithms, TLBO is a simple and robust technique
involving fewer computations [6]. It is also a
population based method and uses a population of
solutions to achieve a global solution. The population
is considered to be a group of learners or a class of
students. The different variables are analogous to the
different subjects offered to learners and the student
score is analogous to the fitness [19]. As the teacher
is considered the most learned person in the society,
the best solution is analogous to Teacher in TLBO.
The process of TLBO is divided into two parts. The
first part is the ‘Teacher Phase’ and the second part is
the ‘Learner Phase’.
2
2
4 ij j
ij
i ij Z Q FVSI
© 2017, IRJET | Impact Factor value: 5.181 | ISO 9001:2008 Certified Journal
| Page 3565
4.1 Initialization:
For any iteration i, we assume that there are ‘m’ number of subjects (i.e. design variables), ‘n’ number of learners (i.e., population size, k=1, 2, …, n) and Mj
,
i be the mean result of the learners in a particular subject (j=1, 2, …, m).4.2 Teacher Phase:
It is the first part of the algorithm where learners learn through the teacher and improve their knowledge, which in turn, improves the mean result of the class.
The difference between the existing mean result of each subject and the corresponding result of the teacher for each subject is given by:
(4)
(5)
Where,
Xj,kbest, i : result of the best learner in subject j
Tf : Teaching factor, value of Tf can be either 1 or 2
ri : random number in the range [0, 1]
X’j,k,i : updated value of Xj,k,i , accepted if it gives better function value.
All accepted function values at the end of the Teacher phase become the input to the learner phase.
4.3 Learner Phase:
In this phase the interaction of learners with one another takes place. The random interactions among learners improve their knowledge. Two learners P and Q are randomly selected such that X’total-P,i ≠ X’total-Q,i (where X’total-P,i and X’total-Q,i are the updated function values of Xtotal-P,i and Xtotal-Q,i of P and Q at the end of the Teacher phase).
For minimization problems,
(6) if X’total-P,i < X’total-Q,i
(7)
if X’total-Q,i < X’total-P,i
Where
ri : randomly generated number in the range [0, 1]
TLBO requires only the common control parameters such as population size and the number of generations and does not require any algorithm-specific control parameters.
5. PROBLEM FORMULATION:
5.1 Problem: The main objective of this work is to
optimize the TCSC design parameter (γTCSC) forsimultaneous minimization of the system Real power loss and FVSI of the compensated lines, thereby improving the line voltage stability of the system and enhancing line flows. Multi-objective TLBO for Real power loss reduction and FVSI minimization is performed on a standard IEEE 30 bus test system.
5.2 Multi-objective TLBO problem formulation:
The objective function is:∑ ∑ (8)
Where,
F : objective function PLk : Real power loss of line k nL : no. of lines
SL : stressed lines where TCSCs are connected FVSIl : FVSI value of line l
w, (1-w) : weight adjustments for PLk and FVSIl
Constraints:
The minimization problem is subject to the following equality and inequality constraints:
Equality constraints:
The equality constraints represent the load flow equations, as given below for the ith bus:
1
( ) 0
nB
Gi Di i j ij ij i j
j
P P V V Y Cos
(9)
1
Sin( ) 0
nB
Gi Di i j ij ij i j
j
Q Q V V Y
(10)Where,
PGi, QGi : active and reactive powers of the ith generator
PDi, QDi : active and reactive powers of the ith load bus
© 2017, IRJET | Impact Factor value: 5.181 | ISO 9001:2008 Certified Journal
| Page 3566
Inequality constraints:PGimin ≤ PGi ≤ PGimax , i ϵ nG
QGimin ≤ QGi ≤ QGimax , i ϵ nG
Vimin ≤ Vi ≤ Vimax , i ϵ nB
, i ϵ nB
γTCSC min ≤ γTCSC ≤ γTCSC max
6. RESULTS AND DISCUSSION
6.1 Placement of FACTS devices:
NR load flow and Continuation Power Flow Analysis [20] have been carried out on the standard IEEE 30 bus, 41 line test system.
The FVSI of each line is calculated after increasing the loading to 150% and the highest values of FVSI are associated with lines 12, 15 and 36, indicating that these are the most stressed lines approaching or experiencing voltage collapse. The voltage magnitudes of the corresponding buses are noted. FVSI, Power flows and Lines losses of these lines are calculated. These lines are selected for series FACTS compensation (TCSC).
6.2 Implementation of MOTLBO for determining
the capacity of TCSCs:
TCSCs with random capacity are installed in the selected weak lines. Multi-objective TLBO (MOTLBO) is then carried out with Minimization of Total Real Power Loss and FVSI of the stressed lines as the objective function. The tests are carried out for different weights and it is found that the optimum value for γTCSC is -0.76892845
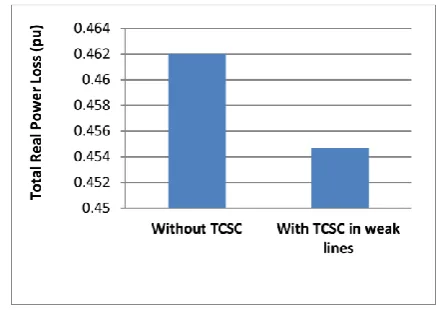
under overload (150% load) conditions. Using the optimized ratings, NR load flow is performed. System losses and FVSI of the compensated lines are then calculated. Results of the multi-objective TLBO are shown in Table-1 and Figs 3 and 4. Total losses of the system and Sum of FVSI of the stressed lines reduce [Table-1], even under overload conditions, indicating enhanced line voltage stability.
[image:4.595.318.551.133.208.2]Voltage magnitudes at the two end nodes of the stressed lines are computed and tabled [Table-2]. An improvement in Voltage magnitudes is observed [Table-2 & Fig-5] with the application of the optimum rated TCSCs.
Table-1: Results of Multi-objective TLBO (IEEE 30 bus system)
Result (Multi- objective TLBO)
(p.u.)
Without TCSC
With TCSC in weak lines (γTCSC = -0.76893)
Total Real power
loss 0.46203 0.45468
[image:4.595.324.545.260.415.2]Sum FVSI 1.7251 0.7018
Fig-3 and Fig-4 are representation of the objectives of this paper, achieved through Multi-objective TLBO.
[image:4.595.336.542.498.649.2]Fig -3:Total Real Power Loss profile (IEEE 30 bus system)
© 2017, IRJET | Impact Factor value: 5.181 | ISO 9001:2008 Certified Journal
| Page 3567
Table-2:Voltage magnitudes of the connected buses
(IEEE 30 bus system)
Line
No. Bus No.
Voltage (p.u)
Without TCSC With TCSC in weak lines (γ
TCSC = -0.76892845)
12
6 0.967 0.9834
10 0.9753 1.0087
15
4 0.9692 0.9802
12 1.0003 1.0439
36
28 0.9636 0.9807
27 0.9548 1.0039
It is observed that the reactive power losses of the compensated lines and the total reactive power loss of the system are also minimized in the process (Table-3 and Fig-6).
Table-3:
Reactive Power Losses (IEEE 30 bus system)
The convergence characteristics of Multi-objective TLBO method applied to the IEEE 30 bus system are shown in Fig- 7. When the same optimization problem is executed using GA, the number of iterations required are 28, compared to Multi-objective TLBO (which requires 18 iterations), indicating the superiority of TLBO technique over GA.
7. CONCLUSION
Voltage Stability improvement of transmission lines under stress include enhancement of voltage stability margin together with minimization of transmission loss. The optimal location and rating of TCSCs play a vital role in achieving these objectives. This paper aims to establish the importance and superiority of Multi-objective TLBO technique in proper optimization of TCSC ratings for Real Power Loss and FVSI minimization, and improved voltage profile of the stressed lines of a standard IEEE 30 bus system. In any evolutionary algorithm, the convergence rate is given utmost importance without compromising on the quality of objectives. Multi-objective TLBO performed
Line No.
Reactive Power Loss (MVAR)
Without TCSC With TCSC in weak lines
12 3.247 2.141
15 11.596 10.961
36 3.189 1.311
System 176.893 165.270
Fig-5:
Voltage profile of the connected buses (IEEE 30 bus system)
Fig -6: Total Reactive Power Loss profile
(IEEE 30 bus system)
Fig-7: Convergence characteristic of Multi-
© 2017, IRJET | Impact Factor value: 5.181 | ISO 9001:2008 Certified Journal
| Page 3568
in this paper is able to achieve its objectives at minimumconvergence time when compared to Genetic Algorithm (GA). This work also highlights the simplicity of Multi-objective TLBO method and its effectiveness while applying it to Voltage Stability studies.
REFERENCES:
[1] P. Kundur. Power System Stability and Control. EPRI Power System Engineering Series. McGraw-Hill; 1994; p. 959.
[2] C.W. Taylor. Power System Voltage Stability. McGraw- Hill; 1993; p. 238
[3] U.P. Anand, P. Dharmeshkumar. Voltage Stability Assessment Using Continuation Power Flow. International Journal of Advanced Research in Electrical, Electronics and Instrumentation Engineering. Aug.2013; 2(8).
[4] M. A. Kamarposhti, M. Alinezhad, H. Lesani, Nemat Talebi. Comparison of SVC, STATCOM, TCSC and UPFC Controllers for Static Voltage Stability Evaluated by Continuation Power Flow Method. IEEE Electrical Power & Energy Conference; 2008; Canada.
[5] A.Sode-Yome, N. Mithulananthan, K.Y. Lee. Static Voltage Stability Margin Enhancement Using STATCOM, TCSC and SSSC. IEEE/PES, Transmission and Distribution Conference & Exhibition; 2005; Asia and Pacific; Dalian; China.
[6] N. Rajasree, M.D. Reddy. Simultaneous placement of TCSC and UPFC in Transmission System using Teaching-Learning Based Optimization Technique. Discovery . 2015; 47(216): 1-7.
[7] S.C. Satapathy, A. Naik, K.Parvathi. A teaching
learning based optimization based on orthogonal
design for solving global optimization problem. SpringerPlus. 2013; 2:130.http://www.springerplus.com/content/2/1/130.
[8] L.Jebaraj, C..C.A.Rajan, S.Sakthivel. Real Power Loss and Voltage Stability Limit Optimization Incorporating TCSC and SVC through DE Algorithm under Different Operating Conditions of a Power System. IOSR Journal of Electrical and Electronics Engineering. 2012 July-Aug; 1(5): 16-25. ISSN: 2278-1676.
[9] H.H. Goh, Q.S. Chua, S.W. lee, B.C. Kok, K.C.Goh, K.T.K.Teo. Comparative Study of Line Voltage Stability Indices for Voltage Collapse Forecasting in Power Transmission System. International Journal of Electrical, Computer, Energetic, Electronic and Communication Engineering. 2015; 9(2).
[10] F.A.Althowibi, M.W.Mustafa. Power System Voltage Stability: Indications, Allocations and Voltage Collapse Predictions. International Journal of Advanced Research in Electrical, Electronics and Instrumentation Engineering. 2013 July; 2(7).
[11] C. Reis, F.P.Maciel Barbosa. A Comparison of Voltage Stability Indices. IEEE MELECON. 2006 May 16-19, Spain.
[12] K.R.Vadivelu, G.V.Marutheswar. Fast Voltage Stability Index Based Optimal Reactive Power Planning Using Differential Evolution. Electrical and Electronics Engineering: An International Journal (ELELIJ). 2014 Feb; 3(1).
[13] P.R.Sharma, R.K.Ahuja, S.Vashisth, V.Hudda. Computation of Sensitive Node for IEEE-14 Bus System Subjected to Load Variation. International Journal of Innovative Research in Electrical,
Electronics, Instrumentation and Control
Engineering. 2014 June; 2(6). ISSN (online) 2321-2004, (print) 2321-5526.
[14] K.R.Vadivelu, G.V.Mathureswar. Fast Voltage Stability Index Based Optimal Reactive Power Planning using Differential Evolution. Electrical and Electronics Engineering: An International journal. 2014 Feb; 3(1).
[15] N. Palukuru, S.Halder nee Dey, T.Datta, S. Paul. Voltage Stability Assessment of a Power System Incorporating FACTS Controllers using Unique Network Equivalent. Ain Shams Engineering Journal. 2014; 5: 103-111.
[16] S. Akter, A.Saha, P.Das. Modelling, Simulation and Comparison of Various FACTS Devices in Power Systems. International Journal of Engineering Research & Technology (IJERT). 2012 Oct; 1(8). ISSN: 2278-0181.
[17] R.Selvarasu, M.S. Kalavathi. TCSC Placement for Loss Minimization Using Self Adaptive Firefly Algorithm. Journal of Engineering Science and Technology. 2015; 10(3): 291-306.
[18] N.M.G. Kumar, P. Venkatesh, P.S. Raju. Modelling and Analysis of SVC, TCSC, TCPAR in Power Flow Studies. International Journal of Emerging Technology and Advanced Engineering (IJETAE). 2013 Jan; 3(1). ISSN 2250-2459.
[19] K. Lenin, B.R. Reddy, M.S. Kalavathi. Improved Teaching Learning Based Optimization (ITLBO) Algorithm For Solving Optimal Reactive Power Dispatch Problem. International Journal of Computer & Information Technologies (IJOCIT). 2013 Aug; 1(1). ISSN: 2345-3877.