© 2018, IRJET | Impact Factor value: 6.171 | ISO 9001:2008 Certified Journal | Page 861
ANALYSIS OF UNDAMPED IRREGULAR RCC BUILDING USING SAP2000
B.satish
1, Sunil kumar
21M.Tech scholar, Department of Civil Engineering, Chintalapudi Engineering College,
2Head of Department of Civil Engg, Chintalapudi Engineering College, Ponnur, Andhra Pradesh (India) ---***---Abstract: Structures these days are constructed with
irregularities along the height for architectural views. The structure is said to be irregular when the distribution of its mass, stiffness and strength varies along its configuration. Seismic load is considered to be an important load that the structure must be analyzed. From the past earthquake records it can be observed that the structures with irregularity show poor seismic performance. This project work is concerned about analyzing and studying the behavior of irregular building and different models of vertically irregular building when subjected to seismic loads. For the study one model of vertical irregular structure of G+ 40 storeys is considered. The analysis is carried out by using Sap2000 software by time history method. The results of various parameters like time period, storey displacement, and storey stiffness are obtained and the graphs are plotted. From the results it can be observed that regular structure possess better seismic performance as compared to vertically irregular structure.
INTRODUCTION
1. GENERAL
The primary purpose of all kinds of structural systems used in the building type of structures is to support gravity loads. The most common loads resulting from the effect of gravity are dead load, live load and snow load. Besides these vertical loads, buildings are also subjected to lateral loads caused by wind, blasting or earthquake. Lateral loads can develop high stresses, produce sway movement or cause vibration Therefore, it is very important for the structure to have sufficient strength against vertical loads together with adequate stiffness to resist lateral forces.
1.2 SEISMIC ZONE MAP OF INDIA & RECENT EARTHQUAKES
Earthquakes have been happening in the Indian sub landmass from the time immemorial however dependable chronicled records are accessible throughout the previous 200 years (Oldham, 1883). From the earliest starting point of the twentieth century, more than 700 earthquakes of size at least 5 have been recorded and felt in India. The seismicity of India is separated into four gatherings, to be specific Himalayan locale, Andaman Nicobar, Kutch Region, and Peninsular India.
The objective of seismic zoning is to outline districts of plausible power of ground movement in a nation, for giving a
rule to arrangement of a satisfactory tremor protection in developed offices. the main thorough seismic zoning map was produced by the Bureau of Indian Standards in 1962. Later in the ensuing years it was evaluated commonly and along these lines a four zone seismic zoning map was embraced in Is 1893:2002. The guide depends on expected force of ground shaking yet does not think about the recurrence of the event.
Current seismic zoning map according to IS 1893-2002 says that around 60% (Zone V= 12%, Zone IV=18%, Zone III = 26% and Zone II 44%) of India is inclined to direct to significant earthquakes. As needs be, zone factors (z) are characterized for each zone to touch base at the plan seismic power following up on the structure. Zone II relates to force VI or lower and zone V compares to power IX or higher. Zone II has most reduced threat or hazard while Zone - V has most astounding perils. Since harm controlled point of confinement state has been acknowledged, the zone factor, z has been decreased to half (z/2) of Maximum Considered Earthquake (MCE) for Design Basis Earthquake (DBE).
[image:1.595.308.559.485.663.2]Structures are expressly intended for DBE and most extreme considered seismic tremor is dealt with through finished quality and pliability arrangements.
Fig: 1 Seismic zoning maps of India I.S. 1893:1966 and IS1893:2002
1.3 OBJECTIVE OF STUDY
Time History Analysis of Buildings.
© 2018, IRJET | Impact Factor value: 6.171 | ISO 9001:2008 Certified Journal | Page 862
Lateral Displacements at joints.
Acceleration.
Base shear-x direction
Beam Line element
Torsion
Velocity
1.4 CASE STUDY
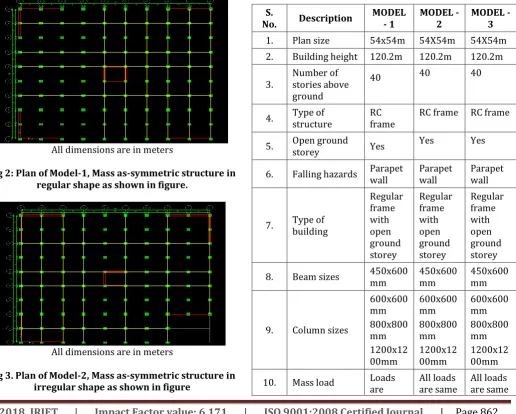
In the present work, a 40-storied reinforced concrete frame building situated in Hyderabad city which falls in Zone IV, is taken for the purpose of study. The plan area of building is 54x54m and 3.0m as height of typical storey. It consists of 9 bays in X-direction and 9 bays in Y-direction. The total height of the building is 120.2m along parapet wall. The building is considered as a Special Moment Resisting Frame. The plan of building is shown in fig. 4.1 and the front elevation along x-z axis is shown in Fig n the elevation along y-z axis is shown in Fig. 4.2. Also the isometric view of the building is shown in the Fig.41. As the structure is regular and relatively simple, the identification of the differences in results can be known in easy and can be discuss in depth.
[image:2.595.319.550.80.258.2]All dimensions are in meters
Fig 2: Plan of Model-1, Mass as-symmetric structure in regular shape as shown in figure.
[image:2.595.44.280.368.529.2]All dimensions are in meters
Fig 3. Plan of Model-2, Mass as-symmetric structure in irregular shape as shown in figure
All dimensions are in meters
Fig 4.Plan of Model-3, Mass as-symmetric structure in irregular shape as shown in figure
2. GENERAL DATA COLLECTION OF MASS AS-SYMMETRIC STRUCTURE
Table 1: General data collection and condition assessment of the building.
S.
No. Description MODEL - 1 MODEL - 2 MODEL - 3
1. Plan size 54x54m 54X54m 54X54m
2. Building height 120.2m 120.2m 120.2m
3. Number of stories above ground
40 40 40
4. Type of structure RC frame RC frame RC frame
5. Open ground storey Yes Yes Yes
6. Falling hazards Parapet wall Parapet wall Parapet wall
7. Type of building
Regular frame with open ground storey
Regular frame with open ground storey
Regular frame with open ground storey
8. Beam sizes 450x600mm 450x600mm 450x600mm
9. Column sizes
600x600 mm 800x800 mm 1200x12 00mm
600x600 mm 800x800 mm 1200x12 00mm
600x600 mm 800x800 mm 1200x12 00mm
10. Mass load Loads
[image:2.595.49.566.374.788.2] [image:2.595.296.566.377.782.2]© 2018, IRJET | Impact Factor value: 6.171 | ISO 9001:2008 Certified Journal | Page 863
different from span to span.
from floor to floor
from floor to floor
10. Grade of concrete used M40 M40 M40
11. Software used SAP2000 vs. 16 SAP2000 vs. 16 SAP2000 vs. 16
3. RESULTS AND DISCUSSION
The results of the analytical investigations are presented in the Tables. The results are also shown graphically in the Figures.
3.1. Displacement at point 1:
[image:3.595.42.280.364.694.2]After modeling and analyzing the structure, the displacements at the joints in the structure were checked out. In this chapter, joints of the extreme columns of comparison of three buildings are checked for displacement and they are compared.
Fig 5: time vs. displacement at joint: 1 in the buildings
Table 2: Time vs. Displacement at joint 1 in the buildings.
The table below shows the Displacement values with respect to time for 25s at joint 1 in the buildings.
Mass as-symmetric Mass as-symmetric Mass as-symmetric
Model-1 Model-2 Model-3
Time (s) Displacement(m) Time (s) Displacement(m) Time (s) Displacement(m)
16.5 -0.28713 16.5 -0.21947 16.5 -0.13536
17 0.16605 17 0.16616 17 0.01661
17.5 0.33371 17.5 0.26757 17.5 0.15462
18 0.03507 18 -6.25E-04 18 0.05936
18.5 -0.2915 18.5 -0.2449 18.5 -0.14259
19 -0.18109 19 -0.12151 19 -0.11491
19.5 0.16127 19.5 0.14665 19.5 0.07732
20 0.23794 20 0.17255 20 0.13173
20.5 -3.18E-04 20.5 -0.02002 20.5 0.01342
21 -0.2177 21 -0.1653 21 -0.122
21.5 -0.11862 21.5 -0.0724 21.5 -0.0829
22 0.13674 22 0.11128 22 0.08249
22.5 0.16454 22.5 0.10681 22.5 0.11146
23 -0.02284 23 -0.02959 23 -0.02139
23.5 -0.16965 23.5 -0.11766 23.5 -0.12391
24 -0.06714 24 -0.03313 24 -0.02816
24.5 0.10902 24.5 0.07718 24.5 0.09148
25 0.13281 25 0.08393 25 0.07962
Mass as-symmetric Mass as-symmetric Mass as-symmetric
Model-1 Model-2 Model-3
Time (s) Displacement(m) Time (s) Displacement(m) Time (s) Displacement(m)
0 0 0 0 0 0
0.5 0.05649 0.5 0.05694 0.5 0.06234
1 0.23801 1 0.23835 1 0.20453
1.5 -0.44854 1.5 -0.4551 1.5 -0.52741
2 -0.80456 2 -0.81025 2 -0.61664
2.5 1.71084 2.5 1.71939 2.5 1.70457
3 1.57213 3 1.58278 3 1.14549
3.5 -0.89258 3.5 -0.92028 3.5 -1.12474
4 -1.51255 4 -1.51988 4 -1.13344
4.5 -0.31635 4.5 -0.26322 4.5 0.25161
5 1.26578 5 1.27211 5 1.00768
5.5 1.16505 5.5 1.11844 5.5 0.47629
6 -0.70882 6 -0.73018 6 -0.75162
6.5 -1.25662 6.5 -1.23454 6.5 -0.72998
7 -0.08748 7 -0.03804 7 0.33892
7.5 1.031 7.5 1.03099 7.5 0.76463
8 0.67772 8 0.61099 8 -0.03023
8.5 -0.52866 8.5 -0.54757 8.5 -0.53318
9 -0.91925 9 -0.86099 9 -0.17684
9.5 0.00324 9.5 0.04368 9.5 0.24891
10 0.79759 10 0.76903 10 0.2463
10.5 0.38925 10.5 0.32765 10.5 -0.03884
11 -0.4978 11 -0.5041 11 -0.21899
11.5 -0.62484 11.5 -0.55657 11.5 -0.12247
12 0.11958 12 0.15701 12 0.11908
12.5 0.60867 12.5 0.55586 12.5 0.17088
13 0.22944 13 0.16849 13 0.0098
13.5 -0.40913 13.5 -0.38862 13.5 -0.12122
14 -0.42545 14 -0.35477 14 -0.08991
14.5 0.16001 14.5 0.17756 14.5 0.05192
15 0.45959 15 0.39761 15 0.11459
15.5 0.09468 15.5 0.04453 15.5 0.04217
© 2018, IRJET | Impact Factor value: 6.171 | ISO 9001:2008 Certified Journal | Page 864
GRAPH:
In the below figure shows the variation of displacement with time for all the three types of Mass as-symmetric buildings are:
1. Model-1 in regular shape
2. Model-2 in irregular shape
3. Model-3 in irregular shape
[image:4.595.326.547.80.230.2]In this variation of stiffness as-symmetric is very high when compared to symmetric structure & mass as-symmetric but the values of symmetric structure is quite greater than the mass as-symmetric structure.(i.e., stiffness as-symmetric > symmetric structure > stiffness as-symmetric).
Table: 3. it shows the maximum displacement with respect to time for three types of the buildings:
STRUCTURES
MAXIMUM DISPLACEMENT At point
IN (M) TIME(S)
Model-1 1.7 2.5
Model-2 2.36 11
Model-3 0.54 2.5
The maximum displacement with respect to time when compared with 3 types of buildings is 2.36m at 11s in Model-2.
Fig 6: Graph showing Time vs. displacement at joint no.1 in the buildings.
The above graph shows the variation of displacement values at the interval of 0.5 second in the three different types of structures i.e., symmetric structure to asymmetric structure. It is observed that there is minor change in the displacement values.
3.2 ACCELERATION AT JOINT: 1:
[image:4.595.39.287.303.395.2]And the values of these accelerations were compared with the values of corresponding columns of the buildings. The values of acceleration in UX direction are shown.
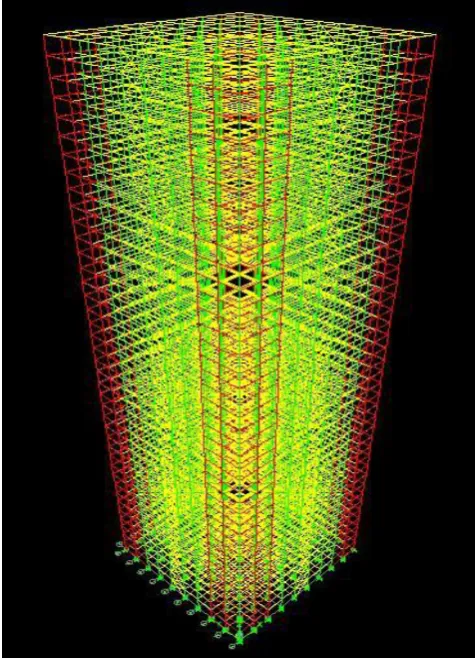
[image:4.595.303.551.329.782.2]Fig.7: 3D Model of 40 storey building.
Table 4: Time vs. Acceleration in columns at joint-1 in buildings.
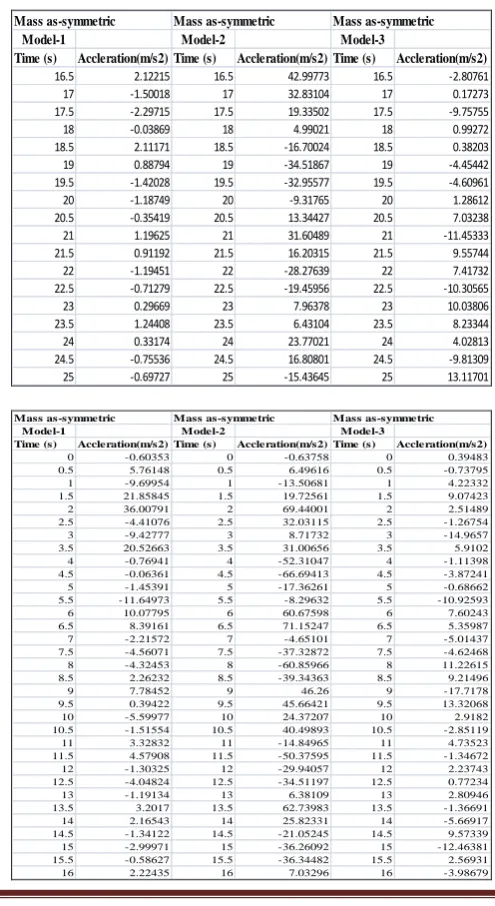
The table below shows the Acceleration values with respect to time for 25s at joint 1 in the buildings
Mass as-symmetric Mass as-symmetric Mass as-symmetric
Model-1 Model-2 Model-3
Time (s) Accleration(m/s2) Time (s) Accleration(m/s2) Time (s) Accleration(m/s2) 16.5 2.12215 16.5 42.99773 16.5 -2.80761 17 -1.50018 17 32.83104 17 0.17273 17.5 -2.29715 17.5 19.33502 17.5 -9.75755 18 -0.03869 18 4.99021 18 0.99272 18.5 2.11171 18.5 -16.70024 18.5 0.38203 19 0.88794 19 -34.51867 19 -4.45442 19.5 -1.42028 19.5 -32.95577 19.5 -4.60961 20 -1.18749 20 -9.31765 20 1.28612 20.5 -0.35419 20.5 13.34427 20.5 7.03238 21 1.19625 21 31.60489 21 -11.45333 21.5 0.91192 21.5 16.20315 21.5 9.55744 22 -1.19451 22 -28.27639 22 7.41732 22.5 -0.71279 22.5 -19.45956 22.5 -10.30565 23 0.29669 23 7.96378 23 10.03806 23.5 1.24408 23.5 6.43104 23.5 8.23344 24 0.33174 24 23.77021 24 4.02813 24.5 -0.75536 24.5 16.80801 24.5 -9.81309 25 -0.69727 25 -15.43645 25 13.11701
Mass as-symmetric Mass as-symmetric Mass as-symmetric
Model-1 Model-2 Model-3
Time (s) Accleration(m/s2) Time (s) Accleration(m/s2) Time (s) Accleration(m/s2)
0 -0.60353 0 -0.63758 0 0.39483
0.5 5.76148 0.5 6.49616 0.5 -0.73795
1 -9.69954 1 -13.50681 1 4.22332
1.5 21.85845 1.5 19.72561 1.5 9.07423
2 36.00791 2 69.44001 2 2.51489
2.5 -4.41076 2.5 32.03115 2.5 -1.26754
3 -9.42777 3 8.71732 3 -14.9657
3.5 20.52663 3.5 31.00656 3.5 5.9102
4 -0.76941 4 -52.31047 4 -1.11398
4.5 -0.06361 4.5 -66.69413 4.5 -3.87241
5 -1.45391 5 -17.36261 5 -0.68662
5.5 -11.64973 5.5 -8.29632 5.5 -10.92593
6 10.07795 6 60.67598 6 7.60243
6.5 8.39161 6.5 71.15247 6.5 5.35987
7 -2.21572 7 -4.65101 7 -5.01437
7.5 -4.56071 7.5 -37.32872 7.5 -4.62468
8 -4.32453 8 -60.85966 8 11.22615
8.5 2.26232 8.5 -39.34363 8.5 9.21496
9 7.78452 9 46.26 9 -17.7178
9.5 0.39422 9.5 45.66421 9.5 13.32068
10 -5.59977 10 24.37207 10 2.9182
10.5 -1.51554 10.5 40.49893 10.5 -2.85119
11 3.32832 11 -14.84965 11 4.73523
11.5 4.57908 11.5 -50.37595 11.5 -1.34672
12 -1.30325 12 -29.94057 12 2.23743
12.5 -4.04824 12.5 -34.51197 12.5 0.77234
13 -1.19134 13 6.38109 13 2.80946
13.5 3.2017 13.5 62.73983 13.5 -1.36691
14 2.16543 14 25.82331 14 -5.66917
14.5 -1.34122 14.5 -21.05245 14.5 9.57339
15 -2.99971 15 -36.26092 15 -12.46381
15.5 -0.58627 15.5 -36.34482 15.5 2.56931
[image:4.595.38.287.449.597.2]© 2018, IRJET | Impact Factor value: 6.171 | ISO 9001:2008 Certified Journal | Page 865
The above table shows the variation of acceleration values at the interval of 0.5 second in the three different types of structures i.e., symmetric structure to asymmetric structure. It is observed that there is major change in the acceleration values.
GRAPH:
The below figure shows the variation of acceleration with time for all the three types of buildings are:
1. Model-1 in regular shape
2. Model-2 in irregular shape
3. Model-3 in irregular shape
[image:5.595.317.551.174.390.2]In this, variation of stiffness as-symmetric is very high when compared to stiffness as-symmetric structure but the value of stiffness asymmetric structure is high than mass symmetric (i.e., stiffness symmetric > stiffness as-symmetric > mass as-as-symmetric structure.)
Table: 5: It shows the maximum Acceleration with respect to time for three types of the buildings:
STRUCTURE MAX. ACCELERATION AT POINT 1 IN m/s2 TIME(S)
Model-1 36 2
Model-2 71 6.5
Model-3 13.3 9.5
The maximum Acceleration with respect to time when compared with 3 types of buildings is 71m/s2 at 6.5s in Model-2.
Fig 8: Graph showing Time vs. acceleration at joint1 in buildings.
The above graph shows the variation of acceleration values at the interval of 0.5 second in the three different types of structures i.e., symmetric structure to asymmetric structure. It is observed that there is major change in the acceleration values.
3.3 VELOCITY AT JOINT 1:
After modelling and analyzing the structure, the velocity at the joints: 4 in the structure were checked out. In this chapter, joints of the extreme columns of comparison of three buildings are checked for velocity and they are compared.
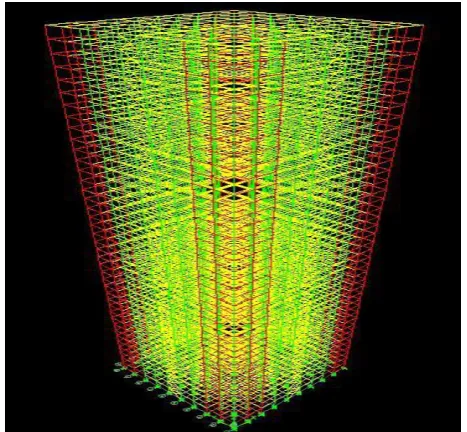
[image:5.595.36.287.362.426.2]Figure 9 : 3D Model of 40 storey building.
Table 6: Time vs. velocity at joint: 1 in the buildings. The table below shows the Velocity values with respect to time for 25s at joint 1 in the buildings.
Mass as-symmetric Mass as-symmetric Mass as-symmetric
Model-1 Model-2 Model-3
Time (s) Velocity(mph) Time (s) Velocity(mph) Time (s) Velocity(mph)
0 0 0 0 0 0
0.5 0.3448 0.5 0.38885 0.5 0.07342 1 -0.02998 1 -0.03179 1 0.26185 1.5 -4.0677 1.5 -5.15529 1.5 -0.83815 2 2.27725 2 1.47173 2 2.62043 2.5 1.66861 2.5 2.56981 2.5 -1.05194 3 -1.47035 3 0.84622 3 -0.94029 3.5 -4.64327 3.5 -4.53123 3.5 0.20375 4 -0.11068 4 0.69349 4 0.8466 4.5 5.22128 4.5 8.8808 4.5 1.63189 5 1.0675 5 -1.23104 5 -0.37763 5.5 -2.73807 5.5 -6.7954 5.5 -1.27787 6 -2.80071 6 -3.11601 6 0.55576 6.5 0.56696 6.5 -0.39405 6.5 1.56519 7 3.03475 7 7.20254 7 -0.4866 7.5 1.19574 7.5 6.07221 7.5 0.05798 8 -2.46736 8 -7.49426 8 -0.58705 8.5 -1.87468 8.5 -5.87586 8.5 0.18166 9 0.83061 9 2.18158 9 0.53437 9.5 2.06334 9.5 2.48016 9.5 0.15444 10 0.74934 10 2.76 10 -0.78791 10.5 -1.91397 10.5 -2.31259 10.5 -0.10255 11 -1.28931 11 -3.78746 11 0.03972 11.5 0.8805 11.5 4.66071 11.5 -0.4007 12 1.63657 12 4.71028 12 0.50141 12.5 0.14969 12.5 -2.9667 12.5 -0.26063 13 -1.39045 13 -5.25749 13 -1.42491 13.5 -0.80047 13.5 -3.13601 13.5 0.68439 14 0.74479 14 3.82505 14 0.3986 14.5 1.1718 14.5 7.54541 14.5 -1.18281 15 -0.08561 15 -0.49188 15 0.23696 15.5 -1.14401 15.5 -6.32723 15.5 0.43176
[image:5.595.37.283.481.643.2]© 2018, IRJET | Impact Factor value: 6.171 | ISO 9001:2008 Certified Journal | Page 866
Mass as-symmetric Mass as-symmetric Mass as-symmetric
Model-1 Model-2 Model-3
Time (s) Velocity(mph) Time (s) Velocity(mph) Time (s) Velocity(mph)
16.5 0.69356 16.5 2.22183 16.5 -0.38461
17 0.84565 17 3.66104 17 1.55026
17.5 -0.21815 17.5 -0.51143 17.5 -0.25749 18 -0.82614 18 -3.95806 18 -0.91364 18.5 -0.29302 18.5 -0.30196 18.5 0.36868
19 0.61519 19 4.18444 19 0.82401
19.5 0.58022 19.5 2.75825 19.5 0.65931 20 -0.25558 20 -3.02037 20 -0.01347 20.5 -0.62418 20.5 -4.8671 20.5 -0.88366
21 -0.11723 21 0.61804 21 0.45492
21.5 0.48381 21.5 4.60802 21.5 1.38341
22 0.33467 22 2.87084 22 0.58476
22.5 -0.19411 22.5 -1.90877 22.5 -1.45387 23 -0.47218 23 -5.45255 23 -0.09272 23.5 -0.01886 23.5 -0.3733 23.5 0.62124
24 0.37792 24 4.44072 24 0.82484
24.5 0.23102 24.5 0.37981 24.5 -0.20092 25 -0.12891 25 -1.58221 25 -1.54981
The above table shows the variation of velocity values at the interval of 0.5 second in the three different types of structures i.e., symmetric structure to asymmetric structure. It is observed that there is minor change in the velocity values.
GRAPH:
The below figure shows the variation of velocity with time for all the three types of buildings are:
1. Model-1 in regular shape
2. Model-2 in irregular shape
3. Model-3 in irregular shape
[image:6.595.36.280.591.654.2]In this, variation of stiffness as-symmetric is very high when compared to symmetric structure & mass as-symmetric but the values of symmetric structure are quite greater than the mass as-symmetric structure.
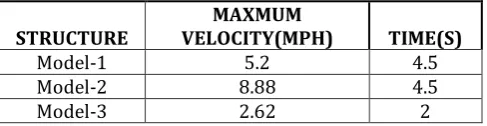
Table 7. It shows the Maximum Velocity with respect to time for three types of the buildings.
STRUCTURE VELOCITY(MPH) MAXMUM TIME(S)
Model-1 5.2 4.5
Model-2 8.88 4.5
Model-3 2.62 2
4. CONCLUSIONS
The present practice in seismic design is to adopt Response spectrum method of structural analysis. The code leaves the application of method of dynamic analysis making use of Time History Analysis concept to the discretion of the designer. In this context in the present project, a 1- storey building has been analyzed Time History Analysis making use of Sap2000.
In brief, In the symmetric structure the centre of mass and centre of radius is coincides .In the mass as-symmetric structure, the centre of mass is at an eccentricity and In stiffness as-symmetric structure the centre of rigidity is at an eccentricity.
A comparison of the three sets of results demonstrates both the capabilities and limitations of the proposed procedure.
1. Single storey stiffness asymmetric buildings oscillate predominantly in the first mode than the mass asymmetric building and the symmetric building.
2. The comparison of results for the maximum
displacement, velocity, acceleration, torsion obtains from the time history analysis of single storey asymmetric building; show that the proposed procedure can estimate the response of multi-storey building model satisfactory.
3. It has been observed that the lateral displacements, more in stiffness asymmetric structure. It has been noticed that the displacement values for building with symmetric structure is less by 30% and mass asymmetric structure is less by 77% when compared to building with stiffness asymmetric structure.
4. The maximum velocity, is more in stiffness
asymmetric structure .It has been noticed that the maximum velocity values in symmetric structure is less by 23% and in mass asymmetric structure is less by 75% when compared to building with stiffness asymmetric structure.
5. The base shear is more in symmetric structure when
compared to other two structures. It has been noticed that the base shear in stiffness asymmetric structure is less by 28% and in mass asymmetric structure is less by 47% when compared to building with symmetric structure.
6. The maximum torsion, is more in stiffness asymmetric structure .It has been noticed that the maximum torsion values in symmetric structure is less by 33% and in mass asymmetric structure is less by 77% when compared to building with stiffness asymmetric structure.
5. REFERENCE
1. AdyAviram, BozidarStojadinovic, Armen Der
Kiureghian, (2010), “Performance And Reliability Of Exposed Column Base Plate Connections For Steel Moment-
2. Resisting Frames”, PEER Report 2010/107 Pacific
Earthquake Engineering Research Center College of Engineering University of California, Berkeley.
© 2018, IRJET | Impact Factor value: 6.171 | ISO 9001:2008 Certified Journal | Page 867
American Society of Civil Engineers, Reston, Virginia.
4. ATC 40,(1996). Seismic evaluation and retrofit of
concrete buildings, Vol.1, Applied Technology Council, Redwood city, CA.
5. Bill Tremayne & Trevor E Kelly, (2005), “Time History Analysis As A Method Of
6. Implementing Performance Based Design”, Holmes
Consulting Group, Auckland, New Zealand.
7. Chang S. and Kim. S.,(1994), “Structural Behaviour Of Soft Story Buildings, National Earthquake Engineering Congress,” pp449-459.