TITLE
THE IRIS RECOGNITION USING GRAY LEVEL CO-OCCURRENCE MATRIX FOR GABOR WAVELET TRANSFORM AND PRINCIPAL COMPONENT
ANALYSIS THROUGH PATH ANALYSIS TEST CASE
SENAN ADEL MAWLOOD
A thesis submitted in
partial fulfillment of the requirements for the award of the Degree of Master of Software Engineering
Faculty of Computer Science and Information Technology Universiti Tun Hussein Onn Malaysia
ABSTRACT
vi
ABSTRAK
TABLE OF CONTENTS
TITLE i
DECLARATIONS ii
DEDICATION iii
ACKNOWLEDGEMENT iv
ABSTRACT v
ABSTRAK vi
TABLE OF CONTENTS vii
LIST OF TABLES xi
LIST OF FIGURES xii
LIST OF SYMBOLS AND ABBREVIATIONS xiv
LIST OF APPENDICES xv
CHAPTER 1 INTRODUCTION 1
1.1 General Overview 1
1.2 Motivation 2
1.3 Problem Statement 3
1.4 Research Objectives 3
1.5 Research Scope 3
1.6 Significance of the Research 4
1.7 Contribution of Thesis 4
1.8 Outline of Thesis 4
CHAPTER 2 LITERATURE REVIEW 6
2.1 Introduction 6
2.2 Biometrics 7
viii
2.2.2 Palm Print 9
2.3 Iris Biometric for Authentication 9
2.4 Historical Approach to Iris Recognition 10
2.4.1 Iris Recognition System 10
2.4.2 Iris Recognition Technology 12
2.4.3 Applications of Iris Recognition 13 2.4.4 Advantages of using Iris Recognition 13
2.5 Image Enhancement Technique 14
2.6 Iris Localization 15
2.6.1 Region of interest using Sobel operator 16
2.6.2 Sobel Edge Detection 16
2.7 Principal Component Analysis (PCA) 17
2.7.1 Summary of Feature Reduction Using PCA 17
2.8 Gabor Wavelet Transform 19
2.9 Gray-Level Co-occurrence Matrix (GLCM) 22
2.10 Normalization of Features Extracted 24
2.11 Classification and Matching 25
2.12 Path Analysis Test Case 26
2.13 Measuring the Reliability 26
2.14 Previous Related Work to the Iris Recognition System 27
2.15 Chapter Summary 30
CHAPTER3 METHODOLOGY 31
3.1 Introduction 31
3.2 Flow Chart of the Proposed Methods 32
3.3 Iris Recognition Database 33
3.4 Image Pre-processing 33
3.6 Iris Localization 35
3.7 Edge Detection 36
3.7.1 Sobel Edge Detection 36
3.8 Features Extraction Methods 37
3.9 Feature Extraction with PCA 37
3.10 Feature Extraction with Gabor Wavelet 39
3.11 GLCM under PCA and Gabor Wavelet 41
3.12 Min–Max Normalization 41
3.13 Iris Image Matching 42
3.14 Iris Recognition Rate 42
3.15 Summary of Chapter 44
CHAPTER4 RESULTS AND DISCUSSION 45
4.1 Introduction 45
4.2 System Design 45
4.3 Graphical User Interface (GUI) 46
4.4 Algorithm Designed 47
4.5 Database Collection 47
4.6 Pre-processing 48
4.7 Iris Localization 50
4.8 Gabor Filter and Feature extraction 51
4.9 PCA Reduction and Features Extraction 52
4.10 Analysis of Gabor Algorithm 53
4.10.1 Case (1) System Design Using Five Classes 53 4.10.2 Case (2) Gabor Test with Ten Classes 54 4.10.3 Case (3) Gabor System Design for Twenty Users 56
4.11 Analysis of PCA Algorithm 57
x 4.11.2 Case (2) PCA System Design with Ten Users 59 4.11.3 Case (3) PCA System Design with Twenty Users 60 4.12 Path Analysis Test Cases of Gabor and PCA Algorithm 61
4.13 Reliability of the Proposed System 62
4.13.1 Measuring the Reliability 62
4.14 Comparison of the Proposed Methods 64
4.15 Chapter Summary 65
CHAPTER 5 CONCLUSION AND FUTURE WORK 67
5.1 Conclusion 67
5.2 Future Work 68
REFERENCES 69
APPENDICES 74
LIST OF TABLES
2.1 Summary of Previous Works 30
4.1 Recognition Rate using Gabor Filter 64
xii
LIST OF FIGURES
1.1 Biometrics Security Process 2
2.1 Biometrics Classification 7
2.2 Fingerprint Elaboration 8
2.3 The main Patterns for Palm Print 9
2.4 Illustration of the Areas of Pupil, Iris and Sclera 11
2.5 The Iris Identification System 12
2.6 A Side-View Cross-Sectional Diagram of the Eye 13
2.7 Iris Localization 15
2.8 A 3×3 Area of an Image 16
2.9 The Sobel operators 16
3.1 Iris Recognition Flow Chart 32
3.2 (a) The original Image. (b) Gray scale Image 34
3.3 Histogram Equalization 35
3.4 (a) Gray scale Image. (b) Image Enhancement using Histogram
35
3.5 Iris Localization 36
3.6 (a) Gray scale Image. (b) Edge Detection using Sobel operator. (c) The Region was detected for Iris Image
37
3.7 (a) The output Image from Histogram Enhancement. (b) Compressed image using PCA
38
3.8 The Shift Invariant Method for Gabor Filter 40 3.9 (a) Iris Localization using Sobel Edge Detection. (b) Gabor
Filter output
40
3.10 Illustrates the Construction of GLCM 41
4.1 Typical Iris Recognition System 46
4.3 Images used in the Database 48
4.4 Original Iris Image 49
4.5 Gray level Image 49
4.6 Enhanced the Iris Image using Histogram Equalization 50
4.7 Iris Localization using Sobel operator 51
4.8 Gabor Filter output 52
4.9 Compressed Images using PCA 53
4.10 Recognition Rate for Gabor Filter with Case (1) 54 4.11 Total Recognition Rate for Gabor Filter with Case (1) 54 4.12 Recognition Rate for Gabor Filter with Case (2) 55 4.13 Total Recognition Rate for Gabor Filter with Case (2) 55 4.14 Recognition Rate for Gabor Filter with Case (3) 56 4.15 Total Recognition Rate for Gabor Filter with Case (3) 57
4.16 Recognition Rate for PCA with Case (1) 58
4.17 Total Recognition Rate for PCA with Case (1) 58
4.18 Recognition Rate for PCA with Case (2) 59
4.19 Total Recognition Rate for PCA with Case (2) 60
4.20 Recognition Rate for PCA with Case (3) 61
4.21 Total Recognition Rate for PCA with Case (3) 61 4.22 Reliability of the System for Gabor Filter Method 63
4.23 Reliability of the System for PCA Method 63
xiv
LIST OF SYMBOLS AND ABBREVIATIONS
𝑛𝑘 – The Number of Pixels at Intensity Level
n – The Total Number of Pixels
f – The Magnitude of Gradient Vector 𝑆𝑡 – Covariance Matrix
θ – Theta
𝑅 – Training Set of Image
U – Basis Vectors Matrix 𝑉𝑖𝜃 – Standard Deviation
VAR – Variance of Gray Level
𝜎 – Sigma
𝜇𝑖 – The Mean of Image
Rel – Reliability
GLCM – Gray-Level Co-occurrence Matrix NaN – Not-a- Number
K-NN – k-Nearest Neighbor
CASIA – Institute of Automation, Chinese Academy of Sciences SVM – Support Vector Machine
FFT – Fast Fourier Transform 2D – Two Dimensional
DWT – Discrete Wavelet Transform FAR – False Accepted Rate
LIST OF APPENDICES
APPENDIX TITLE PAGE
A Path Analysis Test Case for Gabor Filter (5) Classes 74 B Path Analysis Test Case for Gabor Filter (10) Classes 75 C Path Analysis Test Case for Gabor Filter (20) Classes 76 D Path Analysis Test Case for PCA (5) Classes 77 E Path Analysis Test Case for PCA (10) Classes 78 F Path Analysis Test Case for PCA (20) Classes 79 G Coding for Iris Recognition System Using Gabor Filter
(Recognition Rate)
80
H Coding for Iris Recognition System Using PCA (Recognition Rate)
CHAPTER 1
INTRODUCTION
1.1 General Overview
In an increasingly digitized world, the reliable personal authentication has become an important human computer interface activity. National security, e-commerce, and access to computer networks are now very common where establishing a person’s identity has become vital. Traditional methods for personal identification include the token-based methods that use specific things such as identification cards or keys for authentication and knowledge-based methods that use something to know such as password for identification. However, these methods are usually not reliable (Cui et al., 2004). Therefore, deoxyribonucleic acid (DNA), facial features, voice patterns, hand geometry, retinal patterns, vein patterns, signature dynamics, voice verification, facial thermograph, nail bed identification, gait recognition, ear shape recognition, and finger prints have all been explored as biometric identifiers with varying levels of success. However, the iris, being unique and stable for a lifetime period is the most reliable biometric (Lenina & Kokare, 2009). A very important characteristic of an iris is that it is a naturally protected organ and stable without any variations along with the ageing of an individual. Thus, the aim of feature extraction is to find a transformation from an n-dimensional observation space to a smaller m-dimensional feature space.
based on the local properties such as phase, and shape. Besides, PCA can produce spatially global features (Bae et al., 2003). Gabor filtering is vastly used in iris recognition literature for feature extraction. Conventionally, Gabor parameters values are supplied by pre-knowledgeable values so that the filter bank size is increased to prevent loss of information (Bae et al., 2003). However, this research extracted more features for iris pattern from the Gabor filter and PCA using proposed methods such as Correlation, Contrast, Energy, Homogeneity, and Entropy.
1.2 Motivation
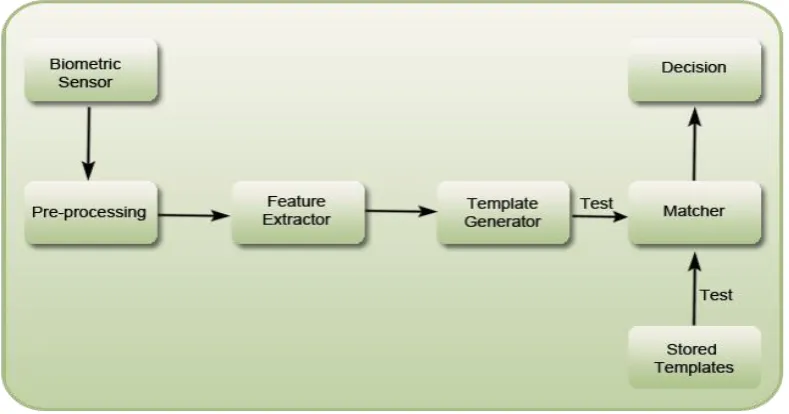
[image:14.595.123.518.451.658.2]Biometrics is the science of verifying the identity of an individual through physiological measurements or behavioural traits. Fingerprint verification is one of the most reliable personal identification methods and it plays a very important role in forensic applications like criminal investigations, terrorist identification, and National security issues. Since biometric identifiers are associated permanently with the users, they are more reliable than token or knowledge based authentication methods (Zhu et al., 2002).
Figure 1.1: Biometrics Security Process (Zhu et al., 2002)
3 security system has always the threat of being stolen and accessed by unauthorized user.
Furthermore, the traditional security systems are always prone to accuracy, as compared to biometrics, which is more accurate. For example, in a case of one individual with multiple identification cards: The traditional security systems were unable to solve the problem of individuals having multiple Identification cards and multiple passports to enter a foreign country. Biometrics gives us a system in which an individual cannot possess multiple Identification cards or change his Identification throughout his life time. Each individual is identified through a unique biometric identity throughout the world.
1.3 Problem Statement
Iris verification is the most reliable personal identification method and it plays a very important role in forensic applications such as in criminal investigations, terrorist identification, and National security issues. Therefore, increasing the success rate and reducing the false accepted rate of iris recognition is needed. However, complexity of some Iris recognition systems may require so much computation as to be impractical (Wan et al., 2004).
1.4 Research Objectives
Based on the research background and the related issue, the objectives of this research have been formulated as follow:
(i) Design a new feature extraction for iris based on Gabor wavelet and Principal Component Analysis using Gray Level Co-occurrence Matrix.
(ii) Analyze the iris recognition system based on Accuracy and Complexity. (iii) To compare the performance of the proposed system with the existing one
based on Total Success Rate, False Rejected Rate, and False Accepted Rate.
1.5 Research Scope
database and enhance the quality, image segmentation, and normalization as the image features extraction was based on Gabor wavelet transform and PCA. Classification process was done based on the nearest neighbour, and finally, on obtaining recognition of iris, the final score of accuracy and complexity such as computation time was measured.
1.6 Significance of the Research
Iris recognition is a particular type of biometrics system that can be used to reliably identify a person by analyzing the patterns found in the iris. The iris is so reliable as a form of identification because of the uniqueness of its pattern (Amrita et al., 2013). Although there is a genetic influence, particularly on the iris colour, the iris develops through folding of the tissue membrane and then degeneration (to create the pupil opening) which results in random and unique iris traits, thus, the iris recognition system has been found useful in both forensic investigations and civilian applications.
1.7 Contribution of Thesis
This thesis contributes in the increase of the overall accuracy of iris recognition system by increasing the success rate and decreasing the false accepted rate. Furthermore, this work contributes in reducing the complexity of the system by reducing the processing time.
1.8 Outline of Thesis
This thesis provides description and report on the effort that was carried out throughout the duration of the project in order to achieve the project scope and objectives. This thesis is divided into five chapters that cover the whole project. General description to the contents of the chapters is summarized below.
5 Chapter 2 introduces the history of iris recognition system and the theories involved in the process of designing iris recognition system. In this chapter, previous methods and algorithms are discussed and summarized. Besides, related topics and works relevant to the study based on various journals and publications are reviewed and used as reference to this project.
Chapter 3 proposed for designing iris recognition algorithm which depended on the Gabor wavelet and PCA. This chapter introduces several image pre-processing techniques for the purpose of enhancing the iris images. Comparative study of iris recognition system is built based on the Total Success Rate, False Accepted Rate, and False Rejected Rate.
Chapter 4 discusses the obtained results from the proposed methods and evaluated the parameters such as, False Accepted Rate, False Rejected Rate, and Total Success Rate. This chapter also introduces comparatives of the obtained accuracies by the two proposed algorithms through path analysis test case.
CHAPTER 2
LITERATURE REVIEW
2.1 Introduction
This chapter introduces the general concept of biometrics that is used for verification and identification. It also explains the applications of biometrics and introduces its characteristics. Biometric is an automated method of identifying a person or verifying the claimed identity of a person based on physiological or behavioural characteristics. Physiological characteristics are fingerprint, hand geometry, iris, and facial characteristics, whereas behavioural characteristics are traits that can be learned or acquired such as keystroke dynamics, speaker verification, and dynamic signature verification. In this project, iris recognition system is explained in detail and previous work is discussed in this chapter.
Based on the researches done from diverse resources, the iris verification and recognition system was found in abundance. Different methods and concepts were reviewed and discussed on how it can be used, worked, and implemented.
7 2.2 Biometrics
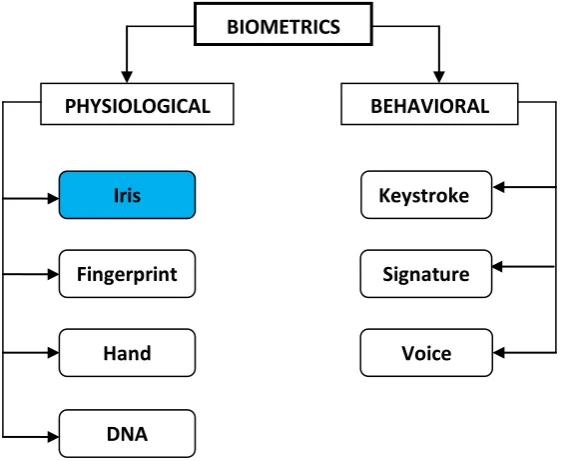
Biometrics is technological science which has been used to identify people in one form or many others over decades, as long as it belongs to an individual’s unique physical characteristics and which can never be lost or duplicated and is widely considered as rapid, accurate, and a dependable approach of verifying a person. Biometrics system can be classified according to physical and behavioral traits, as shown in Figure 2.1. Any biometrics system can be functional in the three following approaches (Zhu et al., 2002).
(i) Detection: In this mode, the system should perform matching comparison from the captured biometric based on certain biometrics to determine if it is a physical characteristic that the system uses to detect.
(ii) Verification: In this mode, the system performs a one-to-one comparison from the captured biometric with a defined mold from a biometrics database to verify an individual.
[image:19.595.178.460.470.700.2](iii) Identification: In this mode, the system performs a one-to-many comparison across a biometrics database to establish the identity of an unknown individual.
Figure 2.1: Biometrics Classification BIOMETRICS
BEHAVIORAL PHYSIOLOGICAL
Iris
Fingerprint
Hand
DNA
Keystroke
Signature
The biometrics systems nowadays are quite acceptable for most applications in the recognition performance, but much work is still needed to provide convenient, privacy-friendly, and secured systems. One of the negative involvements of increased technology is the ease of spoofing into a biometrics identification systems. Hence, by increasing these kinds of attacks, it reduces the reliability and the security of biometrics systems. Furthermore, since most biometrics algorithms do not have the ability to differentiate live biometric from ones that are not live, it cannot differentiate between online and offline systems.
2.2.1 Fingerprint
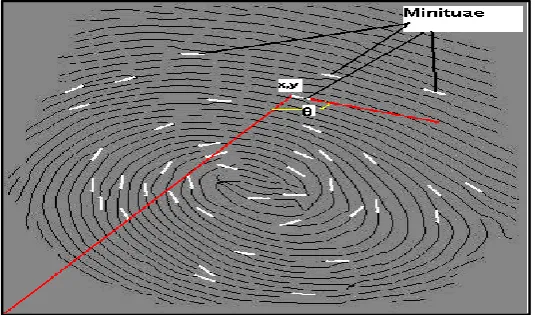
[image:20.595.186.454.572.729.2]Fingerprints are one of the oldest forms of biometric identifiers and also the most frequently deployed biometrics system due to their proven track record document. Fingerprints are unique to each person and each finger, where there are two fingers that share the same thump. The basis for identification is primarily based on minutiae that mark ends or bifurcation of ridges as in the white lines, as shown in Figure 2.2 below. The orientation and location of these minutiae were recorded and compared to each. About 10-11 minutiae are sufficient in uniquely identifying a person (Sonkamble et al., 2010). An indexing system, known as the Henry system, is also used widely and is adopted by computer based identification schemes for classification purpose. The minutiae form a triplet (x, y, θ), where x and y are their locations (of the point of ridge ending or bifurcation) and θ is the point of orientation of the minutiae (as if the ridge continued in the ridge ending case).
9 2.2.2 Palm Print
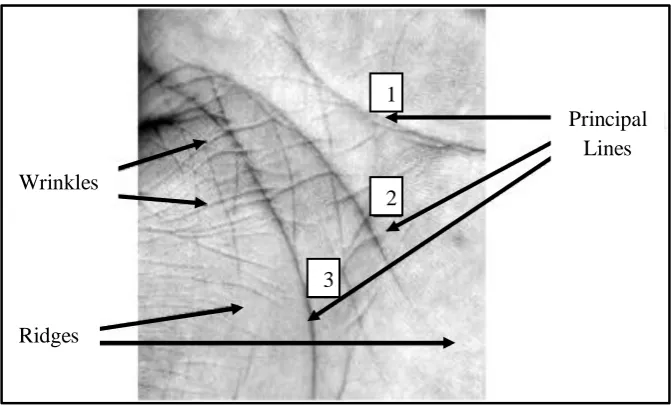
[image:21.595.151.487.276.479.2]Palm print is of human hand’s inner surface skin impression that extends from the wrist to tip of the fingers. It is rich in lines, valleys, ridges, textures, and points that would give sufficient information for the distinction between individuals. The distinction result that is expected from palm print is better than fingerprint because its area is larger than that of fingerprint, but the capture device will be larger and costly (Michael et al., 2011) as well. Figure 2.3 below illustrates the main patterns for palm print.
Figure 2.3: The main Patterns for Palm Print (Michael et al., 2011)
2.3 Iris Biometric for Authentication
Biometrics has advantages of being:
(i) Unique for a person with no chance of unintentional duplication.
(ii) Much longer and random compared to a password that is within the ability of a human to remember and most importantly, it is always conveniently there with the person.
The iris makes its use suitability as an exceptionally accurate biometric because of the high random appearance on the iris. Hence, the characteristics of iris are:
(i) Extremely data-rich physical structure.
1
3 2
Principal Lines Wrinkles
(ii) Genetic independence as no two eyes is the same. (iii) Stability over time.
(iv) Physical protection by a transparent window (the cornea) that does not inhibit external view ability.
2.4 Historical Approach to Iris Recognition
In 1936, ophthalmologist Frank Burch proposed the concept of using iris patterns as a method to recognize human beings. In 1985, Drs. Leonard Flam and Aran Safir, ophthalmologists, proposed the concept that no two irises are alike and were awarded a patent for the iris identification concept in 1987. In 1993, the Defence Nuclear Agency in the United States began work to test and deliver a prototype unit which was successfully completed by 1995 due to the combined efforts of Drs. Flom, Safir, and Daugman. In addition, in 1994, Dr. Daugman was awarded a patent for his automated iris recognition algorithms (Daugman, 1992). Furthermore, in 1995 the first commercial products became accessible. In 2005, the broad patent covering the basic concept of iris recognition expired, providing marketing opportunities for other companies that have developed their own algorithms for iris recognition (Daugman, 1993). Finally, the patent on the iris codes implementation of iris recognition that was developed by Daugman expired in 2011.
2.4.1 Iris Recognition System
11
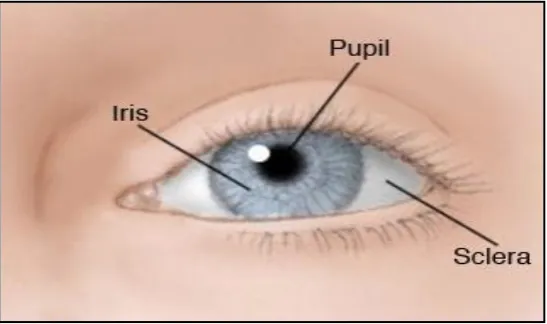
Figure 2.4: Illustration of the Areas of Pupil, Iris and Sclera (Riverside, 2013)
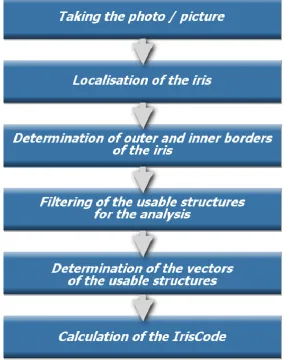
Iris recognition emerges from the need to recognize an individual’s identity from the texture of his/her iris pattern. There are four stages carried out for iris recognition: acquiring image of iris, segmentation iris, extracting of useful features, and matching of pattern.
Figure 2.5: The Iris Identification System
2.4.2 Iris Recognition Technology
13
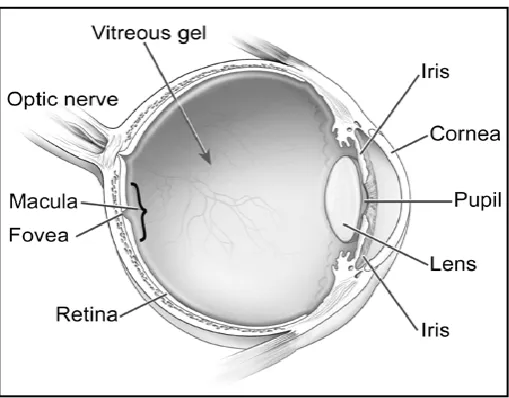
Figure 2.6: A Side-View Cross-Sectional Diagram of the Eye (Michael, 2002)
Every iris is distinct, including the two irises belonging to the same individual and the irises of twins as well. Iris patterns are formed before birth and do not naturally change over the course of a lifetime. Iris is highly stable as a recognizable characteristic because of the natural protection of the eyes in the face and the protection of the iris beneath the cornea (Daugman, 1993). Furthermore, the medical procedures such as refractive and cataract surgeries or cornea transplants do not affect its recognizable characteristics.
2.4.3 Applications of Iris Recognition
Major applications of the iris recognition technology so far have been: substituting for passports, aviation security and controlling access to restricted areas at airports (Boles & Boashash, 1998), database access and computer login, access to buildings, homes and hospital settings, including mother-infant pairing in maternity wards, database searching at border crossings and other Government programs.
2.4.4 Advantages of using Iris Recognition
The following are the important advantages of using the iris recognition system: (i) It performs 1: N identification with no limitation on numbers.
(iii) Biometrics templates once captured need not to be enrolled again as the iris is stable throughout a user’s life.
2.5 Image Enhancement Technique
Image enhancement is a technique used to improve the information in images for iris and provide better input for other automated image processing techniques. The principal objective of image enhancement is to modify the attributes of an image to make it more suitable for a given task and a specific observer. Through this process, one or more attributes of the image are modified. The choice of attributes and the way they are modified are specific to a given task. Besides, observer-specific factors, such as the human visual system and the observer's experience will introduce a great deal of subjectivity into the choice of image enhancement methods (Raman & Himanshu, 2010). There are many techniques that can enhance a digital image without spoiling it, such as gray scale and histogram enhancement.
Histogram equalization is a common technique for enhancing the appearance of images. Suppose there is an image that is mostly dark, its histogram would be skewed towards the lower end of the gray scale and all the image details are compressed into the dark end of the histogram. If the gray levels stretch out at the dark end, it would produce a more uniformly distributed histogram and the image would become clearer (Raman & Himanshu, 2010). The probability density function of a pixel intensity level, 𝑟𝑘 is given in the following equation:
𝑝𝑟 𝑟𝑘 =𝑛𝑛𝑘 (2.1)
where
0 ≤ 𝑟𝑘 ≤ 1, k = 0,1,...,255 , 𝑛𝑘 is the number of pixels at intensity level, 𝑟𝑘, 𝑝𝑟(𝑟𝑘) is the probability density of a pixeland n is the total number of pixels. The histogram is derived by plotting 𝑝𝑟(𝑟𝑘) against 𝑟𝑘 . A new intensity 𝑆𝑘 of level k is defined as:
𝑆𝑘 = 𝑛𝑗
𝑛 𝑘
15 Applying the histogram equalization locally using local windows of NxN
pixels will result in expanding the contrast locally and changing the intensity of each pixel according to its local neighbourhood (Aravinth & Valarmathy, 2012).
Gray level is the spatial domain equivalent to band-pass filtering. A gray level slicing function can either emphasize a group of intensities and diminish all others or it can emphasize a group of gray levels and leave the rest alone (Raman & Himanshu, 2010).
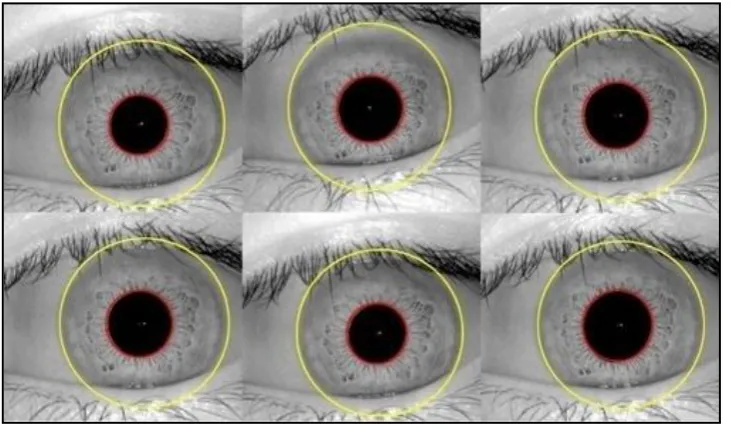
2.6 Iris Localization
[image:27.595.135.501.487.701.2]Iris scans analyze the features that exist in the colour tissue surrounding the pupil which has more than 200 points that can be used for comparison, which includes rings furrows and freckles. However, the scans use a regular video camera style and can be done from further away than a retinal scan (Ziauddin & Dailey, 2010). Furthermore, the uniqueness of eyes, even between the left and right eye of the same person, makes iris scanning very powerful for recognition. The likelihood of a false acceptance is extremely low and its relative speed and ease of usage make it a great potential biometric. Besides, Sobel operator techniques can be used to detect the edges of the iris images. Figure 2.7 illustrates Iris Localization.
2.6.1 Region of interest using Sobel operator
An important quantity in edge detection is the magnitude of this vector, denoted f .
where
∇𝑓 = 𝐺𝐺𝑥 𝑦 =
𝜕𝑓 𝜕𝑥 𝜕𝑓 𝜕𝑦
(2.3)
The magnitude gives the maximum rate of increase of f (x, y) per unit distance in the direction of .
where
2 2
x y
f G G
f . Another important quantity is the direction of the
gradient vector. That is the angle of tan 1 y x G G f where
The angle is measured with respect to the x-axis. The direction of an edge at (x, y) is perpendicular to the direction of the gradient vector at that point. Computation of the gradient of an image is based on obtaining the partial derivatives of f x and f y at every pixel location (Che-Ming, 2011).
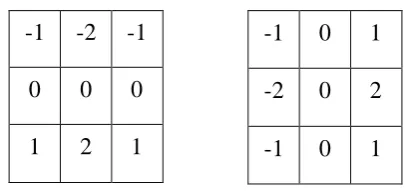
2.6.2 Sobel Edge Detection
[image:28.595.303.508.634.729.2] [image:28.595.152.232.634.727.2]The aim of Sobel edge detector is to compute the gradient magnitude and the angle of the gradient. Figure 2.8 and Figure 2.9 below illustrate the areas of an image and the Sobel operators.
Figure 2.8: A 3×3 Area of an Image Figure 2.9: The Sobel operators P1 P2 P3
P4 P5 P6 P7 P8 P9
-1 -2 -1 0 0 0 1 2 1
17
3
1 2 7 8 9 3 5 9 1 4 7
| | | | | |
| ( 2 ) ( 2 ) | | ( 2 ) ( 2 ) |
x y
G G G
P P P P P P P P P P P P
(2.4)
where
x
G andGy convolve the image and produce the gradient.
2.7 Principal Component Analysis (PCA)
The aim of feature extraction is to find a transformation from an n-dimensional observation space to a smaller m-dimensional feature space, as given by literature. The main reason for performing feature extraction is to reduce the computational complexity for iris recognition. However, most existing iris recognition methods are based on the local properties such as phase and shape, and these do not give enough information about the image. Furthermore, iris image recognition based on local properties is difficult to implement (Cui et al., 2004). The PCA searches for
k n-dimensional orthogonal vectors that can best be used to represent the data, where
k ≤ n. Hence, the original data are projected onto smaller space which results in data reduction (Pravin et al., 2012).
2.7.1 Summary of Feature Reduction Using PCA
The PCA is a statistical method for reducing data dimensions. In PCA, the training data is used to obtain the Eigen basis vectors. Then, the training sets R and T are projected into those vectors. The PCA can be summarized by the following steps: (a) The mean M of the training set is calculated and subtracted from the training
set:
𝑀 =𝑛1 𝑛𝑖=1𝑅𝑖 (2.5)
where
For all training set perform
𝑅𝑖 = 𝑅𝑖− 𝑀 (2.6)
(b) The Eigenvectors and values of the training set covariance matrix 𝑆𝑡 are calculated.
𝑆𝑡 = 𝑅. 𝑅𝑇 (2.7)
where
𝑆𝑡 : Covariance Matrix. 𝑅 : Training set of image.
𝑅𝑇 : Transpose Training set of image.
The Eigen vectors corresponding to the N largest Eigen values of 𝑆𝑡 are picked. These construct the N principal components matrix (𝑉).
(c) The Basis vectors matrix (𝑈) is constructed as:
𝑈 = 𝑉. 𝑅𝑇 (2.8)
where
U : Basis vectors matrix. 𝑉 : Eigen Value.
𝑅𝑇 : Transpose Training set of image.
(d) The reduced feature vector is calculated for training and testing data as:
𝑊𝑅 = 𝑅. 𝑈 (2.9)
where
U : Basis vectors matrix.
19
𝑊𝑇 = 𝑇. 𝑈 (2.10)
where
U : Basis vectors matrix.
T : Tested Image.
The mean M must be subtracted from the testing data T. Many experiments were conducted using different numbers of Eigenvectors (N) between (10-60), depending on the size of image database. The final features are projected to reconstruct the reduced dimension images and are used for other features extraction.
2.8 Gabor Wavelet Transform
Iris reputes for its potential to identify the people with high accuracy in large scale. However, this is not achieved unless the iris patterns are well represented. Gabor filtering is vastly used in iris recognition literature for feature extraction. Conventionally, Gabor parameters values are supplied by pre-knowledgeable values so that the filter bank size is increased to prevent loss of information (Manikandan & Sundararajan, 2010).
fingerprint recognition. Relations between activations for a specific spatial location are very distinctive between objects in an image. Furthermore, important activations can be extracted from the Gabor space in order to create a sparse object representation. The local regions of an iris are projected onto quadrature (2D) Gabor filter using the following equations (Bhattacharya et al., 2013).
𝐺 𝑥, 𝑦, 𝑓, 𝜃 = 𝑒𝑥𝑝{−12 𝑥𝛿′ 2
𝑥2 +
𝑦′ 2
𝛿𝑦2 } 𝑐𝑜𝑠 2𝜋𝑓𝑥
′ (2.11)
𝑥′ = 𝑥𝑐𝑜𝑠𝜃 + 𝑦𝑠𝑖𝑛𝜃 (2.12)
𝑦′ = 𝑥𝑠𝑖𝑛𝜃 − 𝑦𝑐𝑜𝑠𝜃 (2.13)
where
f is the frequency of the sinusoidal plane wave along the direction from the x-axis, and 𝛿𝑥and 𝛿𝑦 specify the Gaussian envelope along x and y axes, respectively.
Before filtering the iris image, the gray level intensities are normalized in each cell separately to a constant mean and variance (Bhattacharya et al., 2013).
Normalization is done to remove the effects of sensor noise and iris pressure differences. Let I(x, y) denote the gray level of pixel (x, y), 𝑀𝑖and 𝑉𝑖, the estimated mean and variance of the cell, respectively, and 𝑁𝑖(x, y), the normalized gray level value of pixel (x, y). For all the pixels in the cell, the normalized image is defined as in the following equations:
The mean and variance of a gray level iris image (𝐼) are as given:
𝑀 𝐼 = 𝑁12 𝑁−1𝐼 𝑥, 𝑦 𝑗 =0
𝑁−1
𝑖−0 (2.14)
where
M : The Mean of Gray Level.
I : Iris Image.
x : Image Pixel.
y : Image Pixel.
𝑉𝐴𝑅 𝐼 = 𝑁12 𝑁−1 𝐼 𝑥, 𝑦 − 𝑀 𝐼 2 𝑗 =0
𝑁−1
21 where
VAR : Variance of Gray Level.
I : Iris Image.
Let N(x; y) represent the normalized gray-level value at pixel (x, y). The normalized image is defined as:
𝑁 𝑥, 𝑦 = 𝑀0+ 𝑉𝐴𝑅0(𝐼 𝑥,𝑦 −𝑀(𝐼))2
𝑉𝐴𝑅 𝑖𝑓 𝐼 𝑥, 𝑦 > 𝑀 (2.16)
𝑁 𝑥, 𝑦 = 𝑀0− 𝑉𝐴𝑅0 𝐼 𝑥,𝑦 −𝑀 𝐼 2
𝑉𝐴𝑅 (2.17)
where
M0 and VAR0 are the desired mean and variance respectively. Normalization
is pixel-wise operation. It does not change the clarity of the iris structures. The main purpose of normalization is:
(i) To have images with similar characteristics. (ii) To remove the effect of the sensor noise. (iii) To reduce the variation in gray level values.
If normalization is done on the entire image, then it cannot compensate for the intensity variations in the different parts of the iris due to iris pressure differences. Normalization of each cell separately alleviates this problem (Attarchi et al., 2008). The standard deviation of intensity in each filtered cell is treated as a feature value. Let 𝐹𝑖𝜃(𝑥, 𝑦) be the component image corresponding to for each cell. A feature 𝑉𝑖𝜃 is defined as standard deviation of each cell with the following equation:
𝑉𝑖𝜃 = ( 𝐹𝐾𝑖 𝑖𝜃 𝑥, 𝑦 − 𝑃𝑖𝜃)2 (2.18)
where
to obtain more accuracy. The distribution of gray level among the structure of iris image will be used for further features extraction (Attarchi et al., 2008).
2.9 Gray-Level Co-occurrence Matrix (GLCM)
This part of features extraction is based on the distribution of GLCM, as proposed by Haralick and Shanmugam (Haralick et al., 1973). The section below explains each one in detail.
(a) Correlation: It is a measure of how correlated a pixel is to its neighbour over the whole image. In another words, it determines the similarities between two images or objects. The range for GLCM is given by [-1,1]. Correlation is 1 or -1 for a perfectly positively or negatively correlated image. Correlation is NaN (Not-a-Number) for a constant image. It is given by the following equation (Selvarajah & Kodituwakku, 2011).
𝐶𝑜𝑟𝑟𝑒𝑙𝑎𝑡𝑖𝑜𝑛 = 𝑀 (𝑖−𝜇𝑖 )(𝑗 −𝜇𝑗 )𝑃(𝑖,𝑗 )𝜎𝑖𝜎𝑗 𝑗 =1
𝑁
𝑖=1 (2.19)
where
𝜎𝑖𝜎𝑗 : The Variance of Image. 𝜇𝑖 : The Mean of Image.
i : Image Pixel.
j : Image Pixel.
p : Probability Density of Gray Level.
(b) Contrast: It is a measure of the intensity contrast between a pixel and its neighbour over the whole iris image and it is given by equation (Selvarajah & Kodituwakku, 2011). The range for GLCM is given as [0, (size (GLCM,1)- 1)^2], and the contrast is zero for a constant image.
𝐶𝑜𝑛𝑡𝑟𝑎𝑠𝑡 = 𝑀 (|𝑖 − 𝑗|)2
𝑗 =1 𝑃 𝑖, 𝑗
𝑁
𝑖=1 (2.20)
where
23
j : Image Pixel.
p : Probability Density of Gray Level.
(c) Energy: It is the sum of squared elements in the GLCM and given by the equation below. The range for GLCM is given by [0,1], Energy is 1 for a constant image (Selvarajah & Kodituwakku, 2011).
𝐸𝑛𝑒𝑟𝑔𝑦 = 𝑀 𝑃(𝑖, 𝑗)2 𝑗 =1
𝑁
𝑖=1 (2.21)
where
i : Image Pixel.
j : Image Pixel.
p : Probability Density of Gray Level.
(d) Homogeneity: It is a value that measures the closeness of the distribution of elements in the GLCM to the diagonal and it is given by the equation below (Selvarajah & Kodituwakku, 2011). The range for GLCM is [0,1], whereby homogeneity is 1 for a diagonal GLCM.
𝐻𝑜𝑚𝑜𝑔𝑒𝑛𝑖𝑡𝑦 = 𝑀 (1+(𝑖−𝑗 )) 𝑃(𝑖,𝑗 ) 𝑗 =1
𝑁
𝑖=1 (2.22)
where
i : Image Pixel.
j : Image Pixel.
p : Probability Density of Gray Level.
level probabilities in the image. The entropy is useful for image focusing. The wavelet energy signatures reflect the distribution of energy along the frequency axis over scale and orientation and have proven to be very powerful for texture characterization.
𝐸𝑛𝑡𝑟𝑜𝑝𝑦 = − 𝑁 𝑃 𝑥𝑖 log𝑏𝑃 𝑥𝑖
𝑖=1 (2.23)
where
𝑃 𝑥𝑖 is the probability that the difference between 2 adjacent pixels is equal to i, and log𝑏 is the base 2 logarithm.
Image entropy is a quantity which is used to describe the status of an image for example, the amount of information which must be coded by a compression algorithm. Low entropy images, such as those containing a lot of black sky, have very little contrast and large runs of pixels with the similar values. An image that is perfectly flat will have entropy of zero value. Consequently, they can be compressed to a relatively small size. On the other hand, high entropy images such as an image of heavily cratered areas on the moon, have a great deal of contrast from one pixel to the next and consequently, cannot be compressed as much as low entropy images (Selvarajah & Kodituwakku, 2011). From this information about entropy, it is proposed as one of the features to differentiate between two set of objects/iris.
2.10 Normalization of Features Extracted
Let X denotes these to raw matching scores from a specific matcher, and let 𝑥є𝑋. The normalized score of x is then denoted by
𝑥
′. These normalization schemes can be used with Euclidian distance for improving the accuracy (Ross et al., 2005).69
REFERENCES
Ali, H., Salami, M. J. E. & Wahyudi. (2008). Iris Recognition System by Using Support Vector Machines. IEEE Computer and Communication Engineering, pp 516 – 521.
Amrita, Cheema, J. S. & Neeru, N. (2013). Detection and Removal of Noises in Iris Recognition System. International Journal of Engineering Research & Technology (IJERT), 2(4), ISSN: 2278 – 0181.
Aravinth, J. & Valarmathy, S. (2012). A Novel Feature Extraction Techniques for Multimodal Score Fusion Using Density Based Gaussian Mixture Model Approach. International Journal of Emerging Technology and Advanced Engineering, India, 2(1), pp. 189 – 197.
Arnia, F. & Pramita, N. (2011). Enhancement of Iris Recognition System Based on Phase Only Correlation.9(2), pp. 387 – 394.
Attarchi, S. Faez, K. & Asghari, A. (2008). A Fast and Accurate Iris Recognition Method Using the Complex Inversion Map and 2DPCA. CIS 08. Seventh IEEE/ACIS International Conference, pp. 179 – 184.
Bae, K., Noh, S. & Kim, J. (2003). Iris feature extraction using independent component analysis. Springer Berlin Heidelberg, pp. 838 – 844.
Bhattacharya, D. Devi, J. & Bhattacherjee, P. (2013). Brain Image Segmentation Technique Using Gabor filter parameter. American Journal of Engineering Research (AJER),2(9), pp.127 – 132.
Boles, W.,W. & Boashash, B. (1998). A Human Identification Technique Using Images of the Iris and Wavelet Transform. IEEE Transaction on Signal Processing. 46(4), pp. 1185 – 1188.
Cui, J., Wang, Y., Huang, J., Tan, T., & Sun, Z. (2004). An iris image synthesis method based on PCA and super-resolution. International Conference on Pattern Recognition, 4, Pp. 471 – 474.
Cui, J., Wang, Y., Tan, T., Ma, L., & Sun, Z. (2004). A fast and robust iris localization method based on texture segmentation. International Society for Optics and Photonics, Pp. 401 – 408.
Daugman, J. (1992). High confidence personal identification by rapid video analysis of iris Texture. International Carnahan Conference.
Daugman, J. (1993). High confidence visual recognition of persons by a test of statistical independence. Pattern Analysis and Machine Intelligence, IEEE Transactions, Pp. 1148 – 1161.
Daugman, J. (1994). Biometric personal identification system based on iris analysis United States Patent, Patent Number: 5, 291, 560.
Daugman, J. (2002). How iris recognition works. University of Cambridge, The Computer Laboratory, Cambridge, U.K, 1.
Daugman, J. (2007). New Methods in Iris Recognition. IEEE Transactions, 37. Deepika, G. & Kuldeep, K. (2009). Reliability Analysis of Pharmaceutical Plant
Using Matlab-Tool. International Journal of Electronic Engineering Research, India, 1(2), pp. 127 – 133.
Dobe, M. & Machala, L. (2003). Iris Database. Scanned by TOPCON TRC50IA optical device connected with SONY DXC-950P 3CCD camera. Czech
http://www.inf.upol.cz/iris/
Fallah, L. (2010). IRIS Recognition Using Neural Network. Proceedings of the International MultiConference of Engineers and Computer Scientists, 1. Gawande, U., Zaveri, M. & Kapur, A. (2010). Improving Iris Recognition Accuracy
by Score Based Fusion Method. International Journal of Advancement in Technology, 1(1).
Gulmire, K. & Ganorkar, S. (2012). Iris Recognition Using Gabor Wavelet.
International Journal of Engineering Research & Technology (IJERT). ISSN: 2278-0181, 1(5).
Haralick, R. M., Shanmugan, K., & Dinstein, I. (1973). Textural Features for Image Classification. IEEE Transactions on Systems, Man, and Cybernetics, USA,
71 Kekre, H. B., Sudeep, D., Thepade, Jain, J. & Agrawal, N. (2010). IRIS Recognition using Texture Features Extracted from Haarlet Pyramid. International Journal of Computer Applications, 11(12), pp. 1 – 5.
Kshamaraj, G. & Sanjay, G. (2012). Iris Recognition Using Gabor Wavelet.
International Journal of Engineering Research & Technology (IJERT).
ISSN: 2278-0181, 1(5).
Kumar, P. (2011). Iris Recognition with Fake Identification. Computer Engineering and Intelligent Systems. ISSN 2222-1719, 2(4).
Lenina, Ms. & Kokare, M. (2009). Iris Recognition Using Discrete Wavelet Transform. International Conference on Digital Image Processing, pp. 147 –151.
Manikandan, P. & Sundararajan, M. (2010). Discrete Wavelet Features Extraction for iris recognition based biometric security. International Journal of Electronic Engineering Research, 2(2), pp. 237 – 241.
Manu, G. & Harish, B. Er. (2013). Fingerprint Recognition System using Minutiae Estimation. International Journal of Application or Innovation in Engineering & Management (IJAIEM), 2(5).
Mattar, E. (2013). Principal Components Analysis Based Iris Recognition and Identification System. International Journal of Soft Computing and Engineering (IJSCE), ISSN: 2231-2307, 3(2).
Michael, G. (2002). Washington Internships for Students of Engineering (WISE) Program. USA.
Michael, G. K. O., Connie, T. & Teoh, A. B. J. (2011). A Contactless Biometric System Using Palm Print and Palm Vein Features, Advanced Biometric Technologies. PP. 156 – 178.
Mohamed, M. A., Abou-Elsoud, M. E. & Eid, M. M. (2009). An Efficient Algorithm in Extracting Human Iris Morphological Features. Networking and Media Convergence, pp. 146 – 150.
Najafi, M. & Ghofrani, S. (2011). Iris Recognition Based on Using Ridgelet and Curvelet Transform. International Journal of Signal Processing, Image Processing and Pattern Recognition, 4(2).
Naresh, A. (2002). Testing from use Casesusing Path Analysis Technique.
Pravin, S. Patil, S. Kolhe, R., Patil, R. V. (2012). The Comparison of Iris Recognition using Principal Component Analysis. Log Gabor and Gabor Wavelets. International Journal of Computer Applications ISSN: 0975 – 8887, 43(1).
Raghavan, S. (2012). Biometric authentication and encryption. PMP student University of Washington, USA.
Raman, M. & Himanshu, A. (2010). A Comprehensive Review of Image Enhancement Techniques. Journal of computing, 2(3).
Riverside. (2013). Mayo Foundation for Medical Education and Research (MFMER)
http://www.riversideonline.com/health_reference/Eye/EY00003.cfm
Ross, A., Nandakumar, K. & Jain, A. (2005). Score normalization in multimodal biometric systems, Pattern Recognition, pp. 2270 – 2285.
Selvarajah, S. & Kodituwakku, S. R. (2011). Analysis and Comparison of Texture Features for Content Based Image Retrieval. International Journal of Latest Trends in Computing, (2)1, pp. 108 – 113
Sharma, D. & Kumar, A. (2011). Iris Recognition – An Effective Human Identification. International Journal of Computing and Business Research, 2(2), pp. 73 – 75.
Shashi, K. D. R., Raja, K. B., Nuthan, N., Sindhuja, B., Supriya, P., Chhotaray, R. K. & Sabyasachi, P. (2011). Iris Recognition Based on DWT and PCA.
International Conference on Computational Intelligence and
Communication Networks. IEEE Computer Society, Washington, USA, pp.489 –493.
Somnath, D. & Debasis, S. (2010). Improved Feature Processing for Iris BiometricAuthentication System. International Journal of Electrical and Electronics Engineering, 4(2).
Sonkamble, S. Thool, R. & sonkamble, B. (2010). Survey of Biometric Recognition Systems and their Applications. Journal of Theoretical and Applied Information Technology,11, pp. 45 – 51.
73 Suganthy, M., Ramamoorthy, P. & Krishnamoorthy, R. (2012). Effective Iris Recognition For Security Enhancement. International Journal of Engineering Research and Applications (IJERA), 2(2), pp.1016 – 1019. Tripathi, K. P. (2011). A Comparative Study of Biometric Technologies with
Reference to Human Interface. International Journal of Computer Applications, (14)5, pp. 10 – 15.
Wan, A. W. A., Sing, L. T. & Hitam, S. (2004). Fingerprint Recognition In Wavelet Domain. Jurnal Teknologi, Universiti Teknologi Malaysia, Malaysia,
pp. 25 – 42.
Zhu, Y., Tan, T. & Wang, Y. (2002). Biometric personal identification based on iris patterns. The 15th International Conference on Pattern Recognition,
Barcelona, Spain,pp. 805 – 808.
Ziauddin, S. & Dailey, MN. (2010). Robust iris verification for key management.
Computer Science and Information Management, Asian Institute of