Journal of Chemical and Pharmaceutical Research, 2015, 7(9):27-35
Research Article
CODEN(USA) : JCPRC5
ISSN : 0975-7384
Validation of HPLC method for the analysis of methotrexate in bulk drug and
pharmaceutical dosage forms
P. Suguna, B. Sathyanarayana, G. Chandrasekhar and B. Narasimhulu
Department of Chemistry, S. V. University, Tirupati, A. P., India
_____________________________________________________________________________________________
ABSTRACT
A simple, economic, selective, precise, and accurate high performance liquid chromatographic method for the analysis of methotrexate in bulk drug and pharmaceutical formulations was developed and validated in the present study. The mobile phase consists of a mixture of acetonitrile and potassium dihydrogen orthophosphate in the proportion 92:8, a kept at the pH to 6.0 ± 0.05 with sodium hydroxide solution. This was found to give a sharp peak of methotrexate at a retention time of 4.517min. HPLC analysis of methotrexate was carried out at a wavelength of 303 nm with a flow rate of 1.4ml/min. The linear regression analysis data for the calibration curve showed a good linear relationship with a regression coefficient of 0.999 in the concentration range of 50 µg ml-1 to 150 µg ml-1. The linear regression equation was y =37.771X - 413.07. The developed method was employed with a high degree of precision and accuracy for the analysis of ethotrexate. The developed method was validated for accuracy, precision, robustness, detection and quantification limits in accordance with as per the ICH guidelines. The wide linearity range, accuracy, sensitivity, short retention time and composition of the mobile phase indicated that this method is better for the quantification of methotrexate.
Keywords: Methotrexate, HPLC, Validation.
_____________________________________________________________________________________________
INTRODUCTION
A survey of the literature revealed that different analytical techniques for the assay of MTX have been reported. HPLC with fluorimetric1-13 and UV14-19 detection methods have been reported. Using the former methods, the derivatization reactions include; photo-oxidative irradiation at 254 nm in the presence of hydrogen peroxide to yield 2,4-diaminopteridine-6-carboxylic acid6,11-13, oxidation with permanganate in presence of acetate buffer (pH- 4) to give 2-amino-4-hydroxypteridine-6-carboxylic acid10 , and oxidative cleavage using either phosphate buffer containing 0.2 of 30% hydrogen peroxide4,8&9 or pre-column of cerium (IV) trihydroxyhydroperoxide5,7 to get 2,4-diaminopteridine-6-carboxylic acid. The latter reaction has been applied in flow injection technique20.
Early analysis of methotrexate in Human plasma by HPLC with fluorescence detection45 , HPLC determination of methotrexate polyglutamates after Low-Dose methotrexate therapy in patients with Rheumatoid arthritis31,Quality control of methotrexate by HPLC46 and Polarographic and voltammetric methods26-29 for the quantitation of MTX in pharmaceuticals and plasma samples have been published.
The HPLC method described here is simple, sensitive and reproducible for methotrexate determination in formulations with low background interference. An attempt has been made to develop and validate to ensure their accuracy, precision and other analytical method validation parameters as mentioned in various gradients. One method reported for the HPLC determination for developed based on the use of a C-18column with a suitable mobile phase, without the use of any internal standard. For pharmaceutical formulation the proposed method is suitable for their analysis with virtually no interference of the usual additives presented in pharmaceutical formulations
EXPERIMENTAL SECTION
1. Instrumentation
HPLC Analytical column Chromolith RP-C18, 100 mm x 10 µ (C-098&C-099) Chromatographic conditions for Methotrexate.
Stationary phase Mobile phase Flow rate
(ml min-1) Run time (min)
Column Temp
(0c)
Volume of injection loop
(µl)
Detection wavelength
(nm)
Retention time (min)
C18, 100mm x 6mm x 5µ Buffer, and Acetonitrile
92:8 1.4 10 25 20 303 4.517
2. ANALYTICAL METHODOLOGY 1. Preparation of mobile phase
For isocratic system a mixture of buffer and acetonitrile in the proportion 92:8 respectively was prepared. The PH of the mixture (mobile phase) was adjusted pH to 6.0 ± 0.05 with sodium hydroxide pellets. Then it was filtered through 0.2 µ nylon membrane filter paper and degas prior to use.
2. Preparation of Buffer
Buffer solution was prepared by dissolving accurately weighed 27.22 g of Potassium dihydrogen orthophosphatein distilled water in 1000 ml volumetric flask and made up to mark with distilled water.
3. Chromatographic conditions
Separation was performed on C -18, 100mm x 6mm x 5µ column. dimethyle sulfoxide used as a diluent and mobile phase consists of mixture of buffer, and acetonitrile in the proportion92:8. Injection volume of 20 µl was used. Mobile phase was filtered before use through 0.5 µm Nylon membrane filter paper and degassed with helium purge for 10 min. The components of the mobile phase were pumped from solvent reservoir to the column at flow rate 1.4 ml min-1 and wavelength was set to 303 nm. The column temperature was set at 25oC.
4. Preparation of methotrexate standard solution: (pure sample)
Weighed accurately about 100 mg of methotrexate working standard and transferred to a 100 ml volumetric flack. 10 ml of diluents was added and sonicated to dissolve. volume of solution was made up to the mark with diluents. i.e. 1000 µg ml-1 (Stock solution A)
From the above stock solution A 10 ml of solution was pipette out into 100 ml volumetric flask and the volume was made up to the mark with dimethyle sulfoxide to obtain the final concentration of 100 µg ml-1 (Stock solution B). From the stock solution B ranging from 5-15 ml were transferred into a series of 10 ml volumetric flasks to provide final concentration range of 50-150 µg ml-1 and each flask made up to the mark with diluents.
5. Preparation of test solution :( formulation)
another 10 ml volumetric flask and made up the volume with diluents. The solution was filtered through 0.45 µm Nylon membrane filter paper. (50-150 µg ml-1).
6. Assay procedure:
The column was equilibrated for at least 30 minutes with mobile phase flowing through the system with a flow rate of 1.0 ml min-1. Detector was set at a wavelength of 254 nm. Five sets of the drug solutions were prepared in diluents containing methotrexate at a concentration range of 50 - 150 µg ml-1. Then 20 µl of each standard and sample solution was injected for five times separately. The retention time for methotrexate was found to be 4.517 min (Fig – 1.1). The peak areas of the Drug concentrations were calculated. The regression of the drug concentration over the amount of drug in formulation was evaluated.
7. System suitability solution:
Use methotrexate standard working solution as system suitability solution.
8. Procedure:
Equal volumes of blank the replicate injections of systems suitability solution i.e methotrexate standard working solution were injected separately. Then two injections of test solution were injected and chromatograms were recorded. .percentage of RSD of five replicate injections of system suitability solution ( methotrexate standard working solution) was calculated.
Figure -1.2: Linearity of methotrexate standard
.
[image:4.595.209.403.282.452.2]RESULTS AND DISCUSSION
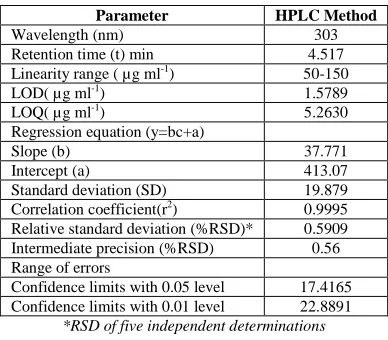
Table -1.1: Performance calculations, detection characteristics precision and accuracy of the proposed method for methotrexate
Parameter HPLC Method
Wavelength (nm) 303 Retention time (t) min 4.517 Linearity range ( µg ml-1) 50-150 LOD( µg ml-1) 1.5789 LOQ( µg ml-1) 5.2630 Regression equation (y=bc+a)
Slope (b) 37.771
Intercept (a) 413.07 Standard deviation (SD) 19.879 Correlation coefficient(r2) 0.9995 Relative standard deviation (%RSD)* 0.5909 Intermediate precision (%RSD) 0.56 Range of errors
Confidence limits with 0.05 level 17.4165 Confidence limits with 0.01 level 22.8891
[image:4.595.144.468.476.537.2]*RSD of five independent determinations
Table – 1.2: System suitability – Selectivity
Sr. No. Area of methotrexate Tailing factor Theoretical plates
1 4710.67
1.11 4231
2 4602.76
Mean 4656.72
Standard Deviation (±) 76.30 (%) Relative standard deviation 1.64
Table-13: System suitability - linearity of standard
Sr. No. Area of methotrexate Tailing factor Theoretical plates
1 3205.65
1.17 4052
2 3307.93
3 3274.33
4 3284.61
5 3345.25
Mean 3283.55
Standard deviation (±) 51.37 (%) Relative standard deviation 1.56
Table 1.4: Results of linearity of standard
Linearity Level
Sample concentration
-1
Average area (n = 2)
Correlation coefficient
0 1000 2000 3000 4000 5000 6000
0 20 40 60 80 100 120 140 160
A r
e a
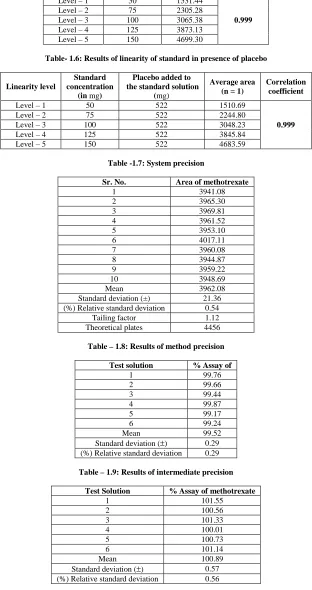
Table 1.5: Results of linearity of sample
Linearity level
Sample concentration
(in µg ml-1)
Average area (n = 2)
Correlation coefficient
Level – 1 50 1531.44
0.999
[image:5.595.150.462.123.713.2]Level – 2 75 2305.28 Level – 3 100 3065.38 Level – 4 125 3873.13 Level – 5 150 4699.30
Table- 1.6: Results of linearity of standard in presence of placebo
Linearity level
Standard concentration
(in mg)
Placebo added to the standard solution
(mg)
Average area (n = 1)
Correlation coefficient
Level – 1 50 522 1510.69
0.999
Level – 2 75 522 2244.80 Level – 3 100 522 3048.23 Level – 4 125 522 3845.84 Level – 5 150 522 4683.59
Table -1.7: System precision
Sr. No. Area of methotrexate
1 3941.08
2 3965.30
3 3969.81
4 3961.52
5 3953.10
6 4017.11
7 3960.08
8 3944.87
9 3959.22
10 3948.69
Mean 3962.08
Standard deviation (±) 21.36 (%) Relative standard deviation 0.54
Tailing factor 1.12 Theoretical plates 4456
Table – 1.8: Results of method precision
Test solution % Assay of
1 99.76
2 99.66
3 99.44
4 99.87
5 99.17
6 99.24
Mean 99.52
Standard deviation (±) 0.29 (%) Relative standard deviation 0.29
Table – 1.9: Results of intermediate precision
Test Solution % Assay of methotrexate
1 101.55
2 100.56
3 101.33
4 100.01
5 100.73
6 101.14
Mean 100.89
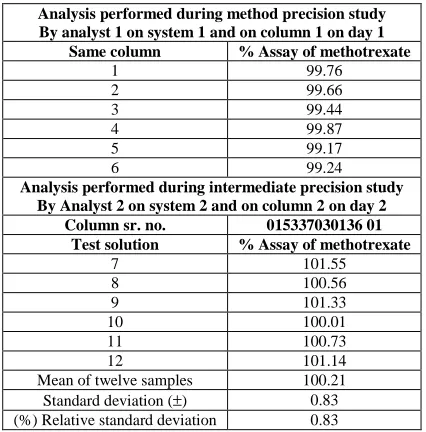
Table –1.10: Results of twelve test solutions of methotrexate in FOLITRAX - 5
(Six of method precision & six of intermediate precision)
Analysis performed during method precision study By analyst 1 on system 1 and on column 1 on day 1
Same column % Assay of methotrexate
1 99.76
2 99.66
3 99.44
4 99.87
5 99.17
6 99.24
Analysis performed during intermediate precision study By Analyst 2 on system 2 and on column 2 on day 2
Column sr. no. 015337030136 01
Test solution % Assay of methotrexate
7 101.55
8 100.56
9 101.33
10 100.01
11 100.73
12 101.14
Mean of twelve samples 100.21 Standard deviation (±) 0.83 (%) Relative standard deviation 0.83
Table-1`.11: Determination of accuracy of methotrexate
Amount of MET in formulation (mg)
Amount of Standard MET added (mg)
Total amount found
(mg) % Recovery
[image:6.595.207.407.473.523.2]99.98 99.97 99.99 100 100 100 199.96 199.94 199.98 99.97 99.96 99.98 99.99 99.94 99.89 150 150 150 249.97 249.85 247.22 99.98 99.93 98.87 99.99 99.88 99.57 200 200 200 299.91 299.64 298.71 99.96 99.87 99.56
Table-1.12: Statistical data for accuracy determination
Total amount found
(mean) Standard deviation
% RSD
199.96 0.02 0.0100 249.03 1.5542 0.6241 299.42 0.6295 0.2102 The results are the mean of five readings at each level of recovered
Table – 1.13: Results for Change in Column Lot
Flow rate → Same column Diff column
Sample % Assay
Test solution 100.44 100.35 Average assay result from method precision 99.52 99.52
Mean 99.98 99.94
Standard deviation (±) 0.65 0.59 (%) Relative standard deviation 0.65 0.59
Table – 1.14: Results for change in flow rate
Flow rate → 1.2mL/minute 1.6 mL/minute
Sample % Assay
Test solution 100.94 99.79
Average assay result from method precision 99.52 99.52
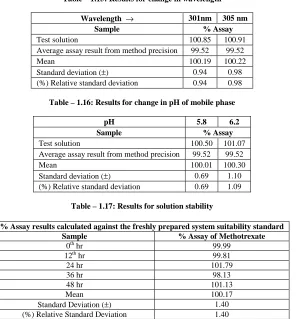
Table – 1.15: Results for change in wavelength
Wavelength → 301nm 305 nm
Sample % Assay
Test solution 100.85 100.91 Average assay result from method precision 99.52 99.52
Mean 100.19 100.22
[image:7.595.194.419.90.165.2]Standard deviation (±) 0.94 0.98 (%) Relative standard deviation 0.94 0.98
Table – 1.16: Results for change in pH of mobile phase
pH 5.8 6.2
Sample % Assay
Test solution 100.50 101.07 Average assay result from method precision 99.52 99.52
Mean 100.01 100.30
Standard deviation (±) 0.69 1.10 (%) Relative standard deviation 0.69 1.09
Table – 1.17: Results for solution stability
The appropriate wavelength in UV- visible region has been selected for the measuring of active ingredient in the proposed method. This method was validated by linear fit curve and all the parameters were calculated.
1. Parameters fixation
In developing methods, systematic study of the effects of various parameters was undertaken by varying one parameter at a time controlling all other parameters. The following studies were conducted for this purpose.
2. Mobile phase characteristics
In order to get sharp peaks and baseline separation of the components, carried out number of experiments were conducted by varying different components like percentage of organic phase in the mobile phase, total pH of the selected mobile phase and flow rate by changing one at a time and keeping all other parameters constant. The optimum conditions obtained were included in the procedure proposed.
3. Detection characteristics
To test whether methotrexate had been linearly eluted from the column, different amounts of methotrexate were taken and analyzed by the above mentioned procedures. The peak area ratios of component areas were calculated and the values are graphically represented in Fig1.1. The linear fit of the system was illustrated graphically. Least square regression analysis for the method was carried out for the slope, Intercepts and correlation coefficient were calculated. The results were presented in Table -1.1.
4. Performance calculations
To ascertain the system suitability for the proposed method, a number of statistical values have been calculated with the observed readings and the results were recorded in Table-1.1.
5. Method validations
The UV absorption maximum for methotrexate was fixed at 254. As the final detection was made by the UV - absorption spectrum, each method was validated by linear fit curve.
6. Precision
The precision of the method was ascertained separately from the peak area ratios obtained by actual determination of a fixed amount of drug. The percent of relative standard deviation calculated for methotrexate and are presented in
% Assay results calculated against the freshly prepared system suitability standard
Sample % Assay of Methotrexate
0th hr 99.99
12th hr 99.81
24 hr 101.79
36 hr 98.13
48 hr 101.13
Mean 100.17
Tables1.7, 1.8, 1.9, 1.10. The precision of the assays was also determined in terms of intra and inter-day variation in the peak areas for a set of Drug solution was calculated in terms of coefficient of variation (CV)
7. Accuracy
To determine the accuracy of the proposed methods, different technical grade samples of methotrexate within the linearity limits were taken and analyzed by the proposed methods. The results (percent error) were recorded in Table-1.11.
8. Interference studies
The effect of wide range of excipients and other additives usually present in the formulations of methotrexate in the determinations under optimum conditions were investigated. The common excipients such as colloidal silicon dioxide, ethyl cellulose, hydroxyl propyl methyl cellulose, magnesium state, microcrystalline cellulose provide have been added to the sample solutions and injected. They have not disturbed the elution or quantification of drug. In fact many have no absorption at this λmax
9. Analysis of Formulation
To find out the stability of the proposed methods for the assay of formulations containing methotrexate was analyzed by the proposed and reference methods. The proposed method does not differ significantly in precision and accuracy from reference method. The results were recorded in Table-1.12.
10. Ruggedness and Robustness
Ruggedness of the proposed method was determined by carrying out the analysis by two different analysts using similar operational i.e. Robustness with Change in Column Lot, change in flow rate, change in wavelength and change in pH of the Mobile phase . The results were indicated by % CV in Tables – 1.13, 1.14, 1.15, 1.6. Robustness of the method was determined by carrying out the analysis at two different wavelengths i.e. at 252 nm and 256 nm and the results were indicated by % CV in Table -1.15.
11. Recovery Studies
Recovery studies were conducted by analyzing each formulation in the first instance for the active ingredient by the proposed methods known amounts of pure Drug was then added to each of the previously analyzed formulations and the total amount of the Drug was once again determined by the proposed methods after bringing the active ingredient concentration within the linearity limits. The results were recorded in Table -1.12.
12. Solution stability
The stability of the solutions under study was established by keeping the solution at room temperature for 48 Hours. The results indicate no significant change in assay values indicating stability of Drug in the solvent used during analysis. The results are recorded in Table -1.17.
CONCLUSION
The method was found to be accurate and precise, as indicated by recovery studies close to 100 and % RSD is not more than 2. The summery of validation parameters of proposed HPLC method is given in tables.
The simple, accurate and precise HPLC method for the determination of methotrexate as bulk and in tablet dosage form has been developed. The method may be recommended for routine and quality control analysis of the investigated drug in bulk and pharmaceutical formulations. The analytical solution is found to be stable up to 48 Hrs at room temperature. Hence, it is concluded that the analytical method is validated and can be used for routine analysis and for stability study.
REFERENCES
[1].K.Foulmann, J.P. Guastalla, N. Caminet, V. Trillet-Lenoir, D. Raudrant, F. Golfier, A.M. Schott, Gynecologic Oncology , 2006, 103–110.
[9]. L.M.Kaminskas, B.D. Kelly, V.M. McLeod, G. Sberna, B.J. Boyd, D.J. Owen,C.J.H.Porter, Molecular Pharmaceutics 2010, 338–349.
[10].L.Ouyang, L.F. Ma, B. Jiang,Y.H. Li, D.S. He, L.Guo, J. Medicinal Chemistry , 2010, 2705–2711.
[11].L.M. Kaminskas, B.D. Kelly, V.M. McLeod, B.J. Boyd, G.Y. Krippner, E.D. Williams, C.J.H. Porter, Molecular Pharmaceutics, 2009, 1190–1204.
[12].R.S.Dhanikula, A. Argaw, J.F. Bouchard, P. Molecular Pharmaceutics , 2008, 105–116.
[13].Y.Wang, X. Yang, J. Yang, Y. Wang, R. Chen, J. Wu, Y. Liu, N. Zhang, Molecular Pharmaceutics , 2011, 1665–1670.
[14].M.R.Saboktakin, R.M.Tabatabaie, A.Maharramov, M.A.Ramazanov, International BiologicalMacromolecules , 2011, 747–751.
[15].Y.H.Chen, C.Y. Tsai, P.Y. Huang, M.Y. Chang, P.C. Cheng, C.H. Chou, D.H. Chen, C.R.Wang,A.L. Shiau,C.L.Wu, Molecular Pharmaceutics , 2007, 713–722.