Journal of Chemical and Pharmaceutical Research, 2014, 6(7):521-529
Research Article
CODEN(USA) : JCPRC5
ISSN : 0975-7384
Automatic simulated computation of remote sensing information
model based on semantic
Shengtao Sun*
1and Aizhi Wu
21
The Key Laboratory for Computer Virtual Technology and System Integration of Hebei Province, School of Information Science and Engineering, Yanshan University, Qinhuangdao, China
2College of Vehicles and Energy, Yanshan University, Qinhuangdao, China
_____________________________________________________________________________________________
ABSTRACT
This paper discusses the simulated computation methods of remote sensing information model, and tries to put forward a more available solution. It presents our research works on the description and simulation methods of remote sensing information model: the service on demand method provides a basic methodology of model analysis, the semantic relationship description of information processing procedure supports the basic knowledge of resource selection and matching based on user’s demand, and the hierarchical mapping method of remote sensing information model shows the transformation from abstract model to executable data processing workflow.
Key words: Remote sensing information model; simulated computation; service on demand; hierarchical mapping
method
_____________________________________________________________________________________________
INTRODUCTION
More and more users are involved in the application system based on spatial information. Traditional GIS (Geographical Information System) can just solve the problem of spatial data management, processing and analysis, and most spatial data can’t be used directly in reality application [1], while remote sensing information model based on science analysis can bridge the gap between spatial data and spatial information application [2]. It is difficult for non-professional users to design and implement the workflow of remote sensing data processing. Therefore, there should be some mechanisms to help users to organize the workflow and apply spatial data to certain application automatically or semi-automatically. Many researchers have made explorations in this field, but there are still some obstacles remaining unsolved: (1)The heterogeneity makes it difficult to provide uniform description schema or mode of remote sensing information models. (2)The organization and simulated computation process of remote sensing information model lack the assistance of domain knowledge. (3)The requirement and intention of different applications are diverse and need distinct spatial data and processing procedure (service on demand).
The main purpose of our work is to try to realize the formal description and automatic simulated computation of remote sensing information model. This paper aims at the study and solution of automatic simulation and computation of remote sensing information model. The main contributions of this paper include: (1)A description mechanism of remote sensing information model is proposed based on informatics, which can organize data processing flow around user’s demand. (2)Semantic linkage is used to describe the relationship among user’s demand and data processing operations, guide the transformation process from spatial data to remote sensing application. (3)A hierarchical mapping method of the simulation of remote sensing information model is proposed, which can help to design and organize the spatial data processing workflow.
are shown in Section 3. A hierarchical mapping method of remote sensing information model is presented in Section 4. An application example of this method is shown in Section 5. And Section 6 concludes the works.
THE ANALYSIS METHODS OF REMOTE SENSING INFORMATION MODELS
Remote sensing data is the reflection of ground object and has relative mathematic and geographical links. Remote sensing information model presents the relations between spectrum signature and physical characteristics [3]. Based on quantitative remote sensing model, ground object feature can be obtained from remote sensing images. Remote sensing information model is the bridge between remote sensing data and spatial information. But there are some kinds of heterogeneity in remote sensing information models, which make it difficult to simulate and compute these models automatically. These heterogeneities mainly include: variant input data types, different data processing procedures, unlike application requirements and distinct data pre-processings, which make it difficult to give uniform description and management method. There are several modeling methods proposed to solve this problem as below.
A. Program Development Method
[image:2.595.98.506.313.346.2]This is the traditional method of software engineering in computer science field. This method regards remote sensing information model as a series of equations and formula [4], and does not care the physical meaning. The purpose of this method is to transform these equations to executable algorithm programs and realize high efficient and speedy computing process [5]. This method is the most primitive method of remote sensing information model processing, and the main work is algorithm design and optimization as show in Fig.1.
Fig. 1: Problem solution flow of program development method
This method is task oriented. User needs to compile and execute program for certain application, and there are many repeated works of similar tasks. The adaptability and portability of this method are limited, and this method is mainly adopted in the development of small system for specific purpose.
B. Function Assembly Method
[image:2.595.89.514.501.532.2]This method regards the spatial data processing as the collection of functions. The purpose of this method is to disassemble complex data processing procedure to function modules based on the idea of functional decomposition [6]. This method transforms problem space to functional structure of system and pays attention to the solution of function packing and assembly [7], but regards information as the element which depends on and is enslaved to the functions as show in Fig. 2.
Fig. 2: Problem solution flow of function assembly method
This method is function oriented, and user needs to design and build function modules for different demands. But the function and data processing method need to be modified with the change of user requirements, and there are many match problems of module interface and interact.
C. Object Oriented Method
This kind of method comes from object-oriented technology in information system engineering [8]. This method uses Class which includes property and action of object as basic unit to build model, and pays attention to the representation of inner structure of object and relations among objects [9]. This method transforms things of real world to objects of model world, and makes this model reflect the intrinsic existence structure but not extrinsic function structure [10]. The purpose of this method is to use stable object as basic unit to construct application oriented model as show in Fig. 3.
Fig. 3: Problem solution flow of object oriented method Remote sensing information model Object model with objects and
relations
Object dynamic construction and links
Remote sensing information model
Physical model with parameter inversion equations
Computation model with algorithm programs
Remote sensing information model
Physical model with parameter inversion equations
[image:2.595.124.499.698.730.2]This model is object oriented. User needs to abstract things of real world to objects of model world, and describe properties and actions of these objects. This method also makes data and information packed in abstract unit, and only cares the relationship among objects but not information.
D. Service on Demand Method
These spatial data processing methods above are all regard data and information as processing object and element, which ignore the guiding role of information and its linkage. In the procedure of spatial data processing based on remote sensing information model, information is more stable than program, function and object, which could be modified with different processing tasks and application purposes. Information should be the core and mainline of every step, and the information as data processing results can represent user’s requirement and demand.
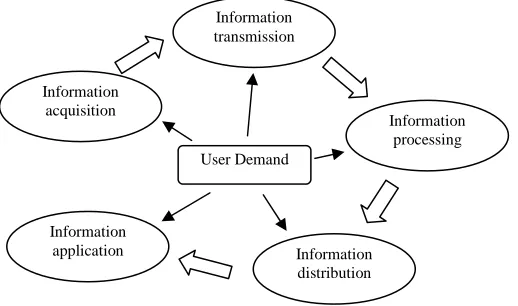
Informatics is the science of information [11]. It can be thought of as “studying how to design a system that delivers the right information, to the right person in the right place and time, in the right way”, and is intimately tied to workflow discussions and standards [12]. Based on informatics, information processing procedure can be divided into five steps no matter what kind and application purpose of data processing models as show in Fig. 4.
Information acquisition step realizes the data query on demand and gets the location address of these spatial data. This segment focuses on the retrieval of all kinds of spatial data which can satisfy user’s requirement.
[image:3.595.179.438.327.480.2]Information transmission step realizes the data transportation from data resource to data processing space. This segment pays attention to the acquirement of these spatial data which can satisfy user’s requirement.
Fig. 4: Problem solution flow of service on demand method
Information processing step realizes data processing including pre-processing, feature extraction, parameter inversion, information presentation and data product output. This segment attaches importance on the design and construction of algorithm and workflow which can satisfy user’s requirement.
Information distribution step realizes the data processing results transfer from data processing space to data application place. This segment realizes the transmission of data product to user.
Information application step realizes application information in data product rendering and display. This segment completes the presentation of spatial information to end user.
User’s demand can reflect what spatial information user needs from spatial data, and the simulation and computation of remote sensing information model are all around the centre of information and demand. The remote sensing information model should be divided into five parts based on information demand. That is to say, a remote sensing information model should be described in five aspects: Which kind of data does it need? How to get these data? What data pre-processing and operation does it need? Where to apply the information? How to display this information to user?
Based on service on demand method, remote sensing information model description schema should include five main sections: the description of required data, the description of data access method, the description of data processing, the description of data product, and the description of information application. This schema can make variant remote sensing information models decomposed into five interconnection parts. Every part must satisfy user’s demand, and there are corresponding relations among sequential parts. Therefore, this kind of model description method can provide complete, consecutive, and clear data processing flow.
Information acquisition
Information transmission
Information processing
Information distribution Information
application
THE SEMANTIC DESCRIPTION OF REMOTE SENSING INFORMATION PROCESSING PROCEDURE
[image:4.595.135.483.158.238.2]In order to simulate and compute remote sensing information model automatically, basic domain knowledge of the relationship between user’s demand and information model is necessary [13]. Hierarchical spatial information ontology has been designed and built [14], which can be used to describe variant spatial information resources. We have used semantic ontology to describe this knowledge and realize semantic match based on demand of every data processing segment. These semantic relations can be roughly described in semantic linkages, as shown in Fig. 5 to Fig. 9.
Fig. 5: Information acquisition based on spatial data demand
[image:4.595.154.458.311.415.2]Information acquisition obtains the description of spatial data demand and describes the relations between data query requirements and data resources.
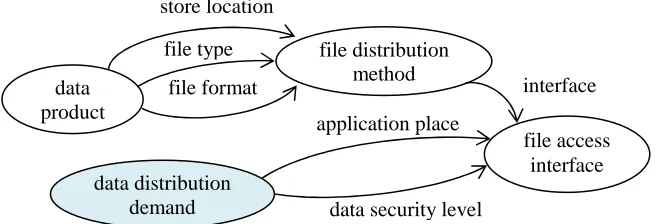
Fig. 6: Information transmission based on data access demand
Information transmission stage cares the description of data access demand and expresses the relations between data resources and data access interfaces.
Fig. 7: Information processing based on data processing demand
Fig. 8: Information distribution based on data distribution demand data
product
file distribution method
data distribution demand
store location
file type
file format interface
application place
data security level
file access interface data access
interface
data processing algorithm data
processing demand
pre-process
feature extraction
parameter inversion
data format
spatial data service chain
interface type
data processing workflow
execution result
data product data resource
data transfer method
data access demand location
service type
access mode interface
payment
communication protocol data access
interface spatial data
demand
sensor data
resource spectrum band
spatial resolution
temporal resolution
data format
data type
[image:4.595.105.510.487.610.2] [image:4.595.143.474.637.749.2]Information processing stage focuses on the description of data processing demand and realizes the transformation from source data to product.
[image:5.595.96.515.145.281.2]Information distribution completes the description of data distribution demand and shows the relations between data product and file access interfaces.
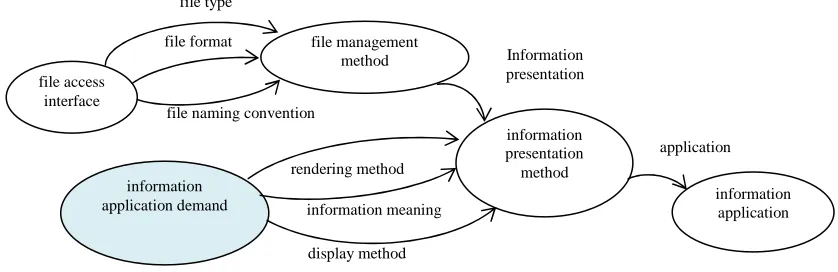
Fig. 9: Information application based on information application demand
Information application faces the description of information application demand and implements the transfer between file access interfaces and information applications.
This section describes the relationships among these information processing stages based on user’s demand. These relations can represent the simulated computation procedure of remote sensing information model, and this knowledge can guide the transformation process from data to application.
THE HIERARCHICAL MAPPING METHOD OF REMOTE SENSING INFORMATION MODEL
The procedure from remote sensing information model to simulation and computation workflow need to transform from abstract model to executable workflow, which includes several different layers of mapping. This section presents the hierarchical mapping method of remote sensing information model based on service on demand method mentioned above.
The hierarchical mapping procedure of remote sensing information model from model to workflow can be divided into three layers, shown as Fig. 10.
(1)The first layer is informatics view, which regards remote sensing information model as the sequence procedure of information acquisition, transmission, processing, distribution and application, and pays attention to the description of different information operations based on user’s demand. In this layer, we can get a rough view of this model and get to know the requirements of data and application around user’s demand.
(2)The second layer is resource view, which focuses on the selection and matching of different resources to satisfy the requirement of information operations in the first layer. That is to say, an information operation in the first layer can map with several matched resources in the second layer. And also, these matched resources can be chosen again based on user’s demand. In this layer, we can obtain a concrete view of resource linkages corresponding to the model.
(3)The third layer is service view, which pays attention to the usage and access of different services related to the resources in the second layer and also the data operations in the first layer. In other words, a resource in the second layer can connect with several service operation interfaces in the third layer, and these interfaces of services can satisfy the requirement of data processing in the first layer. And also, these service interfaces must meet user’s demand in every aspect. From this layer, we can gain a detailed view of data service chains, and the final workflow is the specific description of these service chains which are computable and executable.
file access interface
file management method
information application demand
file type
file format
file naming convention
Information presentation
rendering method
information meaning
information presentation method
display method
Fig. 10: Hierarchical mapping of remote sensing information model
In every layer, the selection and matching of different entities all follow the semantic relationships mentioned in Section 3, which is the representation of domain knowledge. After the mapping procedure layer-by-layer, we can transform abstract model to executable workflow of remote sensing information model, and every data operation in processing sequence can match the following operation in each layer from different views. This hierarchical mapping method of remote sensing information model can decompose complex simulation process into several related layers, from model, informatics, resource, service to workflow.
THE APPLICATION EXAMPLE OF THE HIERARCHICAL MAPPING METHOD
This section will show an example of this hierarchical mapping method of vegetation drought monitoring model. This model adopts Normal Differential Water Index (NDWI) [15] to detect drought situation based on the theory that drought vegetation reflects less near-infrared sunlight than normal.
This model uses the data of SWIR (short wave infrared) to inverse vegetation moisture and finally generates thematic map of vegetation drought distribution. The formulae of NDWI are shown as below:
NDWI=(ρ2-ρ6)/(ρ2+ρ6) (1)
AWI=NDWIi -NDWI
___________
(2)
Hereinto, ρ2 and ρ6 are the data from MODIS (MOD09A1 data product) band-2 and band-6 respectively, NDWIi is a
NDWI value in certain period, andNDWIis the average value of this period. And other improved computation formulae as [16,17]:
MNDWI= (BGreen – BSWIR ) / (BGreen +BSWIR ) (3)
NDWI = (BNIR – BSWIR ) / (BNIR +BSWIR ) (4)
These formulae can obtain water character under different considerations, and need to use corresponding remote sensing data. Based on the method mentioned in this paper, the data processing of remote sensing model can be
Info-acqu
Info-trans
Info-proc
Info-dist Demand
Info-app
Data resources
Networks
Computing resources
Networks Displays
Demand
Data service interfaces
Transfer Protocol interfaces
Data processing interfaces
Distribution protocol interfaces Display service
interfaces
Demand
+
-
Abstraction
Informatics View
Resource View
executed according to different requirements and factors, in order to obtain information results and thematic maps for specific applications.
Based on the hierarchical mapping method in this paper, we can explain the description and simulation process of this remote sensing information model as below.
A. The informatics view of example model
[image:7.595.75.540.187.228.2]In step of information acquisition, this model bases on MOD09A1 data product and query data based on conditions of spatial position and temporal duration as show in Fig. 11.
Fig. 11: Information processing flow of vegetation drought monitoring model
In step of information transmission, this model needs to transfer MODIS data from data resource to data processing node in Grid. In step of information processing, this model requires computation function of drought index inversion, file format transformation from HDF to GeoTiff, and mosaic of result GeoTiff files. In step of information distribution, this model needs to transfer result file from data processing node to drawing node in Grid. In step of information application, this model uses drawing node to generate thematic map of vegetation drought distribution based on AWI values in GeoTiff files.
B. The resource view of example model
[image:7.595.132.488.385.421.2]Users need a data query portal to obtain the MOD09A1 data URL linkage based on required spatial range and temporal duration as show in Fig. 12.
Fig. 12: The resource linkage of this vegetation drought monitoring model
The data should be transferred to data processing node via FTP protocol based on the URL address. Data processing node has to provide algorithms or tools for AWI computation (shown as equation 1 and 2), file format transform Hdf2Tiff, and GeoTiff file mosaic.
The result files ought to be transferred from data processing node to drawing node via FTPS protocol. Users need to browse or download the result thematic map through the URL address via HTTPS protocol.
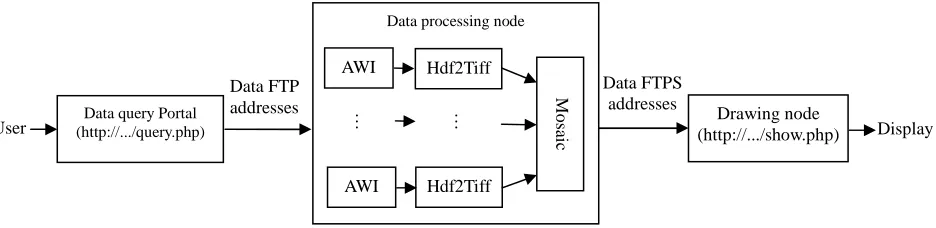
C. The service view of example model
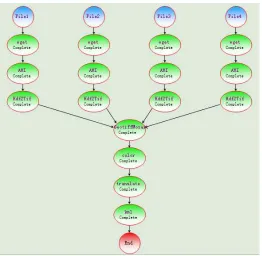
The data query portal address of MOD09A1 is http://202.168.1.6/MOD09A1/query.php, and the query results can be obtained through the address of http://202.168.1.6/MOD09A1/ obtain.php?id= filename, as shown in Fig. 13.
Fig. 13: The service chain of this vegetation drought monitoring model
Data processing node can use a FTP tool or “wget” command to download these files to its local file system based on FTP address.
Data processing node startups several data processes (execute AWI calculation, format conversion and mosaic
Data query Portal (http://.../query.php)
Data processing node
Drawing node (http://.../show.php)
…
Data FTP addresses User
AWI AWI
Hdf2Tiff Hdf2Tiff
Data FTPS addresses
… Mo
sa
ic Display
Data query Portal
Data processing node
Drawing node
FTP FTPS
User MOD09A1
data query
MODIS Data transformation
Data processing (index inversion, format
conversion, mosaic)
Thematic map display GeoTiff file
[image:7.595.79.547.574.688.2]programs) based on the number of files, and the parameters include: input filename, output filename, adjustment factor, etc..
Data processing results are transferred to drawing node, and this node makes these GeoTiff files shaded and colored based on the values of AWI which indicates the degree of vegetation drought.
Finally, users can see the thematic maps on the screen or print them out based on the data product URL address.
We have applied this hierarchical description method of remote sensing information model in the Large Scale Grid Simulating Computation System and realized the simulation and computation of several remote sensing models semi-automatically. The execution of data processing workflow is able to implement the data operations and executions corresponding to user’s demand, and return results (data products which indicate some meaningful information) to user. Fig. 14 is the data query portal, and Fig. 15 is the monitoring page of workflow.
[image:8.595.157.459.279.443.2]By now, this system can only generate workflow semi-automatically based on workflow schemas of each model, and these schemas are designed by manual based on the service chain description from this hierarchical mapping method of remote sensing information model. But we can initiatively see the assistant role of this method to the simulation computation of remote sensing model.
Fig. 14: Data query page of this vegetation drought monitoring model
[image:8.595.177.439.478.734.2]CONCLUSION
This paper proposes a service on demand method based on informatics to analyze the information processing procedure of remote sensing information model. Based on the knowledge of resource selection and matching with user’s demand, the hierarchical mapping method can decompose the process of model simulation into related several layers, which can make the model externalized gradually layer-by-layer and finally obtain the executable workflow. This method has been used in a practical system, and taken effect initiatively as expected. But the flexibility and degree of automation of this method need to be improved in further works.
Acknowledgments
The authors wish to thank Guoqing Li, Lizhe Wang, Wenyang Yu from Center of Earth Observation and Digital Earth in Chinese Academy of Sciences. The work in this paper is supported by the National Natural Science Foundation of China under Grant No. 61303130, the Natural Science Foundation of Hebei Province under Grant No. F2014203093 and the Doctoral Foundation of Yanshan University (No. B718).
REFERENCES
[1]Michael F. Goodchild. Journal of Spatial Information Science, v.1, n.1, p.3-20, August 2010. [2]Lingjia Gu, Ruizhi Ren, Shuang Zhang. Journal of Software, v.6, n.7, p.1289-1296, July 2011. [3]Gang Li, Jinliang An, Chunhua Chen. Journal of Computers, v.6, n.11, p.2417-2426, November 2011. [4]Colin Thomas, Xavier Briottet, Richard Santer. Applied Optics, v.50, n.28, p.5408-5421, October 2011.
[5]Amol D Vibhute, Bharti W Gawali. International Journal of Engineering Research and Applications, v.3, n.3, p.81-91, May-June 2013.
[6]Kudryavtsev D, Grigoriev L. IEEE 13th Conference on Commerce and Enterprise Computing (CEC), Luxemborg, p.310-317, 2011.
[7]Lei Zheng, Yong Xue, Ying Luo. Journal of Control & Automation, v.24, n.16, p.259-261, August 2008. [8]Qian Zhang, Yong-Fei Zhang, Shi-Yin Qin. Journal of Computers, v.4, n.4, p.295-302, April 2009. [9]J Ima, J R. Jensena. International Journal of Remote Sensing, v.29, n.2, p.399-423, April 2008. [10]Andrea Baraldi, Luigi Boschetti. Remote Sensing, v.4, n.9, p.2768-2817, September 2012. [11]D. S. Boyd, G. M. Foody. Ecological Informatics, v.6, n.1, p.25–36, January 2011.
[12]Fusheng Wang, Jun Kong, Lee Cooper. Journal of Pathology Informatics, v.2, n.32, p.22-32, July 2011.
[13]Ogiela L. Proceeding of Fifth International Conference on Innovative Mobile and Internet Services in Ubiquitous
Computing (IMIS), Seoul, South Korea, p.182-185, June 2011.
[14]Shengtao Sun, Dingsheng Liu, Guoqing Li. International Journal of Software Engineering and Knowledge
Engineering, v.22, n.4, p.571-593, June 2012.
[15]A. W. Knight, D. R. Tindall, B. A. Wilson. International journal of remote sensing, v.30, n.13, p.3365-3392, January 2009.
[16]Qinhuo Liu, Xiaozhou Xin, Ping Tang. Quantitative remote sensing model application and uncertainty study, Science Press, Beijing, p.121-130, 2010.