2017 International Conference on Computer Science and Application Engineering (CSAE 2017) ISBN: 978-1-60595-505-6
Brain MR Segmentation using a Fusion of K-Means and Spatial Fuzzy C-Means
Oluwasanmi Ariyo*, Qin Zhi-guang and Lan Tian
School of Information and Software Engineering, University of Electronic Science and Technology of China, 611731 Chengdu, China
ABSTRACT
This study presents an automatic segmentation of the brain tissues in Magnetic Resonance Image using a fusion of Spatial Fuzzy C-Means (sFCM) and K-Means Algorithms (sFCMKA). The segmentation of the standard FCM algorithm have been realized to be highly sensitive to noise and therefore fail in providing accurate results. The K-Means algorithm while having the advantage of simplified clustering results is disadvantaged for merely classifying pixels into just one cluster segment. In overcoming this problem, first, FCM algorithm incorporated with a spatial neighborhood function is presented to eliminate the effect of noise. Also, the K-Means algorithm is embedded to sort pixels in tissues which are not intertwined with another. Since they are non-overlapping tissues, such pixels are grouped in a singular cluster without having membership to another cluster segment. sFCMKA achieves this by placing a threshold parameter on pixels having contrasting cluster result from both algorithms and then reprocessed. The efficiency of the proposed algorithm is demonstrated by evaluating the results with the input image’s manual segmentation using the Jaccard similarity index, Dice coefficient and accuracy index. The results of the proposed algorithm depicts a far more admirable accuracy quality compared to existing clustering based segmentation methods.
INTRODUCTION
K-means algorithm proposed by MacQueen in 1967 is a classical clustering technique implemented for the segmentation of the human brain [8]. With the aim of improving the algorithm’s high sensitivity to noise, a multithreaded framework incorporated with morphological operations using k number of clusters have been used to segment multiple MR slices [9]. A new efficient method of generating k cluster centers by reducing the mean square error of the final cluster have as well been researched. This is achieved by calculating the Euclidean distance of data points in determining initial cluster centroids rather than mere selection as in the standard K-means algorithm [10]. A novel method for searching initial centroid for the purpose of reducing computational time of K-Means algorithm was accomplished by transforming data points into positive space while computing them individually to the origin [11].
FCM algorithm yields much better segmentation results because of its ability to render varying degree of membership to pixels in different clusters [12]. However, the algorithm also faces the challenges of high sensitivity to noise and centroid selection which results in convergence of local minimum easily [13]. In overcoming this, a spatial neighborhood membership function has been proposed to eliminate the algorithms sensitivity to noise. This is done by creating a neighborhood window around pixels of each cluster center [14]. Also, an abstract representation of chromosomes in genetic algorithm have been proposed as an optimization solution for controlling the global centroid value of clusters [15].
[16] proposed an extension of the 2-D adaptive fuzzy algorithm for 3-D MR images which are not influenced by intensity inhomogeneities. They accomplished this by demonstrating the difference in the inhomegeneity brightness through multiplying the cluster centroids with a newly computed gain field, thusly guaranteeing the gain field is slowly varying and spatially. Likewise, a probabilistic framework which segments brain images based on the combination of tissue classification using distribution of Gaussian mixtures, and spatial prior brain atlas for registration have been implemented [17]. [18] utilized an integrated method which comprises anisotropic filters alongside snakes contouring techniques with a priori knowledge to segment the brain in MRI images. An automatic procedure was used to reconstruct the gray and white matter surface of the cerebral cortex by calculating the plane of least intensity variance along the curvature information and the normal orientation of the within cortex slab [19]. They worked with the assumption that cortical white matter does not border any tissues having higher intensity in T1-weighted MR images. A Generalized Expectation Maximization (GEM) algorithm to estimate model parameter and Markov random Fields (MRF) for incorporating contextual information in single and multispectral MR images has also been investigated [20]. The algorithm is initialized using brain atlases containing spatial location of various tissue classes.
BACKGROUNDINFORMATION K-Means Algorithm
The standard K-means algorithm classifies data in an object into k clusters based on their similarity [21]. This similarity is determined by an objective function which measures the distance between pixels and cluster centers using the mean square error criterion such as Euclidean distance [22]. Pixels are then classified into clusters in which they have minimum distance. The Euclidean distance is calculated as:
( , ) k d p x y c
(1) where d is the distance between the pixels p(x,y) andthe cluster center Ck is represented as:
1
( , )
k k
k
y c x c
c p x y
k
(2) This process is continued until a predefined error value is satisfied. Although K-means has the great advantage of being easy to implement, it has certain drawbacks such as sensitivity to noise [23]. The quality of the final clustering result as well depends on the arbitrary selection of initial centroid. So, if the initial centroid is randomly chosen, different results would be generated for different initial centers [24].
FCM Algorithm
The FCM clustering algorithm is contrary to hard clustering techniques like K-means clustering in that images are divided into clusters and the pixels can belong to multiple clusters with varying degree of membership [25]. Given M-dimensional N data points represented by Xi, (i = 1, 2 ,…., N), the algorithm iteratively optimizes the cost function defined as [26];
1 1
N c
m
ij ij
j i
J d
(3) where µijrepresents the membership function, m is the fuzziness of the function, dijrepresents the distance of pixels to their center and C represents the cluster centers [27]. The distance dijand membership function µijare defined as:
1 1 n m ij j j ij n m ij j u x d u
(4) 2/( 1) 1 1 ijm m c ij k ik u d d
(5)and biases the algorithm toward homogeneous clustering. In this work, a 5*5 neighborhood window is been used and the spatial information function of a pixel is defined as [31];
( j)
ij ij
k NB x
h u
(6)
where spatial function hij represents the probability that pixel xj belongs to the ithcluster and
NB(xj) represents the local square window centered on image pixel xj. Furthermore, with p and q being parameters to control the relative importance of membership, the spatial function is incorporated into the FCM membership function as [32]:
'
1
p q
ij ij
ij c
p q
ij ij k
u h u
u h
(7)
PROPOSEDSFCMKSEGMENTATIONALGORITHM
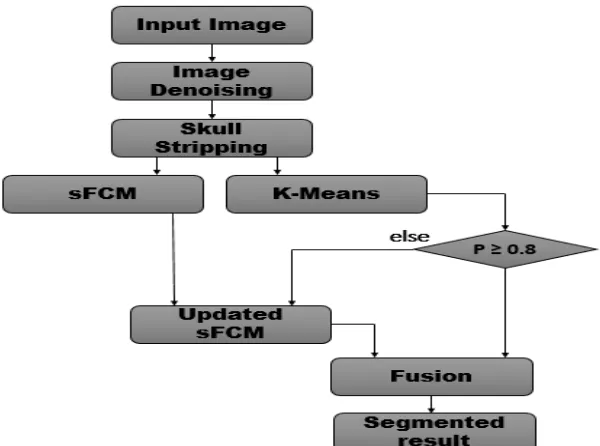
[image:4.612.160.460.462.685.2]In this paper, we propose an efficient brain segmentation technique called sFCMKA (Spatial Fuzzy C-Means and K-means Algorithm) for segmenting the brain into white matter (WM), grey matter (GM) and cerebrospinal fluid (CSF). This involves the fusion of K-means and sFCM algorithm. First, both algorithms are implemented. Since FCM algorithm classifies pixels into different clusters based on their degree of membership, it yields better result than the other hard clustering methods. However, because not all tissues of the brain are overlapped, this might cause some pixels to have a singular membership. This is complemented by the K-Means algorithm which segments pixels into just one cluster. The varying membership function of the FCM algorithm is complimented by the high probability observed in K-Means segmentation. Figure 1 below depicts the framework of the proposed algorithm.
Image Denoising
A magnetic field is generated when electricity is passed through the coil of the principal magnet of an MRI. The resulting rapid pulses of electricity causes predictable changes in the field[33]. This yields tissue changes that can be measured and transformed into anatomic images. These images are not but with deterioration in quality due to circumstances such as limitations in the hardware, scanning times, movement of patients, or even the motion of molecules in the scanning subject. For this work, the OTSU algorithm is adopted to obtain specific tissue’s threshold value for its simplicity. Then, wiener algorithm which executes an optimal tradeoff between inverse filtering and noise smoothing to remove additive noise and inverts blurring simultaneously is implemented. Wiener filtering as a linear estimation of the original image minimizes the overall mean square error in the process of inverse filtering and noise smoothing and can be expressed in Fourier domain as[34]:
*
1 2 1 2
1 2 2
1 2 1 2 1 2
( , ) ( , )
( , )
( , ) ( , ) ( , )
xx
xx
H f f s f f W f f
H f f s f f s f f
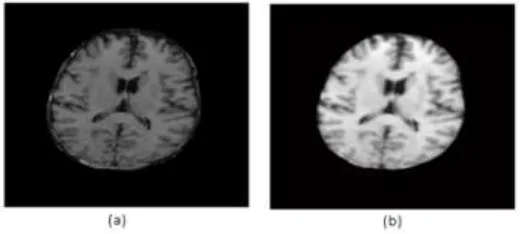
[image:5.612.176.436.386.503.2](8) where Sxx(f1, f2), Sƞƞ(f1,f2) are respectively power spectra of the original image and the additive noise while H(f1, f2) denotes the blurring filter. It is easy to see that the Wiener filter has two separate part, an inverse filtering part and a noise smoothing part. It not only performs the deconvolution by inverse filtering (highpass filtering) but also removes the noise with a compression operation (lowpass filtering)[35]. The input MR image before and after denoising and filtering are depicted in Figure 2 below.
Figure 2. (a) MR image before denoising. (b) MR image after denoising and filtering.
Skull Stripping
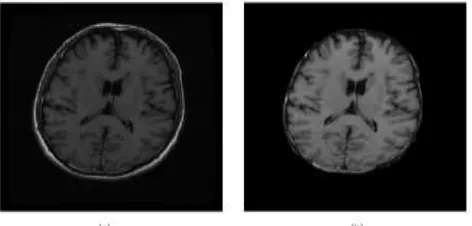
Figure 3. (a)T1 MR image (b) Skull stripped MR image.
sFCMK Segmentation
After both sFCM and K-Means algorithms are computed, the segmented results are then compared. Pixels having same clustered group in both the K-Means and sFCM algorithms are left to remain the same. Such pixels having corresponding clusters in both algorithm would have their cluster centers defined as:
1
/ / 2
c
k kn k
i
c x n G
(9)where Ck is the cluster center of pixels having same segmented clusters in both algorithms. Gk denotes the K-means center for such kth cluster and n denotes the number of such pixels.
Now, pixels with contradicting clusters in sFCM and K-Means are reprocessed. Pixels classified into varying clusters in both methods with probability value less than 0.8 according to the K-means algorithm are allowed to maintain their segmented cluster resulting from the sFCM algorithm. This is because probability value ranging from 0.7 - 1 is generally accepted as a good classification value, as such, we chose the threshold value for our work as 0.8 to increase the algorithm’s accuracy.
Thereafter, pixels having varying clustered result in both algorithm with probability value ≥ 0.8 according to the K-Means result are denied of their FCM membership and as such retain their originally clustered K-Means segment.
This makes perfect sense since there is probability that certain brain tissue pixels won’t have multiple membership. Such pixels are the ones having high statistical probability in the K-means algorithm. The evaluation of pixels having different clusters from both algorithm is given as:
( 0.8)
( )
k
k
g p
k d else
P
(10) where Pk represents pixels belonging to kth cluster, gkrepresents pixels classified into their K-means clusters and dk represents pixels classified into their FCM clusters.
EXPERIMENTANDRESULTS
The original T1-weighted brain MR image used for this experiment is provided by Hua Xi hospital, Chengdu in 2016. The segmented results are evaluated using Dice Similarity Coefficient (DSC), Jaccard similarity (JS) and Accuracy (A) index compared to the ground truth of the input image. The DSC and JS index are computed by;
[image:6.612.189.425.74.187.2]JS = |𝑇𝑃|
|𝐹𝑃|+|𝑇𝑃|+|𝐹𝑁| (12)
where TP represents true positive, TN represents true negative, FP represents false positive and FN
represents false negative as regards the pixels matching the segmented result and the ground truth. These metrics estimates the sensitivity and specificity of the segmented results. Likewise, the accuracy of the segmented result is computed as:
Accuracy (A) = 𝑇𝑃+𝑇𝑁
𝑇𝑃+𝑇𝑁+𝐹𝑃+𝐹𝑁 (13)
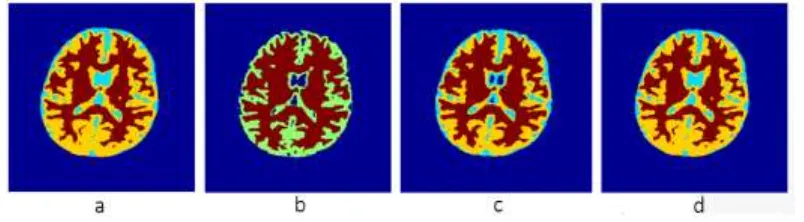
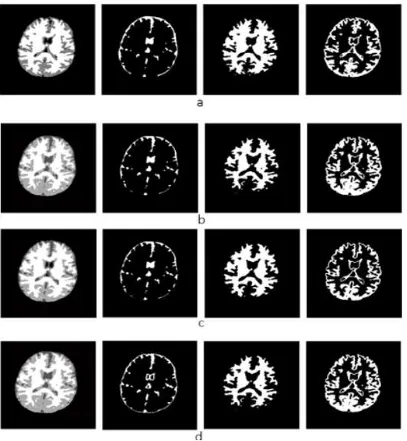
[image:7.612.106.508.222.333.2]All values ranges from 0 to 1 with better result recorded as the vale approaches 1. In comparing the results of the proposed method with the classic K-means and FCM results, it is vivid that sFCMKA yielded better results as shown in Figure 4 and TABLE II below.
Figure 4. From left to right, result of all segmented tissues for (a)Standard FCM, (b) Standard K-Means, (c) sFCM algorithm and (d) sFCMK algorithm.
The similarity and overlap values of the four algorithms; Fuzzy C-Means (FCM), K-Means, Spatial Fuzzy C-Means (sFCM) and the proposed spatial Fuzzy K-Means Algorithm (sFCMKA) are depicted in TABLE I above. It is seen from Figure 5 that the sFCMKA has much more improved results in both the Dice and Jaccard measures especially in white matter and grey matter tissues. This is reasonable due to (1), the noise effect handled by the sFCM. This ensures that noise was well eliminated with the help of the pixels neighborhood functions. (2) Also, because of the threshold value that K-Means introduces, pixels which are likely not to share clusters with one than more clusters are forced to have a singular group which they rightly belong to.
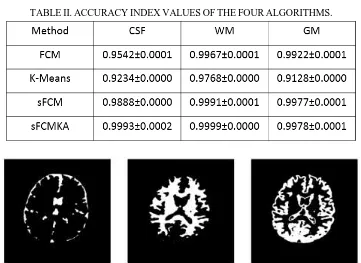
Likewise, as depicted in TABLE II above, unsurprisingly, the sFCMKA yielded better accuracy of which pixels are actually classified as CSF, WM and GM as compared to the other algorithms when varied against the ground truth results. The result of the CSF, WM and GW of the sFCMG algorithm are displayed in Figure 6.
CONCLUSIONS
Brain diagnosis and treatment requires accurate delineation of the brain underlying structures to be represented in a manner that can be readily analyzed. Till now, manual segmentation which is extremely time consuming and having variability challenges is yet considered the gold standard. Though the available techniques have been used to achieve quite good results, they often have challenges of sensitivity to noise or lack of fuzzy membership.
for pixels having singular membership. The results depicts that the proposed method yields very robust and accurate brain segmentation than many promising findings available.
TABLEI. JACCARDANDDICESIMILARITYCOEFFICIENTVALUESOFTHEFOURALGORITHMS.
TABLEII.ACCURACYINDEXVALUESOFTHEFOURALGORITHMS.
Figure 6. sFCMKA segmentation results from left to right; CSF, WM and GM.
ACKNOWLEDGMENT
This work was supported by the NSFC-Guangdong Joint Fund (Grant No. U1401257), National Natural Science Foundation of China (Grant No. 61300090, 61133016 and 61272527), science and technology plan projects in Sichuan Province (Grant No. 2014JY0172) and the opening project of Guangdong Provincial Key Laboratory of Electronic Information Products Reliability Technology (Grant No. 2013A061401003).
REFERENCES
[image:9.612.125.486.231.494.2]2. S. González-villà, A. Oliver, S. Valverde, L. Wang, R. Zwiggelaar, and X. Lladó. 2016. “Artificial Intelligence in Medicine A review on brain structures segmentation in magnetic resonance imaging,” Artif. Intell. Med., 73, pp. 45-69.
3. P. Singh, H. S. Bhadauria, and A. Singh. 2014. “Automatic brain MRI image segmentation using FCM and LSM,”
Proc. - 2014 3rd Int. Conf. Reliab. Infocom Technol. Optim. Trends Futur. Dir. ICRITO 2014.
4. P. S. Mathuranath, T. Varghese, R. S. Kumari, and C. Kesavdas. 2012. “Segmentation of mr brain images using FCM technique in frontotemporal dementia,” IET Chennai 3rd Int. Conf. Sustain. Energy Intell. Syst. (SEISCON 2012), pp. 62-65.
5. Y. Song, Z. Ji, and Q. Sun. 2014. “An Extension Gaussian Mixture Model for Brain MRI Segmentation,” Conf. Proc. IEEE Eng. Med. Biol. Soc., pp. 4711-4714.
6. F. Zhu, Y. Song, and J. Chen. 2010. “Brain MR Image Segmentation based on Gaussian Mixture Model with Spatial Information,” Image and Signal Processing (CISP), pp. 1346-1350.
7. T. Lan, Z. Xiao, C. Hu, Y. Ding, and Z. Qin. 2014. “MRI Brain Image Segmentation Based on Kerneled FCM Algorithm and Using Image Filtering Method,” Int. Conf. Audio, Lang. Imagen Process., pp. 511-515.
8. J. Liu and L. Guo. 2015. “A New Brain MRI Image Segmentation Strategy Based on K-means Clustering and SVM,”
2015 7th Int. Conf. Intell. Human-Machine Syst. Cybern., pp. 270-273.
9. D. Megha, P. A. Ram, and M. Reddy. 2012. “A Parallel Segmentation of Brain Tumor,” Int. Conf on Computing, Comm. and Networking Tech. (ICCCNT), pp. 787-794, July.
10. P. Purohit. 2013. “A New Efficient Approach towards k-means Clustering Algorithm,” Int. Journal of Comp. App.,
65(11), pp. 7-10.
11. M. Yedla, S. R. Pathakota, and T. M. Srinivasa. 2010. “Enhancing K-means Clustering Algorithm with Improved Initial Center,” Int. Jour. of Comp. Sci. and Info. Tech., 1(2), pp. 121-125.
12. M. S. Choudhry and R. Kapoor. 2016. “Performance Analysis of Fuzzy C-Means Clustering Methods for MRI Image Segmentation,” Procedia Comput. Sci., 89, pp. 749-758.
13. C. R. Ng, J. C. M. Than, N. M. Noor, and O. M. Rijal. 2016. “Double segmentation method for brain region using FCM and graph cut for CT scan images,” IEEE 2015 Int. Conf. Signal Image Process. Appl. ICSIPA 2015 - Proc., 1, pp. 443-446.
14. S. K. Adhikari, J. K. Sing, and D. K. Basu. 2015. “Conditional Spatial Fuzzy C-means Clustering Algorithm with Application in MRI Image Segmentation,” Infor Systems Design and Intelligent App., pp. 539-547.
15. S. Jansi. 2014. “Modified FCM using Genetic Algorithm for Segmentation of MRI Brain Images,” Comp Intelligence and Computing Research (CICP), pp. 1-5.
16. D. L. Pham and J. L. Prince. 1998. “Adaptive Fuzzy Segmentation of Magnetic Resonance Images,” IEEE Transactions on Medical Imaging, pp. 737-752.
17. J. T. Ashburner and K. J. Friston. 2005. “Unified Segmentation,” Neuroimage vol, 26 (3), pp. 839-851.
18. M. S. Atkins, M. S. Atkins, and B. T. Mackiewich. 1998. “Fully Automatic Segmentation of the Brain in Fully Automatic Segmentation of the Brain in MRI,” IEEE trans. Med. Imaging, 17 (1), pp. 98-107.
19. A. M. Dale, B. Fischl, and M. I. Sereno. 1999. “Cortical Surface-Based Analysis,” Neuroimage, 9 (2), pp. 179–194. 20. K. Van Leemput, F. Maes, D. Vandermeulen, and P. Suetens. 1999. “Automated Model-Based Tissue Classification
of MR Images of the Brain,” IEEE Trans. Med. Imaging, 18(10), pp. 897-908.
21. L. Wang and C. Pan. 2014. “Robust level set image segmentation via a local correntropy-based K-means clustering,”
Pattern Recognit., 47(5), pp. 1917-1925.
22. T. H. Lee, M. F. A. Fauzi, and R. Komiya. 2008. “Segmentation of CT brain images using K-means and EM clustering,” Proc. - Comput. Graph. Imaging Vis. Mod. Tech. Appl. CGIV, pp. 339-344.
23. C. Huang and L. Zeng. 2015. “Robust image segmentation using local robust statistics and correntropy-based K-means clustering,” Opt. Lasers Eng., 66, pp. 187-203.
24. H. Hooda, O. P. Verma, and T. Singhal. 2014. “Brain Tumor Segmentation : A Performance Analysis using K-Means , Fuzzy C-K-Means and Region Growing Algorithm,” Int. Conf. on Adv Comm Control and Comp Tech. (ICACCCT), 978, pp. 1621-1626.
25. N. Menon and R. Ramakrishnan. 2015. “Brain Tumor Segmentation in MRI Images Using Unsupervised Artificial Bee Colony Algorithm and FCM Clustering,” Comm and Signal Proc (ICCSP), pp. 6-9.
26. L. He, Y. Wen, M. Wan, and S. Liu. 2014. “Multi-channel features based automated segmentation of diffusion tensor imaging using an improved FCM with spatial constraints,” Neurocomputing, 137, pp. 104-117.
27. A. Oluwasanmi, Z. Qin, T. Lan, and Y. Ding. 2016. “Brain Tissue Segmentation in MR Images With FGM,”
International Conference on Artificial Intelligence and Computer Science (AICS), pp. 44-51.
29. X.-L. Jiang, Q. Wang, B. He, S.-J. Chen, and B.-L. Li. 2016. “Robust level set image segmentation algorithm using local correntropy-based fuzzy c-means clustering with spatial constraints,” Neurocomputing, 207, pp. 1-14.
30. S. K. Adhikari, J. K. Sing, D. K. Basu, and M. Nasipuri. 2015. “Conditional spatial fuzzy C-means clustering algorithm for segmentation of MRI images,” Appl. Soft Comput., 34, pp. 758-769.
31. N. Arora and R. Pandey. 2016. “Noise adaptive FCM algorithm for segmentation of MRI brain images using local and non-local spatial information,” Int. Conf. Intell. Syst. Des. Appl. ISDA, vol. 2016–June, pp. 610-617.
32. X.-L. Jiang, Q. Wang, B. He, S.-J. Chen, and B.-L. Li. 2016. “Robust level set image segmentation algorithm using local correntropy-based fuzzy c-means clustering with spatial constraints,” Neurocomputing, 207, pp. 1-14.
33. S. Rajeshwari and S. Sharmila. 2013. “Efficient quality analysis of MRI image using preprocessing techniques,”
IEEE Conf. on Inf. and Comm. Tech., ICT, pp. 391-396.
34. V. Roy. 2013. “Spatial and Transform Domain Filtering Method for Image De-noising : A Review,” I.J.Modern Edu. and Comp. Sci., pp. 41-49.
35. H. M. Ali. 2017. “MRI Medical Image Denoising by Fundamental Filters,” SCIREA Journal of Computer, 2(1), pp. 12-26.
36. R. M. Prakash and R. S. S. Kumari. 2014. “Nonsubsampled Contourlet Transform based Expectation Maximization Method with Adaptive Mean Shift for Automatic Segmentation of MR Brain Images” Int. Conf. on Elec. and Comm. System, pp. 1-5.