2018 International Conference on Modeling, Simulation and Optimization (MSO 2018) ISBN: 978-1-60595-542-1
Improved Methodology for Seismic Estimation of Highway
Based on Wenchuan Earthquake
Heng HU, Jun-qi LIN
*and Jin-long LIU
Key Laboratory of Earthquake Engineering and Engineering Vibration, Institute of Engineering Mechanics, China Earthquake Administration, Harbin 150080, China.
*Corresponding author
Keywords: Wenchuan earthquake, Earthquake damage estimation, Non-linear regression,
Highway.
Abstract. Highway network not only is an important component of the lifeline systems, but also
plays a crucial role in earthquake relief after a disastrous earthquake. Quick and accurate estimation of highway engineering seismic damage can provide scientific basis for earthquake disaster prevention planning. Based on Yi-ping CHEN’s empirical methodology, this paper uses the national standard earthquake damage index. And highway classification, fortification intensity and other parameters are also added to make the model integrated and accurate. Compared with the real seismic damages in Wenchuan earthquake, the results of using original and the improved methodologies show that the improved model is more accurate.
Introduction
China is a country with high seismic risk. Over the past ten years, large and small earthquakes have occurred frequently, many of them are of magnitude 7 or above. After the "5.12" Wenchuan earthquake, highway networks to the earthquake-stricken area were completely interrupted [1], which not only caused serious casualties and property losses, but also made earthquake emergency and rescue much harder. Therefore, it is crucial to keep the highway networks unblocked after the earthquake. Highway seismic estimation is a basic part of earthquake disaster prevention and mitigation [2]. After an earthquake, the damage information can be obtained via field investigation and disaster identification. However, it often takes a large quantity of time to proceed [3]. Therefore, it is important to reasonably predict the extent of damage to highways during a possible earthquake, especially in mountainous area highway.
Highway Seismic Damage Influence Factors Analysis
Whether liquefaction of foundation soil in earthquake or not is related to these indexes including gravel content, groundwater depth, earthquake intensity and so on [5]. Besides, liquefaction always appears after an earthquake. Therefore, it is not suitable to directly consider liquefaction as an influence factor [6]. In the same way, as a specific phenomenon of damage, slope instability should also not be considered as an influence factor. This paper collects Wenchuan earthquake damage data and analyzes it to get the relationships among liquefaction, instability, earthquake intensity, slope height, slope angle, slope protection measures, site classification and other factors by using statistical regression analysis. So, liquefaction and slope instability can be replaced in this model.
With the overall consideration of previous research achievements on highway earthquake damage prediction and damage investigation of Wenchuan earthquake, highway grade, subgrade type, retaining wall type, soil type, slope height, slope gradient, side slope protection, subgrade elevation difference, seismic fortification intensity and actual intensity are chosen as influence factors to establish this model.
In retaining structure, the reinforced retaining wall, anti-slide pile and bolt type retaining wall, which perform well in earthquake, are classified as seismic favorable type. As for slope protection, it can be divided into three types. No protection, facing wall protection, plant protection and shotcrete without net belong to seismic unfavorable. Netting shotcrete, active or passive protective net belongs to seismic neutral. Grid protection, pre-stressed bolt protection and multiple protection measures belong to seismic favorable.
Earthquake Damage Index
According to the description of the earthquake damage index in Chinese Seismic Intensity Scale
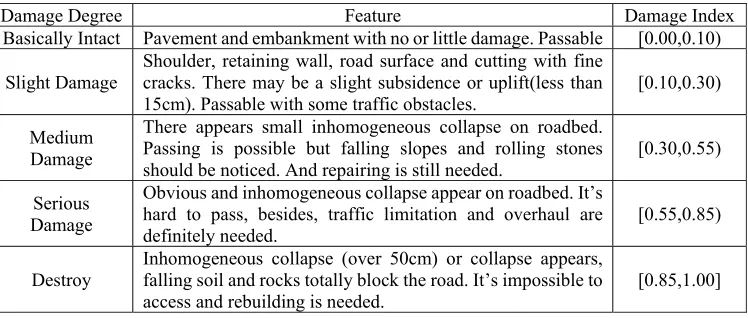
[image:2.612.122.496.454.613.2]GB/T 1772-2008 and Lifeline Engineering Earthquake Damage Grade Division GB/T24336-2009, we can divide the damage into five scales (see in Table 1). Compared with the earthquake damage index defined in Yi-ping CHEN’s methods, this paper defines a more intuitive criterion for the earthquake damage index.
Table 1. Highway engineering earthquake damage index and its feature.
Damage Degree Feature Damage Index
Basically Intact Pavement and embankment with no or little damage. Passable [0.00,0.10)
Slight Damage
Shoulder, retaining wall, road surface and cutting with fine cracks. There may be a slight subsidence or uplift(less than
15cm). Passable with some traffic obstacles. [0.10,0.30)
Medium Damage
There appears small inhomogeneous collapse on roadbed. Passing is possible but falling slopes and rolling stones
should be noticed. And repairing is still needed. [0.30,0.55)
Serious Damage
Obvious and inhomogeneous collapse appear on roadbed. It’s hard to pass, besides, traffic limitation and overhaul are
definitely needed. [0.55,0.85)
Destroy Inhomogeneous collapse (over 50cm) or collapse appears, falling soil and rocks totally block the road. It’s impossible to
Regression Method
Regression can be divided into two categories: linear and non-linear. Linear regression is simpler, but combined with the actual situation and historical experience, the highway earthquake damage does not meet the characteristics of linear regression in addition to each factor, and is closer to the non-linear regression characteristic of each factor multiplication [8]. Therefore, the highway earthquake damage is regarded as the result of the multiplication of each factor, that is:
1 1
j jk r
n
x jk
j k
Y
c
a
(1)The Y represents the highway earthquake damage index, and its meaning are shown in Table 2 (if
Y≥1.0, Y is equal to 1.0); c means constant coefficients; ajk represents the regression coefficient of
minor class k from the major class j, which are in the classification of Table 2; rj means the major
class j which has rj levels; xjk means the parameter values of minor class k from the major class j of
Table 2. Earthquake estimation parameters and regression results for highway engineering.
j Major Class k Minor Class xjk Regression ajk Suggestion ajk
1 Highway grade
1 Expressway and grade-I x11 1.0000 1.00
2 Grade-II x12 1.0526 1.05
3 Grade-III and grade-IV x13 1.1425 1.14
2 Subgrade type
1 Non-cut&fill x21 1.0000 1.00
2 All cut subgrade x22 1.6434 1.64
3 All fill subgrade x23 1.7600 1.76
4 Part-cut and part-fill x24 2.0000 2.00
3 Retaining wall type
1 Seismic favorable x31 1.0000 1.00
2 Concrete gravity x32 1.4680 1.47
3 Masonry gravity x33 1.6218 1.62
4 Non-retaining wall x34 1.9425 1.94
4 soil type
1 I-type x41 1.0000 1.00
2 II-type x42 1.0509 1.05
3 III-type x43 1.1628 1.16
4 IV-type x44 1.2000 1.20
5 slope height
1 Non-slope x51 1.0000 1.00
2 h≤15 x52 1.0747 1.07
3 15m<h≤40m x53 1.1765 1.18
4 40m<h≤120m x54 1.2353 1.24
5 120m<h x55 1.3176 1.32
6 slope gradient
1 Non-slope x61 1.0000 1.00
2 θ≤35° x62 1.1000 1.10
3 35°<θ≤65° x63 1.1875 1.19
4 65°<θ x64 1.3750 1.38
7 protection side slope
1 Non-slope x71 1.0000 1.00
2 Seismic favorable x72 1.0610 1.06
3 Seismic neutral x73 1.4109 1.41
4 Seismic unfavorable x74 1.7636 1.76
8 subgrade elevation difference
1 h≤1m x81 1.0000 1.00
2 1m<h≤3m x82 1.0588 1.06
3 3m<h≤5m x83 1.1176 1.12
4 5m<h x84 1.2320 1.23
9 fortification Seismic intensity
1 9 x91 1.0000 1.00
2 8 x92 1.4167 1.42
3 7 x93 1.6667 1.67
4 6 x94 1.8667 1.87
10 actual intensity
1 6 x10,1 1.0000 1.00
2 7 x10,2 1.5774 1.58
3 8 x10,3 1.6867 1.69
4 9 x10,4 1.9613 1.96
5 10 x10,5 2.7956 2.80
6 11 x10,6 3.4274 3.43
Constant Coefficient 0.013785 0.0138
1 1 1 1
ln ln j jk = ln j ln
r r
n n
x
jk jk jk j k j k
Y c a c x a
(2)Remember ln ; ' ln ; ' ln
jk jk
y Y c c a a , there is a linear regression equation:
' 1 1 ' j r n jk jk j k
y c a x
(3)In this way, the least squares method can be used for linear regression. Exponent is adopted after the parameters are given:
'
'
; ; ajk
y c jk
Y e c e a e (4) The coefficients of each variable in the original regression equation can be obtained.
Accuracy Analysis
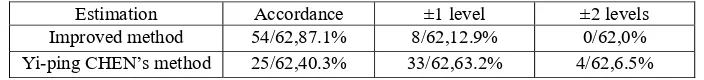
[image:5.612.130.482.363.403.2]In order to analyze the accuracy of the regression results, we can take the parameters into the data from Report on Highways’ Damage [9] to calculate the theoretical damage degree, then compare the theoretical degree with the actual damage degree and Yi-ping CHEN’s theoretical damage degree (shown in Table 3). It can be seen from the results that the improved model is preliminarily validated to be more reliable.
Table 3. Accuracydistribution of highway engineering damage between estimation and reality.
Estimation Accordance ±1 level ±2 levels
Improved method 54/62,87.1% 8/62,12.9% 0/62,0%
Yi-ping CHEN’s method 25/62,40.3% 33/62,63.2% 4/62,6.5%
Conclusion
According to Yoshihisa Maruyama’s [10] research, peak ground velocity (PGV) is more relevant than seismic intensity in seismic damage estimation of highways. Afterwards, we will we do some associated work. Compared with the theoretical distribution interval of seismic damage index, the actual value is close enough to indicate that this highway seismic damage estimation model is accurate. It can be seen from the accuracy distribution table that the prediction results of most highways are in line with the actual results, and its accuracy is higher than that of Yi-ping CHEN’s methods.In addition, this estimation model is useful for preparing countermeasures against future earthquakes.
Acknowledgement
This study is supported by the National Key Technology R&D Program No. 2015BAK17B05, 2015BAK17B04.
References
[1] Ai-wen Liu, Shan Xia, Chao Xu, Damage and emergency recovery of the transportation systems after Wenchuan earthquake, J. Technology for Earthquake Disaster Prevention. 3 (2008) 243-250. [2] Feng-hua Zhang, Li-li Xie, Study on evaluation of city’s ability reducing earthquake disasters, J. Journal of Natural Disasters. 04 (2001) 57-64.
[4] Yi-ping Chen, Xin Chen, Seismic damage prediction of subgrade and pavement, J, Earthquake Resistant Engineering. 3 (1993) 010.
[5] Xiao-ming Yuan, Zhen-zhong Cao, Fundamental method and formula for evaluation of liquefaction of gravel soil, J. Chinese Journal of Geotechnical Engineering. 04 (2011) 509-519. [6] En-dong Guo, Zhao Zhao, Zai-rong Wang, Zhi Liu, Lin Gao, Ya-dong Wang, Improved methodology for seismic estimation of highway beam bridge, J. Journal of Beijing University of Technology. 39 (2013) 192-197.
[7] Jian Zhang, Hong-lue Qu, Yi Liao, Yao-xian Ma, Seismic damage of earth structures of road engineering in the 2008 Wenchuan earthquake, J. Environmental Earth Sciences, 65 (2012) 987-993. [8] Mei-zhen Zhu, A Practical Method for Predicting Seismic Damage of Highway Bridges, J. Journal of Tongji University, 03 (2012) 279-283.
[9] Le-sheng Chen, Wei-lin Zhuang, Report on highways’ damage in the Wenchuan earthquake Subgrade, China Communication Press, Beijing, 2012.