2017 3rd International Conference on Electronic Information Technology and Intellectualization (ICEITI 2017) ISBN: 978-1-60595-512-4
Multi-agent Cooperative Operation Model and
Profit Allocation of PV-based Microgrid
Changqing Xu, Zheng Zheng, Nan Zhou, Tao Tan, Jiaqi Shi
and Jianhua Zhang
ABSTRACT
The new electric power reform scheme allows the users of distributed generation or microgrid systems to participate in electricity trade, which is beneficial to the improvement of economic benefits of microgrid. Generally, microgrid is composed of several economic members, including photovoltaic operators, storage operators, users and so on. Based on the analysis on the impetus of operation consortia, market transaction mode and their cooperative game model among the economic members in microgrid are proposed. The time-sharing scheduling model of PV-based microgrid decides the operation status of members to maximize the benefits of the whole alliance, and the revenue of each member in the alliance is allocated by the Shapley Value method. As can be seen, the revenue of photovoltaic operators, storage operators and users are increased in cooperation mode with the increase of the considerable revenue of alliance, and achieve the parties’ mutual balance. Besides, the computational complexity is relatively low, which contributes to the large-scale development of PV-based microgrid.
INTRODUCTION
Microgrid program is an innovation application of "Internet +" in the energy field. User-side PV-based microgrid with distributed PV and energy storage (ES) as the core components can take advantage of controllable load resources and is _______________________
Changqing Xu, Zheng Zheng, Nan Zhou, State grid henan economic research institute, Henan 450052, China
gradually emerging on the user side. Based on existing research and practical experience, PV-based microgrid is usually composed of multi-agent who pursuit of maximizing the benefits, such as PV operators, ES operators and users, etc. However, due to the high cost of ES devices, PV microgrid does not have a direct economic benefits. ES operators are less enthusiastic about participating in microgrid program. Therefore, under the electricity market environment, to meet the interest needs of agents and to distinguish and analyze the investment and the benefits of agents are the key factors to directly determine whether the PV-based microgrid can develop smoothly and widely.
At present, many researches on PV microgrids focus on system optimization [1], control protection [2] and so on. There are also some literatures aiming at the market operation of distributed PV, economic analysis [3]. In literature [3], the author establishes a comprehensive decision-making model which set the maximum net gain as the objective function to optimize online power of distributed PV, and evaluates the influence of PV capacity and on-grid electric price on microgrid economy. In [4], the economic evaluation process of distributed photovoltaic power generation was established, and the cost / benefit analysis was carried out for three operation modes.
Most of the existing research is concerned with the optimal design and economic analysis of microgrid overall operation, and there is little literature focus on the market operate of economic agents. As a new type of energy system, the user side PV microgrid is not perfect in its operation mode, user side demand, economic benefit and so on. Its development faces many uncertain factors and risks. The main contents of this paper include analyzing the market trading model of each agent in PV-based microgrid, proposing the model of cooperative game between economic agents, analyzing the power of alliance formation, proposing PV-based microgrid time-sharing scheduling model to maximize the income and adopting the Shapley method to distributes the benefits according to the contribution of each agent, and promotes the benefits balance between agents
BUSINESS OPERATION MODE
According to the current distributed PV policy, in addition to government subsidies, the electricity price in accordance with the benchmarking price of coal-fired units is significantly lower than the industrial and commercial electricity price[5]. In this paper, photovoltaic operators, ES operators and users are formed as an alliance to share PV and transact by direct supply electricity price and to direct supply price transactions, Low price to the power of the power grid. In this way, the power delivered to the utility grid at a lower price can be reduced.
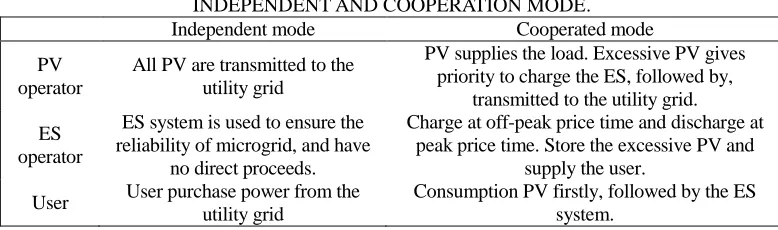
The difference between independent operation mode and cooperation operation mode is shown in Table Ⅰ.
In the independent mode, the electricity generated by PV is purchased by the utility grid according to the online electricity price. In an alliance which composite with only PV and users, alliance consumes the PV power preferentially and PV operators trade with users by utility grid electricity power price. If the PV power is excessive, utility grids will purchase the superfluous power by the grid price. When the alliance contains PV, users and ES system, the micro-grid performs time-sharing scheduling under cooperative mode.
In order to reduce the impact on the utility grid, the ES system can only supply users, not carry out arbitrage behavior. Therefore, in the independent mode, ES is mainly used to ensure the reliability of microgrid and have no direct economic benefits. When alliance only contains ES and users, the ES system charge during low electricity price period, discharge during peak electricity price period and trade with users by utility grid electricity price. Certainly, power shortage is supplemented by the utility grid. When the alliance contains PV, users and ES system, the micro-grid performs time-sharing scheduling under cooperative mode.
[image:3.612.101.490.404.519.2]When microgrid operates in independent mode, users buy power from the utility grid. If there exists PV in the alliance, prefers to consume the PV power and secondly the ES system.
TABLE Ⅰ. OPERATION MODE CONTRAST UNDER INDEPENDENT AND COOPERATION MODE. Independent mode Cooperated mode PV
operator
All PV are transmitted to the utility grid
PV supplies the load. Excessive PV gives priority to charge the ES, followed by,
transmitted to the utility grid. ES
operator
ES system is used to ensure the reliability of microgrid, and have
no direct proceeds.
Charge at off-peak price time and discharge at peak price time. Store the excessive PV and
supply the user. User User purchase power from the
utility grid
Consumption PV firstly, followed by the ES system.
TIME-SHARING SCHEDULING AND THE PROCEEDS OF AGENTS
Cooperation Mode
C7=C7+1 C6=C6+1
C5=C5+1 C4=C4+1 C3=C3+1
C8=C8+1 C9=C9+1 C2=C2+1
PV charges the ES
t=t+1
Start
PV supply local load
?
?PPVPLoad tT
1
t
Peak price
ES is not full?
PV, the utility grid charge the ES ES stay unchanged, transmit all PV to the
utility grid End
Read-in the microgrid data
ES is not empty? Off-peak price
Peak price?
ES not empty?
PV, the utility grid supply load
Off-peak price?
ES not full?
The utility grid charge the ES
ES stay unchanged, transmit all PV to the
utility grid ES stay unchanged, transmit all PV to
the utility grid
ES stay unchanged
C10=C10+1 C1=C1+1
ES supply the load
ES stay unchanged
ES stay unchanged YES
NO
NO NO
NO
NO NO
NO NO
YES
YES
YES
YES
YES
YES
YES NO
YES
[image:4.612.194.418.82.406.2]YES
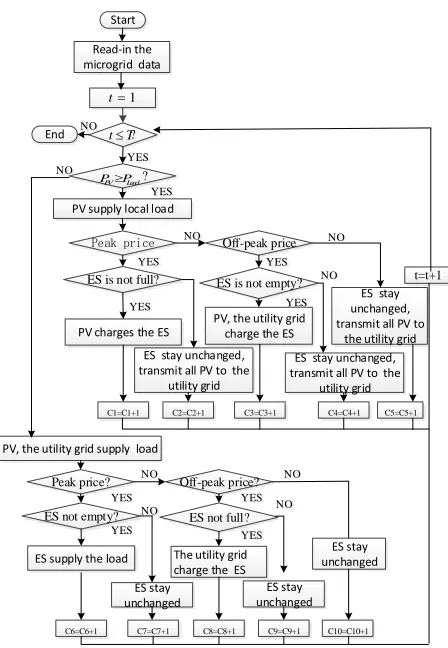
Figure 1. Optimal operation strategy of microgrid under TOU price.
When the PV output is more than the load, there are five cases in detail. Case 1: during the peak price, PV supplies the load, and the excess power charges the ES system. Case 2: If the ES system is full, transmit the extra PV power to the utility grid. Case 3: during the low price, the extra PV power and the utility grid charge the ES system in the case that the ES system is not full; Case 4: If the ES system is full, transmit the extra PV power to the utility grid. Case 5: during the parity period transmit the extra PV power to the utility grid.
PV operators directly power the load by PV system and obtain national PV financial subsidies. Excessive PV is used to charge the ES system and transmit to the utility grid. The energy storage operator which stores the excessive PV supplies power to the user during the peak price when it is lacking in PV. Regardless of the user's power is derived from the PV system, ES or the utility grid, the fees are calculated according to the sales price of the local utility grid.
The proceeds of the three agents in the cooperation mode are respectively:
,1 , , ,
1
T
PV d d i d PV e b c PV PV PV t
C V P t V P t V P t V P t
(1)
,1 1
, , , , ,
T
BS i b dc e b c PV i b c G t
C V P t V P t V P t
(2)
(3)
Where are respectively typical daily proceeds of PV operator, ES
operator and user. , are the charging power from PV and the utility
grid. are power supply to users from PV and ES system. is power which is transmitted to the utility grid from PV.
ES Operation Constraints
Taking into account the impact of battery discharge magnification on battery life, combined with the literature [6], charge and discharge model of ES can be expressed as follows:
(4)
Where is the capacity of ES system. , are charge and discharge power of ES. , represent the ES status. , are charge and discharge efficiency. , , are the SOC and its limitation of ES system. DOD represents
U,1 1 ( ) T i d t
C V t P t
,1, ,1, U,1
PV BS
C C C
, ,
b c PV
P t Pb c G, , t
, , ,
d PV d dc
P t P t P te
min max 1 1 0.8
1, , 0,1
b b c c c dc dc dc SOC b b rate
SOC SOC SOC
T T
dc c c
t t dc
c dc c dc
E t t E t P t t P t t S t t E t E E
S S t S P
P t t
DOD
bE Pc Pdc
c
dc c dc
SOC
the depth of discharge. is rated capacity. ES needs to complete a charge and discharge cycle in T durations, that is, the ES system should only retain the rigid capacity at the end of the typical day.
MULTI-AGENT COOPERATION INCOME DISTRIBUTION MODEL
Proceeds contrast between independent mode and cooperation mode is shown in Figure 2. For the power shared within the alliance, relative to the PV directly transmit to the utility grid, the increasing proceeds is the so-called cooperative surplus in cooperative game model. By distributing cooperative surplus in a reasonable way, distributed PV, ES and users can respectively increase proceeds or decrease expense.
After knowing the overall proceeds of the PV-based Microgrid alliance, the benefits that can be allocated are also needed to be determined. The so-called assignment is a set of n-dimensional vectors which is the solution of game, that is, each agent gets the corresponding allocation.
In the cooperative game (N,v),N={1,2,…n}, for each participant , a real-valued parameter xi is given to form the n-dimensional vector x = (x1, x2, ..., xn) which obey:
(5)
Let x be a distribution scheme for alliance K[7].
Shapley method is a mathematical method to solve the proceeds distribution problem in multiplayer cooperative game. It distribute the proceeds by the marginal contribution, which means the proceeds agent share is equal to the average of his marginal contribution to the alliance[8].
Assuming the individual set is , define the benefit function
which satisfy and is the total proceeds of the
subset S in the cooperative model. The Shapley method is used to distribute the proceeds to each individual in the set.
rate
E
iN
1 ( )
( )
i n
i i
x V i
x V N
1, 2, ,
K k F S( )
( ) 0
PV User
PV User
ES
Proceeds from the grid
+
Self-use proceeds
Proceeds from the grid
+
Self-use proceeds Share proceeds
+
[image:7.612.187.417.91.178.2]Independent mode Cooperated mode
Figure 2. Revenue contrast under independent and cooperation mode.
The proceeds of each agent is expressed as , and the detail can be calculated as follows:
(6)
S present all subset that include the ith agent in set K. represents the number
of subjects contained in subset S. reflects the contribution of the ith
subject to alliance S. is the occurrence probability of alliance S.
(7)
CASE STUDY
Research Object and Basic Data
This paper chooses a PV-based microgrid in Guangdong as research object, and simulates the time-sharing scheduling model of PV-based microgrid under independent mode and cooperative mode. Distributed PV, inverter and related equipment are invested and operated by a solar investment limited company. An ES company invests other equipment such as central controllers, ES equipment and so on. The total capacity of the PV system is 157kW, the energy storage system is 31.7kWh, and inverter capacity is 44kW. The basic electrical topology is shown in figure 3.
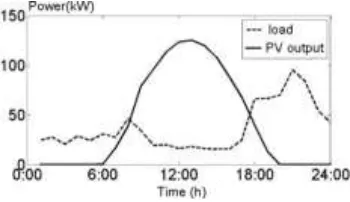
PV and load curve in a typical day is shown in figure 4. Visibly, the PV output is greater than the load between eight and 17 o’clock. In addition, the load reaches the peak in the night and maintain at the trough during the day. At seven o'clock in the evening there appears a small peak in electricity because of the preparation of dinner.
In the model, the price of the utility grid for Guangzhou residents is shown in Table Ⅱ, the online PV is 0.38 yuan/kWh and the PV subsidy is 0.42 yuan/kWh.
i
V
( ) ( ) ( ) ( ) , 1, 2, ,
i
S K
V F W S F S F S i i k
S
( ) F( )
F S S i
( )
W S
( 1)!( )!
( )
!
S k S
W S
k
0.4kV 10kV
The north district 10/0.4kV
Control switch ~ = PV and ES AIO machine
ES power lighting
Sub-microgrid by the lake
1D3
~ = Distribut
ion box of user1 PV inverter
~ =
14 PVs on the north district
The south district 10/0.4kV
~
= =~ ES inverter
ES Control switch
User1 ~ = User2
4 sub-microgrids on the south district
PV and ES AIO machine
Distrib ution box of user ~
= ~
=
4 house sub-microgrid on the south district
User1 User4 Distrib
ution box of user14
[image:8.612.197.392.88.190.2]Distrib ution box of user
[image:8.612.211.386.242.343.2]Figure 3. Basic electrical topology.
Figure 4. Power curves.
TABLE Ⅱ. TIME-OF-USE ELECTRICITY PRICE. Time Alternative time Price(yuan) Peak 14:00-17:00 19:00-22:00 0.96
Flat 08:00-14:00 17:00-19:00 22:00-24:00 0.58 Off-peak 00:00-08:00 0.29
Proceeds Distribution
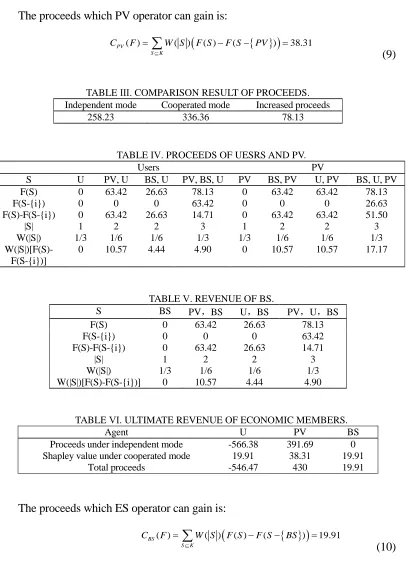
The results of the comparison of the independent and cooperative mode are shown in Table Ⅲ. The negative value presents cost, and the positive value presents proceeds.
As shown in Table 3, compared to the independent mode, the cooperation mode can bring more proceeds for the alliance. And the add proceeds should be allocated by Shapley method.
The allocation result is shown in Table Ⅳ-Ⅴ. The proceeds which user can gain is:
(8)
( ) ( ) ( ) ( ) 19.91
U
S K
C F W S F S F S U
[image:8.612.166.430.403.467.2]The proceeds which PV operator can gain is:
(9)
TABLE Ⅲ. COMPARISON RESULT OF PROCEEDS. Independent mode Cooperated mode Increased proceeds
258.23 336.36 78.13
TABLE Ⅳ. PROCEEDS OF UESRS AND PV.
Users PV
S U PV, U BS, U PV, BS, U PV BS, PV U, PV BS, U, PV F(S) 0 63.42 26.63 78.13 0 63.42 63.42 78.13
F(S-{i}) 0 0 0 63.42 0 0 0 26.63
F(S)-F(S-{i}) 0 63.42 26.63 14.71 0 63.42 63.42 51.50
|S| 1 2 2 3 1 2 2 3
W(|S|) 1/3 1/6 1/6 1/3 1/3 1/6 1/6 1/3
W(|S|)[F(S)-F(S-{i})]
0 10.57 4.44 4.90 0 10.57 10.57 17.17
TABLE Ⅴ. REVENUE OF BS.
S BS PV,BS U,BS PV,U,BS F(S) 0 63.42 26.63 78.13
F(S-{i}) 0 0 0 63.42
F(S)-F(S-{i}) 0 63.42 26.63 14.71
|S| 1 2 2 3
W(|S|) 1/3 1/6 1/6 1/3
[image:9.612.99.505.77.641.2]W(|S|)[F(S)-F(S-{i})] 0 10.57 4.44 4.90
TABLE Ⅵ. ULTIMATE REVENUE OF ECONOMIC MEMBERS.
Agent U PV BS
Proceeds under independent mode -566.38 391.69 0 Shapley value under cooperated mode 19.91 38.31 19.91
Total proceeds -546.47 430 19.91
The proceeds which ES operator can gain is:
(10)
It is obvious that the sum proceeds of three agents are equal to the total proceeds of alliance.
( ) ( ) ( ) ( ) 38.31
PV
S K
C F W S F S F S PV
( ) ( ) ( ) ( ) 19.91
BS
S K
C F W S F S F S BS
(11)
By Sharply distribution, the final proceeds of each agent are shown in Table Ⅵ. It can be seen that the cooperation model enhances the economic benefits of PV operators, ES operators and users.
CONCLUSIONS
Based on existing research and practical experience, microgrids are usually composed of multi-agents, including PV operators, ES operators and ordinary users. The new electricity reform program allows users with distributed power supply or micro-grid system to participate in power transactions, which is conducive to improving the economic benefits of each agent.
In the electricity market environment, this paper analyzes the market trading model of the agents in the PV-based microgrid, analyzes the power of forming the alliance, and puts forward the model of cooperative game between agents. The time-sharing scheduling model is used to optimize the real-time running status of each agent, and the Shapley method is used to distribute the proceeds according to the contribution of each agent. It can be concluded that the proceeds of PV operators, ES operators and users have been improved in the mode of cooperation, and the benefits of the parties have been balanced with each other, which is conducive to the development of PV-based microgrid project.
REFERENCES
1. Chen Zheng, Xiao Xiangning, Lu Xinyi. Multi-Objective Optimization for Capacity Configuration of PV-Based Electric Vehicle Charging Stations [J]. Transactions of China Electrotechnical Society, 2013, 28(7): 238-248. (in Chinese)
2. Kou Fenghai. Impact of distributed photovoltaic power sources on distribution network loss.[J] , :Power System and Clean Energy, 2011, 27(11): 62-68 (in Chinese)
3. Xiao Hao, Pei Wei, Kong Li, et al. Decision Analysis and Economic Benefit Evaluation of Microgrid Power output Considering Surplus Photovoltaic Power Selling to Grid[J], Automation of Electric Power Systems, 2014, 38(10): 10-16. (in Chinese)
4. Su Jian, Zhou Limei, Li Rui. Cost-benefit Analysis of Distributed Grid-connected Photovoltaic Power Generation [J], Proceedings of the CSEE, 2013, 33(34): 50-56. (in Chinese)
5. Li Zhe, Characterization research on LifePO4 batteries for application on pure electric vehicles [D]. Beijing, Tsinghua University, 2011.16-17,27,35-36(in Chinese).
6. Chen Youhua. A Kind of Cooperative Games Method Determining Weights of Combination Forecasting[J]. Prediction, 2003, 22(1): 29-32. (in Chinese)
7. Zheng Shiyuan. Advance Study on Cooperative Game Theory: Review on Study of Formation Mechanism and Stability of Coalition [J]. Journal of Shanghai Maritime University, 2011, 2(4): 53-59. (in Chinese)
8. Dai Jianhua,XueHengxin. Benefit allocation strategy of dynamic alliance partner enterprise based on Shapley value method [J]. China management science, 2004, 12 (4): 3-36. (in
1( )+ 2( )+ ( ) ( )
AC AC PV