Comparison study on AIS data of ship traf
fi
c behavior
Fangliang Xiao
a*, Han Ligteringen
b, Coen van Gulijk
a, Ben Ale
aaFaculty of Technology Policy and Management, Delft University of Technology, Jaffalaan 5, 2628 BX Delft, the Netherlands bFaculty of Civil Engineering and Geosciences, Delft University of Technology, Stevinweg 1, 2628 BX Delft, the Netherlands
Abstract
AIS (Automatic Identification System) data provides valuable input parameters in ship traffic simulation models for risk analysis and the
prevention of shipping accidents. This paper reports on the detailed analysis of AIS data for modeling purposes. This analysis is focused
on restricted waterways to support inland waterway simulations, comparing the differences between a narrow waterway in the
Netherlands (narrow waterway in the Port of Rotterdam) and a wide one in China (wide waterway of Yangtze River close to the Su-Tong
Bridge). It is shown that straightforward statistical distributions can be used to characterize position, speed, heading and interval times for
different types and sizes of ships. However, the distributions for different characteristics of ship behaviors for narrow and wide waterways
differ significantly.
Keywords: Ship traffic; Traffic simulation; AIS; Probabilistic risk model; Risk analysis
1.Introduction
This work was instigated by the increasing number of collisions between ships and bridges in busy waterways of China.
When ship traffic intensifies, like in the Yangtze River, bridges and other objects are at increased threat from the collisions
from ships. For risk analysis, the probability of the accidents can be estimated with probabilistic risk simulation model
based on multi-agent simulation and artificial force field-theory as developed in this research project.
The risk analysis has evolved considerably over the last decade. Originally, analytical methods were used to calculate the
probability of collisions, such as AASHTO model AASHTO (1998). Li et al. (2012) and Xiao et al. (2010) compared
analytical models and pointed out that these models lacked in the detailed description of the ship movements. Following the
first simulation approach by Davis et al. (1980), in recent years, simulation models have been developed to describe the
dynamic movement of ships in all kinds of situations (Goerlandt and Kujala, 2011; Montewka et al., 2011; Statheros et al.,
2008). Alternatively, dynamic ship movements can be simulated with manned ship-handling simulators (e.g. the Mermaid
500 at MARIN), but it requires experts to operate it and the equipment is expensive (Webster, 1992). The cheaper
alternative is to simulate ship movements based on Fuzzy Logic approach (Priadi et al., 2012), Bayesian Networks (Merrick
and van Dorp, 2006; Szwed et al., 2006), and Neural Networks (Łącki et al., 2012).However, these methods are still
dependent on expert opinions or other human interventions.
As opposed to expert opinions, this work is based on actual behavior of ships and their crews from historical data of the
AIS (Automatic Identification System) database. In order to make that possible, the first step is studying AIS data to unveil
the characteristics of real-life ship movement. The statistics of those characteristics can be further treated either as input of
simulation or as a way of model calibration and model verification. Different waterways are studied to compare the
similarities and differences. Here a Dutch waterway and a Chinese waterway are compared, to understand the unique
characteristics that are important to reflect realistic ship traffic simulation.
The characteristics of the ship traffic from the AIS data analysis will be used to generate input parameters at the
boundaries of the simulation model. Ship to ship interactions can be based on multi-agent simulation and artificial force
field. The concept of multi-agent modeling is adopted from Artificial Intelligence (AI) research, in which every agent
(simulated ship) will be treated as an intelligent individual who can make decisions and avoid collision based on its own
local circumstances. The maneuvering behavior of an agent (in this case, a ship) will be simulated separately from other
agents. The flow of agents in a given space (in this case a confined waterway) simulates shipping traffic in the waterway.
The ship avoidance maneuvers in encountering situations are based on the artificial force field theory, which is the second
one of the three obstacle avoidance behaviors introduced by Ribeiro (2005).
2.AIS data analysis: theory and method
AIS data is a precious resource for this research since it contains intricate data about ships maneuvers. The AIS data
analysis provides insight in ship traffic and forms the basis of the risk analysis. This section presents the results of statistical
AIS data analysis, and we also explain the method to further implement the results into ship traffic simulation and risk
areas and inland waterways), which can be used for safety assessment of the ship traffic in concerned waterways, or
improving safety and efficiency.
2.1.Introduction of AIS system
The AIS system transmits information of the sailing status of ships. It automatically broadcasts information from the
vessel to an AIS ship receiver or an on-shore receiver through VHF (Very High Frequency) in a limited geographical space.
That information includes ship positions (from GPS), ship course, ship heading, ship rotation angle, ship speed, loading
status, location and altitude of AIS antenna, ship type, navigation status, destination, time stamp, together with an unique
Identification number MMSI (Maritime Mobile Service Identity) (Harati-Mokhtari et al., 2007). This information can be
displayed on the monitor of other ships or VTS (Vessel Traffic Service) center. The received AIS data can be used for
additional lookout and collision avoidance onboard, and it also can be used in a VTS center for traffic safety and efficiency
by assisted target tracking. Moreover, nautical safety authorities also save the data for further research like accident
investigation or analyzing the traffic status. In addition, researchers use historical AIS data to study the characteristics of
vessel traffic to further improve safety and efficiency. Historical data analysis is used to lay the basis for a realistic
simulation of ship traffic in the confined waterway.
2.2.Recent study on AIS data analysis
Similar works on AIS data analysis to study the ship traffic were conducted for two different areas, the North Sea and the
Gulf of Finland. Mou analyzed AIS data in the North sea off the Port of Rotterdam (Mou et al., 2010). That study focused
on the correlation between Closest Point of Approach (CPA) and other ship characteristics like ship’s size, speed, and
course. De Boer (2010) presents the results of a case study around Maasvlakte I of the Port of Rotterdam, showing the
averaged vessel behavior and the influence of wind, current, and visibility on the ship traffic. Shen (2012) further examined
the patterns of the vessel traffic by comparing the ship traffic behavior in different locations.
A number of works were conducted in Finland to study AIS data and further utilize the data into ship traffic simulation.
Statistical analyses with figures and histograms were presented to represent the characteristics of the ship traffic in Gulf of
Finland. Those studies were evolved from Pedersen’s model, which was further adapted to the local geographical conditions
2.3.AIS data analysis in this study
A realistic simulation of ship behavior should be internationally applicable, because the ships are conducting
international transportation and conforming to international regulations. In this sense, the model evolved from a specific
area should be applicable in other places of the world. Possible similarities and differences of ship behavior resulting from
many influences should be identified, which include local regulation, behavior of officers on watch, and characteristics of
the waterway. After interpretation of ship tracks provided by AIS data, we derive information of ship traffic behavior that is
characterized by the mean values and statistical distribution of position, speed, heading, and time interval for different types
and sizes of ships.
In order to find those similarities and differences in characteristics of ship behavior, two typical busy waterways, which
are different in many aspects, are analyzed. Those two waterways are a channel of the Port of Rotterdam in the Netherlands
and a main passage of Yangtze River in China. There are many differences between those waterways. First, the part of
navigable channel of the Port of Rotterdam is about 270 m wide. And the part of navigable main passage in China is 890 m
wide, which is constrained by the main span of Su-Tong Bridge. Second, the channel of the Port of Rotterdam has traffic in
both directions without separation scheme. However, the main passage in China is divided into 4 traffic lanes, with two in
each direction with a separation zone. Third, the local regulation is different, which results in different ship behavior.
Besides those differences, we can also find some similarities. First, those two waterways are very busy, where large
numbers of ship passages every day are expected. Second, various ship types and a wide range of dimensions of ships are
sailing in both waterways. Third, the currents in both waterways are influenced by tide and river discharge. As a result, there
are inflowing currents and outflowing currents.
A realistic simulation of ship behavior should be applied in both cases, which should be able to reflect all those
differences and similarities of ship behavior in both waterways of the Netherlands and China. There are two steps in
studying the AIS data, we analyze the refined information derived from AIS data, and then we compare the similarities and
differences in both cases.
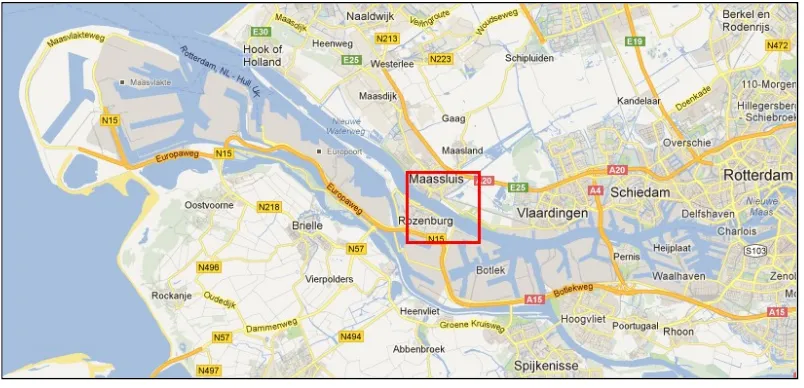
3.Case study results for waterway in the Netherlands
In this case, a nearly straight waterway in the Port of Rotterdam is chosen. The studied area is about 4 km length of
Maritime Research Institute (MARIN) provided the data and was kind enough to allow the use of their software “Show
Route” for the data analysis.
The software “Show Route” is able to transfer the raw AIS data into a database with a detailed dataset of the status of
ships. We draw crossing lines at regular intervals perpendicular to the waterway in “Show Route”, to which the AIS
information is transferred. These data can be sorted according to ship type and class (size), and analyzed by common
statistical methods.
In the following data analysis, only data samples with incoming ships are analyzed. The outgoing ships have the similar
characteristics as the incoming ships. Incoming and outgoing are specific expression for the direction of ship passages. A
vessel navigating with incoming direction means the ship comes into the waterway which leads the ship from the open sea
to the inside of the land or a port. On the contrary, an outgoing vessel is sailing to the sea. 28 months of AIS data from
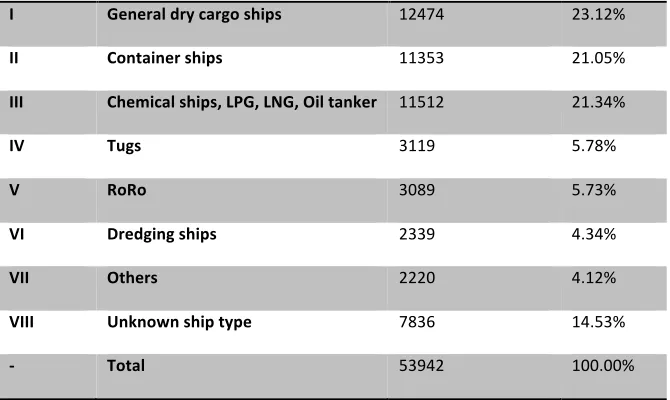
01/01/2009 to 01/05/2011 is collected for data analysis. The data analysis is conducted for different types of ships (Table 1),
however, with some exceptions only results of incoming containerships with category of gross tonnage less than 5100 GT
are selected to show in this paper (Table 2).
Fig.1 The studied area in the Port of Rotterdam
Table 1. Aggregated ship types with number of passages and percentage
[image:5.595.36.438.365.559.2]I General dry cargo ships 12474 23.12%
II Container ships 11353 21.05%
III Chemical ships, LPG, LNG, Oil tanker 11512 21.34%
IV Tugs 3119 5.78%
V RoRo 3089 5.73%
VI Dredging ships 2339 4.34%
VII Others 2220 4.12%
VIII Unknown ship type 7836 14.53%
[image:6.595.120.455.67.267.2]-‐ Total 53942 100.00%
Table. 2 Classifications for Incoming Container Ships
categories Class 1 Class 2 Class 3 Class 4 Class 5
Gross tonnage <5100 5101-‐12000 12001-‐20000 20001-‐38000 >38000
Number of passages 1978 6652 854 1448 419
3.1.Spatial distribution perpendicular to the water flow
Fig.2 shows the histogram of the lateral positions of container ships less than 5100 GT that was extracted from the AIS
database. The x-axis is the non-dimensional lateral distance from the centerline of the waterway (0 stand for position of
centerline, while 0.5 deviation stands for the position of starboard channel boundary), and the y-axis gives the fraction of
ship numbers. The histogram comprises 31 bars that cover 80% of the waterway width. As the navigable waterway width is
about 270m, each bar in the histogram covers a width of about 7 meters. So, the lateral distances between ships within each
histogram bar can be considered to be negligible. The graph shows that most of the ships were navigating on the right side
of the waterway. And most of the ship traffic prefers to stay closer to the centerline rather than to the bank. A small
proportion of ships navigate in the left side of the waterway, which is dangerous. The normal curve appears to fit the
histogram well (either you provide results for the statistical test or you reserve to ‘appears to stick’. And this normal
distribution can be further used to allocate lateral position of the ships generated at the boundary of a future simulation
[image:6.595.120.457.308.389.2]Fig.2 Spatial distribution for incoming containers (less than 5100 GT, 1978 passages)
3.2.Speed distribution of ships
Different ships maneuver with different speed, see Fig.3. This histogram comes from the crossing line 1, which is located
at the left boundary of the “study area” shown in Fig.1. A normal curve fits the speed histogram. Different speed of ships is
varied in a range from 5 kn to 15 kn, with a mean value of 10.7 kn and a standard deviation of 1.2 kn. And few ships are
navigating with a speed less than 5kn or larger than 15 kn. This means most of the ships do not navigate at full speed. And
the ships are expected to change speed based on different situations during passages.
A ship will navigate with a safe speed in the waterway, and under normal circumstances the chosen speed reflects the
safe speed in a specific situation. Especially in the busy channel, the OOW (Officer on Watch) should select a speed which
guarantees the safety of the ship. So, the ship speed is determined by many factors, such as experience of OOW,
characteristics of OOW, ship position, ship condition, ship dimensions, ship type, encountering situation, environment and
characteristics of the waterway. As a result, each ship will sail with its own speed which is required by the concept of “good
seamanship”, which results in the large variation of speeds.
3.3.Course distribution of the ships
As is shown in Fig.4, the courses do not vary much. The histogram of courses also fits to the normal curve with mean
value of 123 degrees and standard deviation of 1.8 degrees. This means that the courses of the ships do not change much
when the ships are sailing in the waterway. There are reasons for this phenomenon. First, the location of the case study is a
studied is narrow (about 270 m navigable width), and there is no room to change course significantly. Third, the only reason
for changing course is encountering situation. With the limitation on geographic scale of the waterway, ships may opt for
speed change to make safe maneuver to avoid collision, as what is shown in the speed variation in Fig.3.
3.4.Average speed in the waterway
Compared to the relative stable positions and courses, the ship speeds are constantly changing in the waterway. We
calculate the average speed in each category of ships on each crossing line. As can be seen in the Fig.5, the average speed
for ships in different categories is very different, which vary from 8kn to 12kn. The larger ships sail at smaller speed. All
ships increase speed in the channel, coming from a bend at the left boundary. But the speed decreases again before the next
bend.
The different speed choices for different ship classes are understandable. The speed change for a large ship is not an easy
task. It takes more energy and more time to increase the speed, compared with smaller classes, and it also takes longer to
decrease the speed. It would be very risky if the large ship needs to reduce speed suddenly in dangerous situations, when the
speed is too high. So, large ships prefer to maintain a “safe speed” to be on the safe side. Compared to large ships, small
ships have smaller turning circles (indication of maneuverability), which guarantee safe passages with certain speed. And
small ships also need less distance and time to decrease speed than larger ships. So, the speed choices of ships are
reasonably reflected in the graph, which should also be reflected in a realistic simulation.
Fig.4 Course distribution of the ships (incoming containerships less than 5100t, 1978 passages)
Fig.5 Average Speed of Incoming Container Ships
3.5.Traffic density
The traffic density affects the number of encountering situations, which further affects the safety level in the waterway.
The traffic density is described by number of ship passages in a certain time period, and time interval between two ships.
For example, if the number of ship passages per week is large, the traffic density is large. The time interval between the
passages of two ships is another measure for the traffic density in the studied area. If the time intervals are large, the number
of ships will be small. On the contrary, if the time intervals are small, we can expect dense ship traffic there. Consequently,
We can observe an increasing trend throughout the year and weekly fluctuation of number of ship passages in the studied
waterway (Fig.6). Two factors might be the reasons of the increasing trend in this economical rescission. One is that more
inland barges are installed with AIS equipment’s. The other factor is that the inland barges always have multiple shifts of
berth in the port for one voyage. The ship passages in different weeks are different. We divide the 730 days into 103 weeks.
Then we have Monday to Sunday in each week, as the incomplete weeks are deleted.
The proportion of ship arrival numbers per hour throughout the day in the period of two years, see Fig.7. The peak hours
will result in more frequent encounters, especially at 6 am and 14 pm. This phenomenon needs to be reflected in the
simulation.
The analysis of the AIS data (46140 ship arrivals in 2 years) shows exponential curve fits the histogram of time intervals
well, see Fig.8. A time range of 500 seconds is covered by each bar.
Fig.6 Ship arrivals on incoming direction in each week (103 weeks data)
Fig.8 Distribution of time intervals (46140 passages)
4.Case study results for waterway in China
In order to compare the similarities and differences of the ship behaviors, a Chinese waterway is selected to analyze the
ship behaviors in a same way. In this case, a nearly straight part of the Yangtze River (approximately 13 km long) is
selected which is close to the Su-Tong Bridge in Nantong city of Jiangsu Province, China. It is about 108 kilometers to the
mouth of Yangtze River. The crossing perpendicular to the river is 8146 m wide and the main waterway passes under the
Su-Tong Bridge, which has a main span of 1088 m. In order to keep the ships clear of the bridge, the navigable waterway is
designed to be 890 m, which is then separated into 4 traffic lanes and a 100 m wide separation zone. It was designed to
fulfill the navigational needs for 50,000 t container ships and 48,000 t convoys. The characteristics of the waterway and the
bridge are shown in Fig.9.
China MSA (Maritime Safety Administration of the People’s Republic of China) provided the AIS data for the case
study and was kind enough to provide other related information such as positions of navigational aids. In this case study, we
have analyzed data from 01/10/2010 to 06/10/2010. The collected AIS data lack information in ship type and tonnage, so we
cannot classify the ships in different types and sizes. But the LOA (Length Overall) for all the analyzed ships is below 100
m.
Fig.10 shows that the ship traffic under the Su-tong Bridge is quite busy, and the ships are within 500m range of each
other. So it is an interesting case study with dense ship traffic. Relevant local ordinances include the following. According
to the separation scheme of Jiangsu Waterway, the two “suggested waterways” are 200m wide traffic lanes (if available),
navigable for “very large ships” and “large ships”, the “suggested waterways” are specific for “small ships”. According to
the local regulations, “very large ships” are the ships (or convoys) which have a fresh water draught of more than 9.7m or
length more than 205m, or ships (convoys) with maximum height above water which is close to the height of the bridge and
overhead power cables, or ships (convoys) with restricted maneuverability. And “large ships” in the regulation are the ships
(convoys), which have a fresh water draught between 4.5m and 9.7m or length between 50m and 205m. “Small ships”, also
defined in the regulations, are the ships (fleet) with dimensions smaller than the “very large ships” and “large ships”. An
important ordinance factor is that overtaking is not allowed in the waterway near the bridge area.
Fig.9 Characteristics of the waterway and location of the bridge
4.1.Spatial distribution perpendicular to the channel
As a consequence of the local ordinances, the ship traffic is separated into 4 clusters by the separation scheme. The two
clusters in the middle are positions of “large ships” and “very large ships”, the two clusters on the sides are positions of
“small ships”. Taking the “large ships” with incoming direction for example, Fig.11 shows the extracted histogram of ship
positions in the specific separated traffic lane for incoming “large ships”. The x-axis is the non-dimensional lateral distance
from the center of the separated traffic lane, and the y-axis gives the fraction of ships. Comparing to the Dutch case, the
ships are navigating in the middle of the separated traffic lane, and the ships spread more in the whole width available.
Further, the normal curve also fits these histograms.
4.2.Speed distribution of ships
The speed of the ships under the main span of the bridge is very different in the waterway. Sea-going ships proceed with
larger speed than the inland ships. On the whole, a normal curve fits well to the histogram of ship speed, ranging from 3 kn
to about 18 kn, with a mean of about 9 kn and standard deviation of 2.9 kn, see Fig.12. Comparing to the Dutch case, the
speed of ships is lower, and the speed choices in this case show larger variations.
4.3.Course distribution of the ships
The courses are distributed with a range of 30 degrees, which is different from the Rotterdam case with 10 degrees range.
This means that the ships have more freedom for maneuvering, and they divert much more than in the Dutch case, see
Fig.13. The reasons for the difference could be that the width of the waterway is very large and the ships do not have a real
river bank on starboard. And the current in the Yangtze River is very complex. The cross current can influence the paths of
ships into different courses.
4.4.Average Speed in the waterway
In Fig.14, the average speed of incoming ships and outgoing ships along the track are shown. The x-axis is the
longitudinal position with the crossing line numbers. The y-axis stands for the average speed of the ships. The crossing lines
are at 1000m distance from one another. On a whole, the outgoing ships have a larger speed and are showing little speed
line 1 and crossing line 7. The reason could be that the waterway in this area is relatively straight, and the ships increase
speed in this area, which is similar to the Dutch case.
Fig.11 Spatial distribution under the main span for incoming “large ships” and “very large ships” (719 passages)
Fig.13 Course distribution (incoming ships with 1197 passages)
Fig.14 Average speed of ships on incoming direction and outgoing direction
4.5.Traffic density
The proportion of ship arrival numbers per hour throughout the day in the period of 6 days, see Fig.15. There are also
differences in different hours. However, comparing to the Dutch case, the peak hour is different and this phenomenon
maybe influenced by tide, because many sea going ships need high tide for larger water depth in the Yangtze.
The normal curve fits the histogram of time intervals between two consecutive ships, based on six days of AIS records
(1216 ship passages), see Fig.16. We count the number of ships in intervals of 50 seconds, and finally get the histogram.
The x axis is the time interval(s), and the y axis is the number of ships in certain time interval. After regression analysis, we
normal fit proved to be better. This discrepancy may be caused by the limited data analyzed in this case. The time intervals
in the Chinese case are much smaller than the Dutch case, which reflects a difference in traffic load.
5.Comparison of results
From the analysis, we can see similarities and differences in ship traffic characteristics when comparing the Dutch case
and the Chinese case.
On the one hand, similarities are the following. The ship positions, speeds, courses, and time intervals conform to certain
distributions, which can be used to describe the ship traffic. The normal distribution fits the ship position, the same applies
to ship course and ship speed. The time intervals between two consecutive ships are tested to fit to the exponential
distribution and part of normal distribution. These distributions form the basis for input of the ship traffic in future
simulations.
Fig.15 Hourly proportion of ship arrivals during the day (1223 passages)
On the other hand, differences are the following. First, in ship spatial distribution of the Dutch case, there are ships that
trespass the centerline. However, the incoming and outgoing ships under the Su-Tong Bridge do not deviate from their own
lane, which is the result of separation scheme and local ordinances. Second, the speeds of the ships in Rotterdam are
relatively higher than the same near the Su-Tong Bridge. One of the reasons is that overtaking is not allowed in the
waterway of the Su-Tong Bridge, which forces the ships to navigate with a lower speed. Another reason is that the traffic
volume in Yangtze is larger, as the ships choose to slow down for safety reasons. Third, the room for the ships to change
course is different. The course variation of ships in Dutch case is only 10 degrees. However, the course of the ships can be
different within 30 degrees in Chinese case. The reason is that the navigable width of the waterway is larger compared to
Rotterdam. Fourth, the time intervals between two consecutive ships are smaller in the Chinese case, which is because the
daily volume of ship traffic is much larger. Last but not least, the speed change throughout the waterway is different. The
speed change depends on the ships, the characteristics of the waterway, and different regulations. That means that the
reasons for different speeds are not so easily predicted in simulations to come.
6.Conclusion and discussion
This research presents AIS data analysis to deepen our understanding about the ship traffic in the waterway. This
understanding is important when realistic ship traffic simulations are performed later on in this work and for maritime risk
analysis. Some dynamic values (position, speed, course, time interval) of ship AIS information are analyzed, and the values
are presented in a statistical way to describe the characteristics of the ship traffic. The similar characteristics indicate that it
is reasonable to use statistical methods to describe the behavior of the ship traffic in both cases. And these statistical
distributions can provide a sound basis for simulation in the next stage of research. The differences between Dutch case and
Chinese case indicated the possible factors that can influence the behavior of the ship traffic. Regardless of their origin, the
different characteristics of ship traffic need to be reflected in the simulation.
The data analysis at this stage only concerns the direct information. There is other indirect information beyond this
analysis that is also important to describe the ship traffic, including ship interaction, human factor, and ship response to
navigational environment. For the ship interaction part, it refers to head-on situation, overtaking situation, ship avoidance of
objects and grounding, and avoidance behavior of crossing section. Those interactions are individual behavior as a result of
Acknowledgements
This work was supported by China Scholarship Council and Delft University of Technology under the Joint Program for
Training Doctoral Students (Grant Number: 2009103788). MARIN is gratefully acknowledged for access to the Dutch AIS
database.
References
AASHTO, L., 1998. Bridge design specifications. American Association of State Highway and Transportation Officials, Washington, DC.
Davis, P., Dove, M., Stockel, C., 1980. A computer simulation of marine traffic using domains and arenas. The Journal of Navigation 33 (2), 215-222. De Boer, T., 2010. Application of AIS data in a nautical traffic model, Hydraulic Engineering. Delft University of Tecknology, Delft University of Tecknology.
Goerlandt, F., Kujala, P., 2011. Traffic simulation based ship collision probability modeling. Reliability Engineering & System Safety 96 (1), 91-107. Harati-Mokhtari, A., Wall, A., Brooks, P., Wang, J., 2007. Automatic Identification System (AIS): data reliability and human error implications. Journal of navigation 60 (3), 373.
Kujala, P., Hanninen, M., Arola, T., Ylitalo, J., 2009. Analysis of the marine traffic safety in the Gulf of Finland. Reliability Engineering & System Safety 94 (8), 1349-1357.
Łącki, M., Weintrit, A., Neumann, T., Formela, K., Kalina, T., Piala, P., Boykov, A., Katenin, V., Demchenkov, O., Gucma, L., 2012. Neuroevolutionary Ship Handling System in a Windy Environment. International Journal on Marine Navigation and Safety of Sea Transportation 6 (4), 453-458.
Li, S.Y., Meng, Q., Qu, X.B., 2012. An Overview of Maritime Waterway Quantitative Risk Assessment Models. Risk Analysis 32 (3), 496-512. Merrick, J.R.W., van Dorp, R., 2006. Speaking the truth in maritime risk assessment. Risk Analysis 26 (1), 223-237.
Montewka, J., Hinz, T., Kujala, P., Matusiak, J., 2010. Probability modelling of vessel collisions. Reliability Engineering & System Safety 95 (5), 573-589. Montewka, J., Krata, P., Goerlandt, F., Mazaheri, A., Kujala, P., 2011. Marine traffic risk modelling - an innovative approach and a case study.
Proceedings of the Institution of Mechanical Engineers Part O-Journal of Risk and Reliability 225 (O3), 307-322.
Mou, J.M., Tak, C., Ligteringen, H., 2010. Study on collision avoidance in busy waterways by using AIS data. Ocean Engineering 37 (5), 483-490. Priadi, A.A., Tjahjono, T., Benabdelhafid, A., 2012. Assessing Safety of Ferry Routes by Ship Handling Model through AHP and Fuzzy Approach. Intelligent Information Management 4 (25), 277-283.
Ribeiro, M.I., 2005. Obstacle avoidance. Institute for Systems and Robotics, [Online], Available: http://citeseerx.ist.psu.edu/viewdoc/download?doi=10.1.1.66.6446&rep=rep1&type=pdf, 1-14.
Shen, W., 2012. A statistical analysis of average vessel behaviour by AIS data, UNESCO-IHE Institute. UNESCO-IHE Institute, UNESCO-IHE Institute. Statheros, T., Howells, G., McDonald-Maier, K., 2008. Autonomous ship collision avoidance navigation concepts, technologies and techniques. Journal of navigation 61 (1), 129-142.
Szwed, P., van Dorp, J.R., Merrick, J.R.W., Mazzuchi, T.A., Singh, A., 2006. A Bayesian paired comparison approach for relative accident probability assessment with covariate information. European Journal of Operational Research 169 (1), 157-177.
Webster, W.C., 1992. Shiphandling simulation: Application to waterway design. National Academies Press.
Xiao, F.L., Ale, B., Jagtman, E., 2010. Overview of Methods on Modeling Risks of Ship in the Presence of Bridge. Progress in Safety Science and Technology, Vol. Viii, Pts a and B 8, 1905-1916.