ISSN: 1992-8645 www.jatit.org E-ISSN: 1817-3195
DANGEROUS GOODS OF RAILWAY TRANSPORT ROUTE
OPTIMIZATION BASED ON MULTI-OBJECTIVE
PROGRAMMING AND IMMUNE ALGORITHM
1YIHAI TIAN,2LIANG WU,2XIN LU,2SULONG CAO,2DEYANG KONG
1
Department of Continuing Education, Lanzhou Jiaotong University, Lanzhou 730070, Gansu, China
2Department of Traffic and Transportation, Lanzhou Jiaotong University, Lanzhou 730070, Gansu, China
ABSTRACT
The dangerous goods transportation plays a great role in the area of railway transportation research, the whole process of dangerous goods transport involving multiple assignments links, which interplays with each other. The existing path optimization is one of important means to ensure transportation safety. This paper through the analysis of the characteristic of dangerous goods and the special operation process in the railway transportation, putting forward to three objective functions to reducing safety coefficient and transportation time and improving transport income, creating 0-1 integer nonlinear multiple objective programming model, using immune algorithm to find the solution to the model. At last , through an example using the method effectively selecting a specific route and optimizing the process of railway dangerous goods transportation.
Keywords:0-1 Nonlinear Integer Multi-objective Programming Model, Immune Algorithm, Specific Route
1. INTRODUCTION
With China's rapid economic growth and people's living standard unceasing enhancement, the need to transport dangerous goods’ varieties and quantity is increasing rapidly and all kinds of transportation accident increases year by year. So, ensuring the safety of dangerous goods is vital important. Dangerous goods transport path optimization is an important measure to improving the safety.
Considering the special organization model of the dangerous goods railway transportation (prior to set the dangerous goods into direct or through train, keep on running without any adaptation operations), so the transportation route choice will become very important.
At present, domestic scholars mainly research on the problem of route optimization of dangerous goods rail transportation. Literature[1] optimizes the route using multi-objective programming method, setting the path length, time, cost, risk, sensitive target number as target functions.
Literature[2] has a quantitative research on the railway transport risk, creating the accident
probability model and listing seven influencing factors of the transport ways and distance, the accident probability of loaded car section per kilometer, every train compositions truck number, the number of freight cars marshalling in a train, the number of dangerous goods cars , the leakage probability, the area of leakage influence and the population density in the influential area.
Literature[3] creates evaluation system using the fuzzy layer comprehensive evaluation method, considering the factors of cost in the process transport route selection, accident risk, accident hazards, accident repair ability.
Literature[4] have a conclusion that leak in the process of transportation is divided into two kinds, traffic accidents cause by the leakage and the leakage caused by traffic accidents, and points out the leak rate in the two cases showing a greater difference .
2. ANALYSIS OF PROBLEM
Railway transportation route falls into three kinds according to the distance: the shortest route, the specific route and the circuitous route; according to the economic benefit division into economic route and non-economic route. Considering the safety of dangerous goods transportation, need us to select specific cuts. Specific route choice generally needs special criteria.
Safety is the most important in the dangerous goods railway transportation. Safety is a evaluation criteria of much homework and many index. All kinds of regulations and organizational measures of dangerous goods is to reduce the operation link, or replace one risk factor of high operation. In choosing route first concern is the interval operating condition; In addition, is influence, once dangerous goods leak, keeping the accident harm to the minimum.
Secondly, ensuring the highest income. Income here refers to the unit weight of dangerous goods. transport process of an income. Income of Dangerous goods comes from transportation. The operation cost is the result of spending indexes adding (the calculation of income here refers to the transportation in the safe situation).
Finally, requiring the dangerous goods transportation in the interval operation and transfer station operation time more short more good from the view of running time. At present, as long as the loading to the station of arrival traffic group number, then in the dangerous goods basic will into direct or through train. However, when loading station to landing station without traffic group number, there are two points needing to pay attention: the first, in one adjustable transit operation to reach the station as far as possible; the second, choice technical operation time at least or less technical stations do the adjustable transit operation.
3. CREATING MODELS
3.1 Format of Manuscript
I—the set of all dangerous goods types which
can deal with railway transport .
J—the interval set of all paths from the station
of departure to the terminal.
L—the interval path length set of dangerous
goods transportation.
D—the set of all technical stations except the
terminal station on the path.
U — the set of traffic group number in
technology station.
T —the time set of dangerous goods in the
interval operation.
T' — the time set of Various technical
operations for dangerous goods in D.
H —the expenses set of dangerous goods
transportation .
H' — the cost set of dangerous goods
transportation.
T0—the time limit for delivery.
N — the ability of interval through(the
number of the trains).
K—the leakage accident in the interval.
j i l
—the interval length of the interval j.
q ja( )
—the rate of the type of whether a in the
interval j.
r j( )—the population density of the interval j.
pi( )j — traffic accident probability of
dangerous goods i in the interval j.
pi( ,j k)—the leakage rate of dangerous goods
i in the interval j.
αj
—the proportion of Passenger Cars to
freight cars in the interval j.
σ —the factor of Distance cost .
κ
—the factor of time cost .wη
—the total number of ramp in intervals .
w0—the restricted ramp.
gi—the weight of interval dangerous goods i .
t0—the total time of dangerous goods staying
ISSN: 1992-8645 www.jatit.org E-ISSN: 1817-3195
tij
—the operation time of dangerous goods i
in the interval j.
'
id t
—the staying time of dangerous goods i in
the adjustable transit technology station .
''
id t
—the staying time of dangerous goods i in
the un-adjustable transit technology station .
Xij
—is a 0-1 variable;
0 refers to dangerous goods i is not on the path j; 1 refers to dangerous goods i is on the path j; Among ,
i
=1,2,3…m
,i
∈
I
;j
=1,2,3…n,j
∈
J
.iu
y
—is a 0-1 variable;
0 refers to dangerous goods i do not enter into the traffic group j;
1 refers to dangerous goods i enter into the traffic group j.
'
iu
y
—is also a 0-1 variable;
0 refers to the traffic group j is not the arrival station of dangerous goods i ;
1 refers to the traffic group j is the arrival station of dangerous goods i ;
u =1,2,3…
e
,u∈U .3.2 Objective Function
The first objective function is to keep the risk of safety as low as possible in the transport of dangerous goods.Safety risk is one of the most difficult factors to analysis, involving many aspects and multiple parameters, including the specific accident probability, the interval train logarithm, line length, the weather, traffic flow structure, line status and interval population density. Among them,the incident ratepi( )j 、
( , )
i
p j k and weather condition qa(j)can calculate
the probability through the way of probability statistics;line lengthl 、traffic structureα j 、
interval population density r( )j getting through consulting relevant material;Line condition is the
situation of road and bridge, culvert and curve slope on the path. Above-mentioned influence factors can be converted into additional gradient ramp.
Figure 1: The Unit Additional Slope
As shown in figure 1, the unit additional slope as :
1 0 0 0 = s in
( )
W w
g P G
β θ
β + (1)
Additional gradient curve is:
7 0 0 ,
w R is r a d iu s o f c u r v e R
χ = (2)
Additional tunnel air slope is:
2
0.0001 ( lim )
0.13 ( -lim )
l v the ited scope w
l un ited scope
δ δ δ
δ
=
(3)
Add ramp forwη=wβ + wχ + wδ ,the unit is
per mille.The result of multiply all factors above is the risk factor f1 in a certain interval,which is the
smaller the better.
The second objective function is to keep the transportation time as short as possible. Time can be represented by three parts,including adjustable
transit time,through time without adjustment and
interval operation time. The different between dangerous goods transportation and general cargo transportation is that the goal of dangerous goods transport is go do distance so far so good in one loading .( if the loading station is the station of arrival traffic group number, then dangerous goods enter into straight or direct train,else ,the
requirements in the midway having adjustable transit times fewer is better).In the condition of the same time of adjustment, decrease car hours as far as possible in the transport of dangerous goods .
s
is a positive integer, represents the total of stations on the transportation path.1 1 1
1 1
( ) ( , ) ( ) ( ) m i n =
m n
i j i i j j a j
i j
m n
i j
i j
x p j p j k N l w q j r j f
x
η α
= =
= =
• • • • • • • •
∑ ∑
∑ ∑
(4)
' ' ''
2 0
1 1 1 1 1 1 1 1
m in = ( 2 )
m n s m e s m e
d d d
ij ij iu iu id iu id
i j d i u d i u
f x t y y t s y t t
= = = = = = = =
+ + − − +
∑ ∑
∑ ∑ ∑
∑ ∑ ∑
(5)
( )
- cos( )
incom e freight j t j
f = f l f l (6)
As expression (6) shows,freight fcost
( )
lj is:( )
= ( i + i )freigh t j dep art running j i
f l h h ×l ×g (7) According to the literature [7], it is known that the transportation cost as a function hard to be quantified , the influenced factors including traffic volume, structure of freight and passenger flow , transportation distance and freight balance. Railway transportation cost is mainly composed of originating and reach operating expenditure, transit operation expenditure and operation operating expenditure. The proportions of operating expenditure in these three parts is the largest, although the total operation cost will be decreased
with the increasing distance, the transfer cost and arrival and departure cost does not increase with the reducing unit cost. The operation process of each link is divided into different technical indicators, multiplied by the respective parameters, linear adding for the result of total cost. Due to the arrival and departure link’s shunting locomotive operation cost combined with the vehicle operating cost; the locomotive operation interval distance combined with the distance and the interval locomotive running time cost combined with the vehicle running time cost , the calculation mentioned in this article for each ton-km costs, the total weight of goods will not be considered.
3.3 Constraint Conditions
The constraint conditions of objective functions(4)、(5)、(9)are :
(8)
The goal of the objective function three is for the highest unit profit in the rail transportation process of dangerous goods:
x
ij≤
y
iu (11)'' '
id id
t
t
(12), 1 ,
1 1
m m
B B
j d j d
j j
l + l
= =
≤
∑
∑
(13)(9)
(10)
( , ) [0,1]
i
p j k ∈ ,
∀
j
(14)( ) [0,1]
i
p j ∈ ,
∀
j
(15)[1, ]
a∈ b (16)
0
κ > ,
σ
>0 (17) 0j
l > (18)
0
w
η≤
w
(19)b
is the total of all kinds of adverse weather.Constraints (10) means that the transportation time
' ' ( 2 )''
0
'
1 1 1 1 1 1
cos
1 1 1 1
s m e d d s m e d y y t t s y t
iu iu id iu id m n m n
d i u d i u
f l x t x
t j l g i j ij ij i j ij g
j i i
σ
κ κ
+ + − −
∑ ∑ ∑ ∑ ∑ ∑
= = = = = = = + ∑ ∑ + ∑ ∑
= = = =
'
1 1
m n ij ij
i j i
x t g σ κ
= =
ISSN: 1992-8645 www.jatit.org E-ISSN: 1817-3195
strictly control in the limit of freight transit period. Type (11) shows dangerous goods traffic must in an effective path. Type (12) indicates the time of no change through should be far less than adjustable transit. Constraints (13) is to prevent roundabout transport. Constraints (14) (15) (16) (17) (18) define all probability, cost factor, time and interval length greater than 0. Constraint(19)makes the the adding ramp cannot exceed r-rated ramp.
3.4 Model Optimization
The general method of multi-objective optimization model converts multiple objective function to single objective function(conversion the objective functions f1、f2 、 f3 to the single
objective function) Give three different weighted valuesλ1、λ2 、λ3 for the objective functions
1
f 、 f2、 f3, as following:
3 3 1 1 2 2 F = λ f −λ f −λ f
(20)
Give λ1、λ2、λ3different values according to
the importance in the process dangerous goods transport: first is the safety, then the highest income, and finally is the shortest time.
4. ALGORITHM AND STEPS
The model of dangerous goods railway transport path optimization in this paper uses 0-1 integer nonlinear model(MSLSLP). Due to this kind problem including many variables and parameters, solve it by the traditional operational research method is very complex.
Step1:random generation initial father generation population, forming antibody;
Step2: more prior knowledge extraction vaccine; Step3:current population in affinity calculation, memory cells begin to differentiation.If the current population contains the best individual, the algorithm stop running and output, otherwise continue;
Step4: cross operation for the father generation populations ;
Step5: mutation operation for the father generation population;
Step6: vaccinated operation for the current father generation population ;
Step7: immune selection operation for the current father generation population, updating the population to get new antibody, return to step 3;
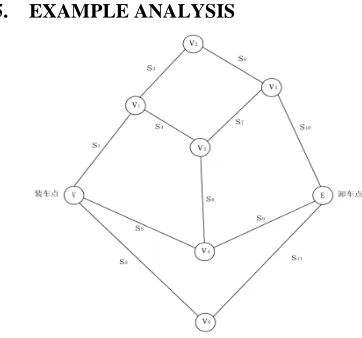
[image:5.612.320.501.194.363.2]5. EXAMPLE ANALYSIS
Figure 2 Example Network Diagram
Pictured above , network diagram S which composed by station and interval represents traffic interval,V represents the station. The railway
network totally composed by 8 stations and 11 intervals. All interval are double-line automatic block and the interval operation time includes avoiding time to passenger train and luggage train time. The railway network from V to E composed of 4 complex cross ring. ( the four rings respectively are:V —V1—V3—V4,V1—V2—
5
V —V3 ,V3 —V5—
E
—V4,V —V6 —E —4
V ) Dangerous goods are loaded in V ,carried
to E ,then unloaded. Statistics of all kinds of factors influencing interval safety using forms mode , as is shown in table 1.
Interval accident rate pi( )j is difficult to
statistics in a specific interval. The average rate in the last ten years according to the statistical data,
is three times per ton-km ,accident leakage ratepi( , )j k taking the average 30% and the sum
of loading time and Truck assembly time in the loading station V is t0 =15 hours with traffic
through from V to E adjustable transit time as
shown in table 2.
The cost of arrival operation, departure operation and transit operation are decided by the quantity of work ,which is to be calculated by the specific operation time.Take cost factor
κ
、κ
'andσ
as0.08 yuan per tons hour, 0.002yuan per tons hour, 0.005yuan per tons hour.
[image:6.612.92.522.193.566.2]Dangerous goods is divided into nine categories by railway administration,the diffset screening one specific dangerous good from the nine categories and the commodity name and freight number as shown in table 3.
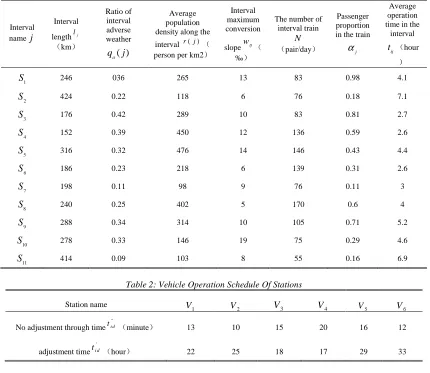
Table 1: Dangerous Goods Transportation Interval Related Information
Interval namej
Interval
lengthlj
(km)
Ratio of interval adverse weather
( )
a q j
Average population density along the
interval r(j)( person per km2)
Interval maximum conversion
slopewη( ‰)
The number of interval train
N (pair/day)
Passenger proportion in the train
j
α
Average operation time in the
interval
ij t (hour
)
1
S 246 036 265 13 83 0.98 4.1
2
S 424 0.22 118 6 76 0.18 7.1
3
S 176 0.42 289 10 83 0.81 2.7
4
S 152 0.39 450 12 136 0.59 2.6
5
S 316 0.32 476 14 146 0.43 4.4
6
S 186 0.23 218 6 139 0.31 2.6
7
S 198 0.11 98 9 76 0.11 3
8
S 240 0.25 402 5 170 0.6 4
9
S 288 0.34 314 10 105 0.71 5.2
10
S 278 0.33 146 19 75 0.29 4.6
11
S 414 0.09 103 8 55 0.16 6.9
Table 2: Vehicle Operation Schedule Of Stations
Station name V1 V2 V3 V4 V5 V6
No adjustment through time ''
i d
t (minute) 13 10 15 20 16 12
adjustment time '
i d
t (
hour) 22 25 18 17 29 33
Table 3: Dangerous Goods Name Of Commodity And Freight number list
Classes Explosive materials
Compress ed gases
and liquefied
gases
Flammabl e liquid
Flammable solid, items
and spontaneous
combustion in wet flammable
items
Oxidizin g substanc
es and organic peroxide s
Poisons and infectious substances
Radioacti ve substance
s
Corrosive
s Else
Name of Goods
detonatin g fuse
liquefied petroleum
gas
gasoline sulphur oxydol chloroform
Thorium sulfuric acid
nitric acid castor bean
Freight
[image:6.612.103.537.589.732.2]ISSN: 1992-8645 www.jatit.org E-ISSN: 1817-3195
The transportation fare of N0.5 arrival and departure basic price
i
h 发 is 10.40 yuan per ton,
basic operation price
i
h 运 行 is 0.0549 yuan per ton km. The transportation fare of N0.6 arrival and departure basic price
i
h 发 is 14.80 yuan per ton,
basic operation fare
i
h运 行 is 0.0765 yuan per ton
km.
In this diffset,defining loading station V as
8
V ,unloading station E as V7 ,Other depot’s
subscript digital code unchanged.
Any path from loading station V8 to unloading
station V7 constitutes the immune algorithm of
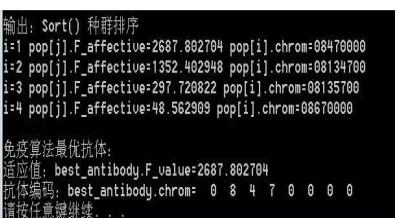
antibodies. In this mathematical model, the objective function F is the antigen, crossover probability taking 0.7, mutation probability taking 0.02, Memory bank number for 20, the antibody population scale is 50, the largest number of un-optimization algorithm is 2000 times, finally,the output of program as following :
[image:7.612.94.293.377.486.2]Figure 3 Output Chart Of Immune Algorithm Program
The result show the optimal path is{0,8,4,7,0,0,0,0,0},that the path V —V4 —
E is optimal. In order to adjust the objective function with every sub-function to be unified order of magnitude,taking λ1 、 λ2 、 λ3 as
0.5,0.15,0.35 × 10, The optimization functionF = 2 6 8 7 .8 0 2 7 0 4.
6. CONCLUSION
The paper analyses the dangerous goods railway transport path optimization problems in quantity , creating the model of 0-1 nonlinear integer multi-objective programming, using immune algorithm to computing the result. The result shows in dealing with this kind of problem the method can help quickly reaching the global optimal. This paper during the optimization model taking the
three objective function respectively as three weight value, their accuracy need to be further discussed.
ACKNOWLEDGMENTS
The authors wish to thank the references for his helpful comments and suggestions for improvement. This paper is supported by the Chinese State Social Science Fund Project (11CJY067) and Chinese Ministry of Education Humanities and Social Sciences project (10YJA630126) and Natural Science Foundation of GanSu province (1107RJYA070 、
1208RJZA164).
REFERENCES
[1] Lichen-Shi etc, “The road transport of dangerous goods more target path optimization method ”,China's production safety science and technology, Vol. 5,2006, pp. 59-63.
[2] Jinmei-Xiao etc, “The railway transport of dangerous goods risk quantitative study”,Railway transport and economic, Vol.
10, 2010, pp. 66-75.
[3] Haixing-Wang etc, “Railway dangerous goods transport route choice strategy”, Journal of Beijing jiaotong university, Vol. 55, No. 6,
2009,pp.27 ~ 30.
[4] Daian-Li etc, “China's railway transportation cost calculation system”, Journal of railway, Vol. 6,
1999, pp.96-100.
[5] Li-Zhang etc, “2006-2007 dangerous chemical transportation accident analysis”, journal of safety production science and technology,
Vol.6, 2008, pp.74-78.
[6] Kaiqi-Xu etc, “Based on people - machine - environment system engineering military railway transport of dangerous goods risk evaluation”, Journal of military traffic institute,
Vol. 3,2009,: pp.18 - 21.
[7] Manish Verma, “Railroad transportation of dangerous goods:population exposure to airborne toxins”, Computers &Operations Research, Vol. 37, No. 52004, pp.
1287-1330.
[8] Lpcio Bianco, Massimiliano Caramia and Stefano Giordani, “A Bilevel Flow Model for Hazmat Transportation Network Design”,
Transportation Research: Part C, Vol. 12, No.