STATE DIAGRAM FOR CONTACT
-INHIBITION
OF PROLIFERATION: A QUANTITATIVE
FRAMEWORK FOR MODULATING GROWTH
P
ATTERNS IN EPITHELIAL CELL CLUSTERS
Thesis by
Jin-Hong Kim
In Partial Fulfillment of the Requirements
For the Degree of
Doctor of Philosophy
California Institute of Technology
Pasadena, California
2010
ii
© 2010
Jin-Hong Kim
iii
Acknowledgements
First, and most importantly, I would like to thank my advisor, Prof. Anand Asthagiri, for his guidance, inspiration, and encouragement throughout my graduate study. His breadth of knowledge and dedicated enthusiasm to science have guided me
to conduct this project with interest and motivation. All that he taught me during these years will be invaluable assets throughout my career as a scientist.
I am grateful to Prof. David Tirrell, Prof. Elliot Meyerowitz, and Prof. Chin-Lin Guo for allowing their valuable time to serve on the committee. Their critical
comments and insights were tremendous help to the improvements and completion of this study.
Thank you to the past and current members of the Asthagiri group, Claudiu Giurumescu, Nicholas Graham, Niki Galownia, Stephen Chapman, Ehsan Jabbarzadeh, Melissa Pope, Keiichiro Kushiro, Paul Minor, and Larry Dooling. I am thankful to their
technical assistances for helping me with many aspects of my research, and more importantly to their friendships that made my time in Pasadena very memorable one.
I also want to acknowledge my collaborator, Jacob Notbohm, for working with
iv All my love and thanks to my parents, my two sisters, Hye-Yeon and Hye-Jeen, and my grandmother. It was their unfailing love and trust that enabled me to accomplish
v
Abstract
Cell-cell contacts play a key role in the assembly and integrity of epithelial tissues. Cell-cell contact is not only a mere physical link between neighboring cells, but also a critical regulator of many cell behaviors including proliferation. Contact-inhibition of
proliferation is a hallmark of normal epithelial tissues. Cancer development involves the loss of this key constraint. Both biochemical and physical mechanisms mediating contact-inhibition are emerging. A current, principal challenge is elucidating how the
integrated performance of these mechanisms enforce or modulate contact-inhibition in a rich microenvironment that includes multiple, potentially conflicting cues such as soluble growth factors (GFs) and extracellular matrix (ECM).
Here, we propose a quantitative paradigm for contact-inhibition of proliferation. Our quantitative analysis of single cells within multicellular aggregates reveals that epithelial cells transition from a contact-inhibited to contact-independent mode of
proliferation at a critical threshold EGF level. This transition point is a tunable property
and can be modulated by varying the level of cell-cell contact. Furthermore, the
proximity to this transition point is a quantitative gauge of “degree” of contact-inhibition. Using this metric, we demonstrate that stiffening the adhesive matrix, a widely observed phenomenon during cancer development, leads to the quantitative, progressive reduction
vi to induce population-wide proliferation. Our results reveal that the potent effect of substratum compliance on contact-inhibition involves changes in contact-maturation and multicellular mechanics. The proposed quantitative model of contact-inhibition
vii
Table of Contents
Acknowledgements……….iii
Abstract…………..………..v
Table of Contents…………..………...vii
List of Figures……….……….ix
Chapter I. Introduction……….……...I-1 References………...I-5
Chapter II. Tunable interplay between epidermal growth factor and cell-cell contact governs the spatial dynamics of epithelial growth……….II-1 Abstract……….II-1
Introduction.………..II-3 Results and Discussion……….………….II-5
Materials and Methods……….………II-20
Acknowledgements……….……....II-22
References……….………..II-23 Supporting Information……….……..II-26
Chapter III. Substratum stiffening promotes the quantitative, progressive loss of
contact-inhibition of proliferation……….……….III-1 Abstract……….…………...III-1
viii Results……….III-6 Discussion………..III-20
Materials and Methods……….……….……….III-24
Acknowledgements………..……..III-26 References………..……III-27
Supporting Information……….……….……III-30
Chapter IV. Substratum compliance and EGF co-regulate spatial patterns in traction forces, cell shape, and proliferation within epithelial multicellular clusters…….…IV-1 Abstract………...IV-1
Introduction……….IV-3
Results……….IV-5 Discussion………..IV-15 Conclusions………….………...IV-17
Materials and Methods………...IV-18
References………..IV-21
Appendix I. Intercellular mechanotransduction during multicellular
morphodynamics………...AI-1
ix
List of Figures
Chapter II
Fig. 1. E-cadherin-mediated contact-inhibition triggers spatial patterns in cell cycle activity only when EGF depletes to a threshold concentration……….II-7 Fig. 2. Selective attenuation of Erk, but not Akt, among interior cells correlates with
contact-inhibition………..II-11 Fig. 3. A quantitative balance between GFs and cell-cell contacts dictates the spatial pattern in cell cycle activity in epithelial cell clusters………..…………II-15
Fig. 4. Spatial dynamics of epithelial growth can be modulated by tuning the critical thresholds at which contact-inhibition is triggered………..II-17
Chapter III
Fig. 1. State diagram for contact-inhibition of proliferation and the hypothesis of quantitative, progressive loss of contact-inhibition……….……….III-5 Fig. 2. Substratum compliance affects spatial patterns in cell cycle activity and contact-inhibition of proliferation……….………III-8
Fig. 3. Substratum stiffening reduces the EGF threshold needed to transition from contact-inhibited to contact-independent proliferation………...III-13 Fig. 4. Substratum compliance affects the molecular organization of adhesion structures at cell-cell contacts……….….III-16
x Chapter IV
Fig. 1. The effect of substratum compliance on contact-maturation and spatial pattern in
cell-matrix interactions……….………IV-6 Fig. 2. The spatial patterns in cell adhesions correspond to spatial gradient in mechanical stresses within multicellular aggregates………...IV-10 Fig. 3. Treatment with supra-threshold levels of EGF induces rapid, short-lived traction
I-1
Chapter I. Introduction
Cellular organization into specialized, functional multicellular structures is achieved through dynamic interactions between cells and their surrounding microenvironment (1). The microenvironment presents instructions for orchestrating
many cellular processes, including proliferation, migration, and differentiation in a spatio-temporally coordinated manner (2). Tight regulation of these cell behaviors in a multicellular context is essential for organ development, function, and homeostasis.
Meanwhile, perturbations among environmental cues and/or in the cellular apparatus that senses and responds to these cues leads to significant pathological consequences, such as cancer development (3).
Epithelial tissues exhibit highly-ordered cell-cell junctions and polarized structures, mainly serving a barrier function for protection, partitioning, and sensation (4). In addition to its structural role, cell-cell contact is a key factor regulating epithelial tissue growth. Contact-inhibition of proliferation is a hallmark of normal epithelial cells, and
the loss of contact-inhibition results in chaotic proliferation, leading to tumor formation (5). Given its role in cancer, “contact-inhibition” has been the subject of extensive research ever since it was first described in the early 1960s at a phenomenological level in a culture that had reached saturation density (6). Contact-inhibition is now better
I-2 While progress continues in uncovering the physicochemical mechanisms mediating contact-inhibition (7-12), the quantitative aspects of this key constraint are unclear. In particular, contact-inhibition and the loss of this constraint occur in a
complex microenvironment replete with conflicting cues such as soluble growth factors (GF) and extracellular matrix (ECM). GFs bind receptors on the cell surface and activate a set of downstream intracellular signaling pathways that can stimulate proliferation (13). Cells are also anchored to the surrounding ECM whose physical and
chemical properties regulate cellular mechanics (14-15) and adhesion-dependent growth signaling (16-17).
It remains unclear how contact-inhibition is enforced in such a complex
microenvironment that includes multiple, potentially conflicting, cues. What perturbations in these environments potentially lead to the loss of contact-inhibition, transitioning the system to a contact-independent state? Ultimately, how do cells quantitatively integrate and converge these differential inputs into a net decision on cell
cycle? Addressing these questions will provide insight into a pivotal step in the self-organization of multicellular systems during development and the disruption of multicellular morphology during cancer progression.
I-3 to manipulate multicellular growth patterns and rates in synthetic microenvironments. Recent advances in material design (18-19) and microfabrication (20-21) techniques have enabled in situ fine-tuning of the degree of and context in which cells form contacts with
their neighbors and the matrix. Furthermore, spatio-temporally controlled release of soluble growth factors is feasible with the use of advanced polymeric materials (22), microfluidics (23-24), and MEMS devices (25). How these powerful technologies to manipulate environmental cues may be applied to tune rationally the growth and
organization of multicellular structures is a key engineering challenge.
Using a quantitative approach at a single cell level within two-dimensional multicellular aggregates, we elucidate a quantitative framework for contact-inhibition of
proliferation when cells are presented with conflicting cues – cell-cell contact (growth-inhibitory) and EGF (growth-promoting) (Chapter 2). Our results demonstrate that epithelial cells transition between contact-inhibited and contact-independent modes of proliferation when the amount of EGF crosses a critical threshold level. Only when the
level of EGF recedes to this threshold level, do contacts effectively suppress cell cycle activity among interior cells, driving a spatially patterned, contact-inhibited growth state. Furthermore, this transition point is tunable. We show that augmenting cell-cell contacts using micropatterned surfaces and molecular approaches enables
contact-inhibition at a higher EGF threshold.
I-4 of contact-inhibition may occur progressively over the course of oncogenesis as cancer-promoting perturbations gradually accumulate in the epithelial system and surrounding environments. We directly tested this hypothesis by measuring the quantitative effects
of stiffening the adhesive matrix, a broadly observed phenomenon during in vivo tumorigenesis (Chapter 3). We show that even when substratum stiffening has no apparent effect on contact-inhibition at a phenotypic level, it markedly reduces the threshold amount of EGF, quantitatively shifting normal cells closer to the transition line
to contact-independence. By using the proximity to this transition point as a metric, we demonstrate that quantitative changes in matrix compliance modulate the “degree” of contact-inhibition. These potent effects of matrix stiffening involve the erosion of contact-maturation, which alters the subcellular localization of EGF receptor as well as
cell-cell adhesion molecules. Moreover, we demonstrate that substratum compliance and EGF synergistically modulate multicellular mechanics in three-dimensions, which correspond to multicellular growth patterns (Chapter 4).
In summary, we elucidate quantitative principles for contact-inhibition co-regulated by cell-cell contact, EGF, and substratum compliance with implications in modulating the degree of contact-inhibition and multicellular growth patterns. The proposed quantitative model of contact-inhibition enhances our understanding of cancer
I-5
References
1. Engler AJ, Humbert PO, Wehrle-Haller B, & Weaver VM (2009) Multiscale
modeling of form and function. Science 324(5924):208-212
2. Kirschner M & Gerhart J (1998) Evolvability. Proc Natl Acad Sci USA 95(15):8420-8427
3. Tlsty TD & Coussens LM (2006) Tumor stroma and regulation of cancer
development. Annu Rev Pathol 1:119-150
4. Debnath J & Brugge JS (2005) Modelling glandular epithelial cancers in three-dimensional cultures. Nat Rev Cancer 5(9):675-688
5. Hanahan D & Weinberg RA (2000) The hallmarks of cancer. Cell 100(1):57-70
6. Martz E & Steinberg MS (1972) The role of cell-cell contact in "contact" inhibition of cell division: a review and new evidence. J Cell Physiol 79(2):189-210
7. Curto M, Cole BK, Lallemand D, Liu C-H, & McClatchey AI (2007)
Contact-dependent inhibition of EGFR signaling by Nf2/Merlin. J Cell Biol 177(5):893-903
8. Hamaratoglu F, et al. (2006) The tumour-suppressor genes NF2/Merlin and Expanded act through hippo signalling to regulate cell proliferation and apoptosis.
Nat Cell Biol 8(1):27-36
I-6 from intracellular compartments. J Cell Biol 174(4):593-604
10. Nelson CM, et al. (2005) Emergent patterns of growth controlled by multicellular form and mechanics. Proc Natl Acad Sci USA 102(33):11594-11599
11. St Croix B, et al. (1998) E-cadherin-dependent growth suppression is mediated by the cyclin-dependent kinase inhibitor p27(KIP1). J Cell Biol 142(2):557-571 12. Yin F & Pan D (2007) Fat flies expanded the hippo pathway: a matter of size
control. Sci STKE 2007(380):pe12
13. Jones SM & Kazlauskas A (2001) Growth-factor-dependent mitogenesis requires two distinct phases of signalling. Nat Cell Biol 3(2):165-172
14. Wozniak MA & Chen CS (2009) Mechanotransduction in development: a growing role for contractility. Nat Rev Mol Cell Biol 10(1):34-43
15. de Rooij J, Kerstens A, Danuser G, Schwartz MA, & Waterman-Storer CM (2005) Integrin-dependent actomyosin contraction regulates epithelial cell scattering. J Cell Biol 171(1):153-164
16. Danen EH & Yamada KM (2001) Fibronectin, integrins, and growth control. J
Cell Physiol 189(1):1-13
17. Guo W & Giancotti FG (2004) Integrin signalling during tumour progression. Nat Rev Mol Cell Biol 5(10):816-826
18. Kloxin AM, Kasko AM, Salinas CN, & Anseth KS (2009) Photodegradable
hydrogels for dynamic tuning of physical and chemical properties. Science 324(5923):59-63
I-7 microenvironments for morphogenesis in tissue engineering. Nat Biotech 23(1):47-55
20. Hui EE & Bhatia SN (2007) Micromechanical control of cell-cell interactions.
Proc Natl Acad Sci USA 104(14):5722-5726
21. Sniadecki NJ, Desai RA, Ruiz SA, & Chen CS (2006) Nanotechnology for cell-substrate interactions. Ann Biomed Eng 34(1):59-74
22. Lee KY, Peters MC, Anderson KW, & Mooney DJ (2000) Controlled growth
factor release from synthetic extracellular matrices. Nature 408(6815):998-1000 23. Li Jeon N, et al. (2002) Neutrophil chemotaxis in linear and complex gradients of
interleukin-8 formed in a microfabricated device. Nat Biotech 20(8):826-830 24. Mao H, Cremer PS, & Manson MD (2003) A sensitive, versatile microfluidic
assay for bacterial chemotaxis. Proc Natl Acad Sci U S A 100(9):5449-5454 25. Peterman MC, Noolandi J, Blumenkranz MS, & Fishman HA (2004) Localized
II-1
Chapter II. Tunable interplay between epidermal growth factor and
cell-cell contact governs the spatial dynamics of epithelial growth
Abstract
Contact-inhibition of proliferation constrains epithelial tissue growth, and the loss of
contact-inhibition is a hallmark of cancer cells. In most physiological scenarios, cell-cell contact inhibits proliferation in the presence of other growth-promoting cues, such as soluble growth factors (GFs). How cells quantitatively reconcile the opposing effects of cell-cell contact and GFs, such as epidermal growth factor (EGF), remains unclear. Here,
using quantitative analysis of single cells within multicellular clusters, we show that contact is not a “master switch” that overrides EGF. Only when EGF recedes below a threshold level, contact inhibits proliferation, causing spatial patterns in cell cycle activity within epithelial cell clusters. Furthermore, we demonstrate that the onset of
contact-inhibition and the timing of spatial patterns in proliferation may be re-engineered. Using micropatterned surfaces to amplify cell-cell interactions, we induce contact-inhibition at a higher threshold level of EGF. Using a complementary molecular genetics approach to
enhance cell-cell interactions by overexpressing E-cadherin also increases the threshold level of EGF at which contact-inhibition is triggered. These results lead us to propose a phase diagram in which epithelial cells transition from a contact-uninhibited state to a contact-inhibited state at a critical threshold level of GF, a property that may be tuned by
II-2 during development and tumor formation, respectively, and provides design principles for engineering epithelial tissue growth in applications such as tissue engineering.
II-3
Introduction
Contact-inhibition of proliferation is a key constraint on the growth of epithelial
tissues. The loss of contact-inhibition is a hallmark of cancer cells, leading to
hyperproliferation of epithelial cells and tumor formation (1). In physiological scenarios, cell-cell contact inhibits proliferation in the presence of other growth-promoting
environmental cues, such as soluble growth factors (GFs). However, how cells
quantitatively reconcile these conflicting cues to make a “net decision” on cell cycle commitment remains unclear. Does cell-cell contact act as a potent switch that
supercedes the stimulatory effect of GFs? Or, is there a quantitative titration between the extent of cell-cell contact and the amount of GFs that ultimately determines cell cycle
activity?
Whether cells evaluate contact and GFs in a binary or graded manner has important implications for our understanding of cancer progression. Cancers develop
through multiple molecular “hits.” Each hit may modify how cells weigh the opposing effects of contact and GFs. Thus, the loss of contact-inhibition may occur progressively with gradations of deregulation building up over the course of oncogenesis. Whether the loss of contact-inhibition should be viewed from this quantitative perspective or from the
II-4 A principal challenge to gauging the quantitative crosstalk between contact and GFs is that the underlying mechanisms are arranged into a complex physiochemical network. The cadherin family of transmembrane cell surface proteins plays a critical role (2). Both ectopic expression of cadherins and exposure to beads coated with cadherins arrest cell cycle activity (3-8). Cadherins in association with other membrane proteins, such as Merlin, bind and regulate the trafficking of growth factor receptors (9-12). In addition, cadherins regulate contact-inhibition through mechanotransduction pathways.
Cadherin-mediated contacts are coupled to the actin cytoskeleton (2, 13) and alter the distribution of traction forces between the cell and the substratum. Thus, in the interior of multicellular clusters where cell-cell contacts are abundant, the traction forces are minimal, and cell cycle activity is inhibited (14). Assessing the integrated performance
of these chemical and physical mechanisms is non-trivial and leaves open a systems-level question: How do cells quantitatively evaluate cell-cell contact and GFs to regulate cell cycle commitment?
To address this question, we undertook a quantitative experimental analysis of cell cycle activity of individual epithelial cells within multicellular clusters. We show that a quantitative titration of the amount of epidermal growth factor (EGF) and the level of cell-cell contact regulates cell cycle activity. Only below a critical threshold level of
II-5 model of contact-inhibition of proliferation: We propose a phase diagram in which
epithelial cells transition from a contact-uninhibited state to a contact-inhibited state at a critical threshold level of GF, a property that may be tuned by modulating the extent of
cell-cell contacts. This quantitative model of contact-inhibition has direct implications for how tissue size may be determined and deregulated during development and tumor formation, respectively, and provides design principles for engineering epithelial tissue growth in applications such as tissue engineering.
Results and Discussion
To examine the quantitative interplay between GFs and cell-cell contact in
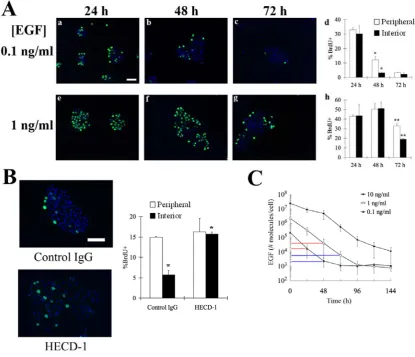
regulating cell proliferation, we quantified cell cycle activity in clusters of non-transformed mammary epithelial cells (MCF-10A) stimulated with different doses of EGF (Fig. 1A). In early time, BrdU uptake (a measure of DNA synthesis) was observed among cells both in the periphery and the center of clusters. Thus, cell-cell contact is not
sufficient to halt cell cycle activity among interior cells at 24 h. Only later in time, BrdU uptake was localized to the periphery of cell clusters, while the growth of interior cells was impeded. This spatial pattern was especially evident at 48 and 72 h post-stimulation in cultures initially treated with 0.1 and 1 ng/ml EGF, respectively (Fig. 1A, panels d, h).
II-6 proliferation and rules out alternative mechanisms, such as a diffusion-limited spatial gradient in EGF.
These results demonstrate that E-cadherin-mediated contact-inhibition induces spatial patterns in proliferation only at specific times in culture. Furthermore, cells stimulated with a higher dose of EGF take a longer time to exhibit spatial patterns in cell cycle activity (Fig. 1A, panels d and h). We reasoned that this apparent dependence of
contact-inhibition on EGF dosage may be linked to receptor-mediated degradation of EGF. Upon binding its receptor, the EGF/EGF receptor complex is internalized and a fraction of the ligand is degraded in the lysosome (15). We hypothesized that the EGF concentration may have to dip to a critical threshold level in order for cell-cell contact to
effectively suppress cell cycle activity of interior cells. Consistent with this hypothesis, in cultures treated with a high dose of EGF (10 ng/ml EGF), both interior and peripheral cells maintain equal levels of cell cycle activity at all three time points (24, 48, and 72 h) (Fig. S1). Furthermore, direct measurement of EGF concentration in the medium showed
that the amount of EGF decreases by two to three orders-of-magnitude over time (Fig. 1C), revealing a significant rate of cell-mediated ligand depletion.
If contact-inhibition is in fact sensitized to a threshold EGF concentration, then
II-7 have already committed to the cell cycle and are actively undertaking DNA synthesis. Based on the general timing of the cell cycle, the evaluation of environmental cues and the decision to enter the cell cycle likely occurred ~20 h earlier (16). Thus, we conclude
[image:24.595.109.525.271.628.2]that at the time when contacts inhibit cell cycle entry among interior cells, the critical threshold of EGF is approximately 3 x 10⁴ molecules/cell.
Figure 1. E-cadherin-mediated contact-inhibition triggers spatial patterns in cell
II-8 h show quantitation of the percentage of peripheral and interior cells incorporating BrdU. Error bars represent s.e.m. (n = 2-5). The asterisk and double-asterisk denote p < 0.01 and p < 0.05, respectively. (B) The effect of control IgG and anti-E-cadherin function
blocking antibody on spatial pattern in cell cycle activity. Cells were treated with antibodies 24 h after stimulation with 0.1 ng/ml EGF. Twenty-four hours later, BrdU uptake (green) and DAPI (blue) was assessed. Percentage of peripheral and interior cells incorporating BrdU was quantified. Error bars indicate s.e.m. (n = 2). The asterisk
indicates p < 0.05. (C)Amount of EGF in the medium for cultures treated initially with indicated doses of EGF. The vertical lines indicate the amount of EGF when a spatial pattern in proliferation is observed (blue) and 24 h prior (red). The error bars indicate
s.e.m. (n = 2). The scale bar represents 100 μm.
To test further whether contact-inhibition occurs only at this critical EGF
concentration, we designed an alternate approach to measure the threshold. Instead of waiting for ligand to deplete, we exposed cells to a broader range of EGF concentrations, including low levels that would emulate the late-depletion scenarios. Furthermore, we quantified cell cycle activity at a common time point, eliminating any changes in cells
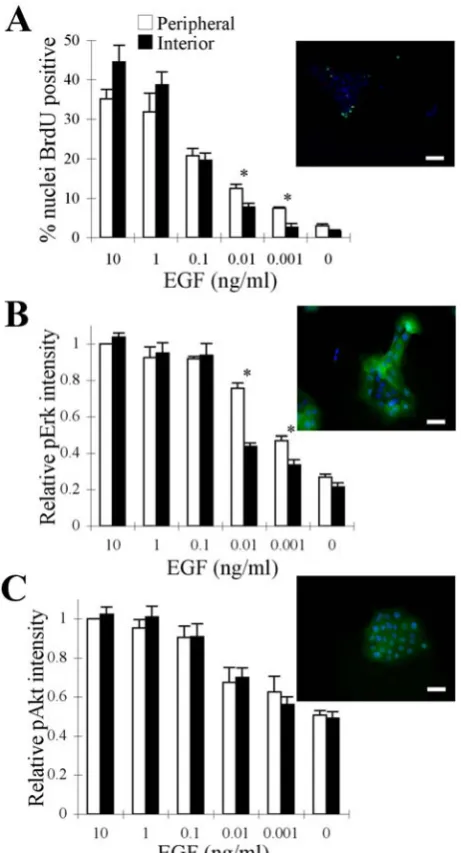
that could accumulate over time. In this assay at relatively high EGF concentrations (0.1, 1, and 10 ng/ml), both peripheral and central cells proliferate with nearly equal
propensity (Fig. 2A and Fig. S3A). However, at lower EGF concentrations (0.001 and 0.01 ng/ml) BrdU uptake ceases selectively among interior cells, while peripheral cells
II-9 ng/ml). This threshold translates to ~104 EGF molecules/cell, demonstrating a common quantitative “setting” for contact-inhibition that is remarkably similar between the two assay formats.
We hypothesized that at this critical threshold level of EGF, cell-cell contact may be obstructing specific signaling pathways that are needed to stimulate cell cycle activity in interior cells. To examine this hypothesis, we focused on two major intracellular
signals, Erk and Akt, that regulate cell cycle progression in many other cell systems (17) and are necessary for EGF-mediated proliferation in MCF-10A cells (Fig. S2). We quantified the activation of these signals in single cells at the periphery and interior of clusters. At relatively high EGF concentrations, Erk activation is uniform across the
cluster (Fig. 2B and Fig. S3B). However, at 0.001 and 0.01 ng/ml EGF, the level of ppErk is distinctly higher in the peripheral cells (Fig. 2B and Fig. S3B). In contrast, Akt phosphorylation does not exhibit spatial heterogeneity at any of the EGF concentrations (Fig. 2C and Fig. S3C). Similar to Akt signaling, EGFR phosphorylation on Y1068 and
Y1173 residues seemed to be uniform across the cell cluster for all EGF concentrations (Fig. S4). Thus, a spatial pattern in Erk signaling, but not Akt or EGFR phosphorylation, occurs at precisely the same threshold EGF dose at which contact inhibits cell cycle activity.
II-10 raise its concentration above the threshold should reverse spatial disparities in Erk
signaling and cell cycle activity. To test this possibility, we treated serum-starved MCF-10A cells with 0.1 ng/ml EGF, and 24 h later, replenished the medium with fresh 0.1
ng/ml EGF. Following refreshment, the level of phosphorylated Erk in interior and peripheral cells was equivalent (Fig. S4A) in sharp contrast to the spatial pattern observed in non-replenished cultures (Fig. 2B). Furthermore, replenishing EGF entirely eliminates the spatial pattern in cell cycle activity (Fig. S4B). These results support our model and
II-11
Figure 2: Selective attenuation of Erk, but not Akt, among interior cells correlates
with contact-inhibition. MCF-10A cells seeded at a density of 104 cells/cm2 were serum starved for 24 h and stimulated with the indicated doses of EGF or left untreated. BrdU uptake (A, green) and Erk/Akt (B/C, green) signals were assessed by immunostaining 24
II-12 of ppErk (B) and the relative nuclear intensity of pAkt (C) in peripheral and interior cells. Nuclear ppErk and pAkt intensities are reported relative to the amount of signal in
peripheral cells treated with 10 ng/ml EGF. The error bars indicate s.e.m. (A: n=3, B:
n=3, C: n=2). The asterisks denote p < 0.05. The scale bars represent (A) 100 μm and
(B, C) 50 μm.
Furthermore, this threshold model seems relevant in other cell types. In Eph4 mouse mammary epithelial cells, when EGF level is increased above a threshold level, all cells in the cluster undergo DNA synthesis; meanwhile, a contact-inhibited pattern of proliferation is observed at the threshold amount of EGF (Fig. S6). Interestingly, the
threshold in Eph4 cells occurs at approximately 1.5 x 10³ EGF molecules/cell and is different from the threshold quantified in MCF-10A cells. Thus, while the interplay between EGF and contact seems to be a general feature, the quantitative set points for this threshold may vary across epithelial cell types.
In this manner, our analysis reveals a threshold amount of EGF at which contact-inhibition effectively induces a spatial pattern in cell cycle activity. An intriguing
question is whether this competition operates bidirectionally. That is, instead of lowering
II-13 To examine this question, we first modulated cell-cell interactions using
micropatterned substrates. By varying the number of cells seeded onto circular adhesive micropatterns of the same size, we manipulated the surface area of contact between
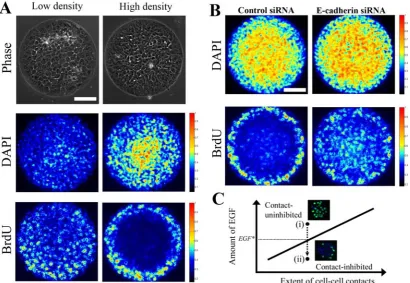
neighboring cells (Fig. 3A). The density of DAPI staining confirmed the relative
differences in cell density. Following stimulation with medium containing 20 ng/ml EGF, a spatial pattern in cell proliferation was evident in the culture with more extensive cell-cell interactions. Meanwhile, DNA synthesis in the low-density population was
homogeneous. This result reveals that contact-inhibition of proliferation may be achieved at significantly higher doses of EGF if cell-cell interactions are augmented.
An important caveat, however, is that the growth arrest of interior cells in the
high-density culture may be due to non-specific mechanical stresses at high cell density, space limitations due to overcrowding and/or reduced access to the underlying adhesive substrate. To determine whether cell-cell contacts are responsible for the observed spatial pattern in the high-density population, we examined the effect of downregulating
E-cadherin expression using siRNA. Transfection with siRNA, but not a control
construct, significantly reduced E-cadherin expression in MCF-10A cells (Fig. S6). Cells treated with the control siRNA and seeded at high density exhibited a spatial pattern in proliferation (Fig. 3B), revealing that the control siRNA treatment had no effect on
contact-inhibition. In contrast, the spatial pattern was eliminated in cells plated at the same high density and treated with cadherin siRNA. These results demonstrate that E-cadherin plays a critical role in mediating the observed contact-inhibition on
II-14 E-cdherin itself directly delivers the contact inhibition signal or whether E-cadherin interactions are needed to establish sufficient cell-cell contact for other proteins to mediate the contact inhibition signal. Indeed, the region of cell-cell contact is a rich
environment of intercellular signaling involving proteins, such as Notch and ephrins, that may play a critical role in cell cycle regulation.
Our results suggest a quantitative phase diagram in which epithelial cells reside in
two possible states: contact-uninhibited and contact-inhibited states (Fig. 3C). The transition into the contact-inhibited state occurs when the amount of EGF recedes below a critical threshold level. Furthermore, we showed that amplifying the level of cell-cell interactions using a micropatterned surface enables contact-inhibition at a higher level of
II-15
Figure 3: A quantitative balance between GFs and cell-cell contacts dictates the
spatial pattern in cell cycle activity in epithelial cell clusters. (A) Low (left) and high
(right) numbers of MCF-10A cells (5x10⁴ and 1.2x10⁵ cells/cm2, respectively) were plated on circular microdomains of the same size, serum starved for 24 h and stimulated with medium containing 20 ng/ml EGF for 24 h. By increasing the number of cells
seeded, we force cells to acquire a more columnar morphology with an elevated amount of cell-cell contact area. Nuclear density (DAPI) and DNA synthesis (BrdU) was assessed by immunofluorescence. Images from 20 islands (n = 2) were stacked, and a heat map of their stacked intensities is shown. The top panel shows phase contrast
II-16 islands (n = 2), and heat maps of their stacked intensities are shown. The scale bar
represents 100 μm. (C) A phase diagram of epithelial cell growth as a function of growth
factor and cell-cell interaction levels. Epithelial cells transition from (i) a contact-uninhibited state to (ii) a contact-inhibited state at a critical threshold level of growth factor (EGF*). Insets show representative fluorescence images probed for BrdU uptake
(green) and DAPI (blue) for clusters in contact-uninhibited and contact-inhibited phases.
To test further this phase diagram model and the tunability of the interplay between contact and GF, we revisited the relatively more straightforward scenario in
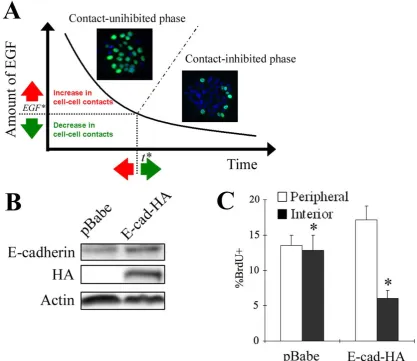
which epithelial cells are growing on a non-patterned surface without any spatial constraints. According to our phase diagram model, increasing the level of cell-cell interactions in this context should enable the transition to a contact-inhibited state at higher EGF concentrations, driving the onset of the spatial pattern in cell cycle activity at
an earlier time (Fig. 4A). To test this hypothesis, we retrovirally infected MCF-10A cells with either a vector encoding epitope-tagged human E-cadherin (pBabe-E-cad-HA) or an empty vector (pBabe). Cells transduced with virus encoding the exogeneous E-cadherin exhibited elevated E-cadherin expression compared to the cells infected with the virus
prepared with an empty vector (Fig. 4B). Cells overexpressing E-cadherin exhibited a spatial disparity in cell cycle activity as early as 24 h at which time, non-infected MCF-10A cells (Fig. 1A, a, d) and those infected with a retrovirus encoding the empty vector exhibited a uniform growth pattern (Fig. 4C). These results reveal that the
II-17 tuning the level of cell-cell interactions, the spatial dynamics of epithelial proliferation may be re-engineered.
Figure 4: Spatial dynamics of epithelial growth can be modulated by tuning the
critical thresholds at which contact-inhibition is triggered. (A) Model of tunable epithelial growth dynamics. Epithelial clusters grow in two modes: the first phase in which both interior and peripheral cells proliferate and a second phase in which only peripheral cells contribute to population growth. The transition from the first to second
II-18 to our phase diagram model, modulating the extent of cell-cell interactions should allow us to manipulate the threshold EGF concentration, and thereby affect the timing of spatial patterns in epithelial proliferation. Insets show representative fluorescence images
probed for BrdU uptake (green) and DAPI (blue) for clusters in contact-uninhibited and contact-inhibited phases. (B) MCF-10A cells were retrovirally infected with the empty vector pBabe, or exogenous E-cadherin (E-cad-HA). Cells were seeded at a density of 5x10³ cell/cm2, serum-starved, and treated with 0.1 ng/ml EGF. Ninety minutes later,
whole cell lysates were collected, and the extent of overexpression in E-cadherin was determined by immunoblotting for E-cadherin and the epitope tag HA. Equal loading was confirmed by probing for actin. (C) MCF-10A cells infected with retrovirus encoding either the empty vector or E-cad-HA were starved and stimulated with 0.1
ng/ml EGF for 24 h. Percentage of peripheral and interior cells incorporating BrdU was quantified. Error bars indicate s.e.m. (n = 3). The asterisk indicates p < 0.05.
In summary, our quantitative measurements and analysis lead us to propose a
tunable titration model for how contacts and growth factors compete to regulate cell cycle activity. This quantitative model modifies the classical notion that contact-inhibition acts as a switch that is either present or absent in normal versus tumor cells, respectively. Our findings support a more graded perspective of contact-inhibition: During cancer
II-19 evolutionary selection. The answer may lie in its potential pivotal role in development. Theoretical models predict that an increase in cell density serves as a negative feedback that quantitatively desensitizes the mitogenic response to soluble factors, thereby
self-regulating the size of developing tissues (18, 19). To our knowledge, our results provide the first experimental evidence for such a tunable, quantitative balance between contact and GFs in regulating cell cycle activity. Finally, our model indicates that epithelial clusters grow in two different modes: the first in which both interior and peripheral cells
proliferate and a second mode in which only peripheral cells contribute to population growth. Manipulating cells between these modes of proliferation can provide control over population growth rate and tissue geometry, both key parameters in tissue engineering.
II-20
Materials and Methods
Cell culture and reagents
MCF-10A cells were cultured in growth medium as described previously (20). For experiments, cells were plated on either glass coverslips (VWR) or two-chambered coverslides (Lab-Tek) in growth medium for 24 h. For G0 synchronization, cells were maintained in serum-free medium for 24 h (20). The following antibodies were used:
anti-actin (Santa Cruz), anti-BrdU (Roche Applied Science), anti-E-cadherin (BD Transduction Laboratories), anti-HA (Covance), anti-phospho-Erk 1/2 (Cell Signaling Technology), anti-phospho-serine 473-Akt (Cell Signaling Technology), HECD-1 (Zymed Laboratories), mouse IgG (Sigma-Aldrich), and Alexa dye-labeled secondary
antibodies (Invitrogen-Molecular Probe). The pharmacological inhibitors, PD98059 and LY294002, were obtained from Calbiochem.
Subcloning and retrovirus production and usage
The human cDNA of E-cadherin was kindly provided by P. Wheelock (University of Nebraska Medical Center), and was used to make pBabe-E-cadherin-HA construct. Briefly, the E-cadherin gene was amplified by PCR, with BglII and XhoI sites added to the 5' and 3' ends, respectively. In addition, to facilitate the detection of the exogenous
II-21 Retrovirus was produced by triple transfection of HEK 293T cells and used to infect MCF-10A cells as described previously (20).
Knockdown using siRNA
siRNA targeting E-cadherin mRNAs (sense GAUUGCACCGGUCGACAAATT-3’, antisense
5’-UUUGUCGACCGGUGCAAUCTT-3’) was obtained from Integrated DNA Technology.
Non-specific control siRNA was purchased from Ambion. siRNAs were transfected using Lipofectamine RNAiMAX (Invitrogen).
Quantification of ligand depletion
Cell number was determined by suspending cells with enzymatic treatment, and cell counting using a hemacytometer. To quantify the amount of EGF, samples from the medium were collected, pre-cleared by centrifugation and stored at –20oC. EGF
concentration was assayed simultaneously in all frozen samples using an enzyme-linked
immunosorbent assay (ELISA) kit (R&D Systems).
Immunofluorescence and image acquisition
Fixed cells were permeabilized, blocked and sequentially incubated withprimary
II-22 Cell lysis and Western blot
Cell lysis and Western blot were performed as described previously (20).
Fabrication of micro-patterned substrates
Fibronectin was micro-patterned on gold-coated, chambered coverslides by micro-contact printing using a PDMS stamp. Briefly, UV light was passed through a
chrome mask containing the pattern (NRF at UCLA) onto a layer of SU-8 photoresist to make a mold. PDMS was cast into this mold to make the stamp. The stamp was “inked” with 16-Mercaptohexadecanoic acid (Sigma Aldrich) dissolved in 99% ethanol and was used to print gold-coated chambered coverslides. The unprinted area was passivated
using PEG(6)-Thiol (Prochimia) dissolved in 99% ethanol. After washing, the coverslide was treated with EDC and Sulfo-NHS (Pierce) to activate the acid, priming it to cross-link with amine groups in fibronectin (Sigma-Aldrich).
Acknowledgements
We thank members of the Asthagiri group for helpful discussions, An-Tu Xie for his involvement in the early stages of image analysis, and Celeste Nelson and Casim Sarkar
II-23
References
1. Hanahan D & Weinberg RA (2000) The hallmarks of cancer Cell100, 57-70.
2. Steinberg MS & McNutt PM (1999) Cadherins and their connections: adhesion junctions have broader functions Curr Opin Cell Biol11, 554-560.
3. Caveda L, Martin-Padura I, Navarro P, Breviario F, Corada M, Gulino D, Lampugnani MG, & Dejana E (1996) Inhibition of cultured cell growth by
vascular endothelial cadherin (cadherin-5/VE-cadherin) J Clin Invest98, 886-893. 4. Goichberg P & Geiger B (1998) Direct involvement of N-cadherin-mediated
signaling in muscle differentiation Mol Biol Cell9, 3119-3131.
5. Gray DS, Liu WF, Shen CJ, Bhadriraju K, Nelson CM, & Chen CS (2008)
Engineering amount of cell-cell contact demonstrates biphasic proliferative
regulation through RhoA and the actin cytoskeleton Exp Cell Res. 314: 2846-2854. 6. Levenberg S, Yarden A, Kam Z, & Geiger B (1999) p27 is involved in
N-cadherin-mediated contact inhibition of cell growth and S-phase entry Oncogene
18, 869-876.
7. Perrais M, Chen X, Perez-Moreno M, & Gumbiner BM (2007) E-cadherin homophilic ligation inhibits cell growth and epidermal growth factor receptor signaling independent of other cell interactions Mol. Biol. Cell E06-04-0348.
II-24 9. Cole BK, Curto M, Chan AW, & McClatchey AI (2008) Localization to the
cortical cytoskeleton is necessary for Nf2/merlin-dependent epidermal growth factor receptor silencing Mol Cell Biol28, 1274-1284.
10. Curto M, Cole BK, Lallemand D, Liu C-H, & McClatchey AI (2007) Contact-dependent inhibition of EGFR signaling by Nf2/Merlin J Cell Biol177, 893-903. 11. Lampugnani MG, Orsenigo F, Gagliani MC, Tacchetti C, & Dejana E (2006)
Vascular endothelial cadherin controls VEGFR-2 internalization and signaling
from intracellular compartments J Cell Biol174, 593-604.
12. Lampugnani MG, Zanetti A, Corada M, Takahashi T, Balconi G, Breviario F, Orsenigo F, Cattelino A, Kemler R, Daniel TO, et al. (2003) Contact inhibition of VEGF-induced proliferation requires vascular endothelial cadherin, beta-catenin,
and the phosphatase DEP-1/CD148 J Cell Biol161, 793-804.
13. Weis WI & Nelson WJ (2006) Re-solving the cadherin-catenin-actin conundrum J Biol Chem281, 35593-35597.
14. Nelson CM, Jean RP, Tan JL, Liu WF, Sniadecki NJ, Spector AA, & Chen CS
(2005) Emergent patterns of growth controlled by multicellular form and mechanics Proc Natl Acad Sci USA102, 11594-11599.
15. Carpenter G (2000) The EGF receptor: a nexus for trafficking and signaling Bioessays22, 697-707.
16. Liu WF, Nelson CM, Pirone DM, & Chen CS (2006) E-cadherin engagement stimulates proliferation via Rac1 J Cell Biol173, 431-441.
II-25 18. Hufnagel L, Teleman AA, Rouault H, Cohen SM, & Shraiman BI (2007) On the
mechanism of wing size determination in fly development Proc Natl Acad Sci USA104, 3835-3840.
19. Shraiman BI (2005) Mechanical feedback as a possible regulator of tissue growth Proc Natl Acad Sci U S A102, 3318-3323.
20. Graham NA & Asthagiri AR (2004) Epidermal growth factor-mediated T-cell factor/lymphoid enhancer factor transcriptional activity is essential but not
II-26
Supporting Information
Quantification of immunofluorescne signals of phospho-proteins
For imaging ppErk or ppAkt, we started with a sample that is expected to give the highest FITC signal (e.g. 10 ng/ml EGF). Using this positive control, an exposure time was empirically chosen so that the highest pixel intensity in a given field is close to the saturation level (i.e. 255). The chosen exposure time was confirmed not to saturate the
FITC signal in other fields of the positive control sample. These steps identify an exposure time that maximizes the dynamic range of quantification of ppErk and ppAkt. This exposure time was then used to capture images from all other samples in a given trial.
Nuclear phospho-protein signal intensity was quantified by first tracing the perimeter of each nucleus. The area and the total FITC intensity of each nucleus were determined using MATLAB. The mean background intensity per pixel was also calculated for each image from the region containing no cells. This background level
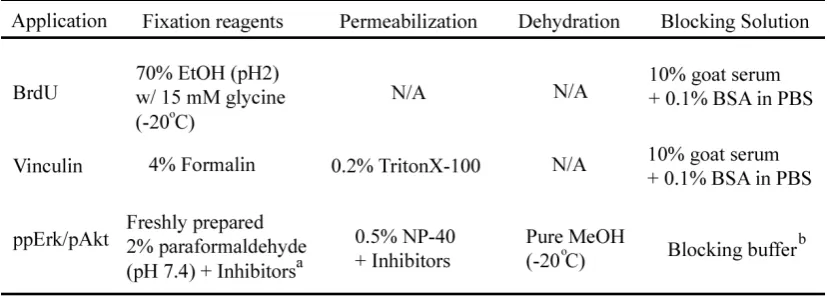
II-27 Table 1: Details of reagents used in immunofluorescence for each stain
Phosphatase inhibitorsa: 1mM sodium orthovanadate (Sigma-Aldrich), 10mM sodium
fluoride (Sigma Aldrich), and 10mM β-glycerophosphate (Sigma-Aldrich)
II-28
Figure S1: DNA synthesis following initial treatment with 10 ng/ml EGF. Percentage
of peripheral and interior cells incorporating BrdU at 24, 48, 72 h after starved MCF-10A cells were stimulated with 10 ng/ml EGF. The error bars represent s.e.m. (n = 2). The
II-29
Figure S2: Erk and Akt signaling is essential for EGF-mediated proliferation of
MCF-10A cells. (A) Serum-starved MCF-10A cells were pre-treated for 2 hours with
PD98059 (50μM), LY29400 (50 μM), or the solvent DMSO and then stimulated with 10
ng/ml EGF or left untreated. The effect of the drugs on (A) Erk and Akt signaling pathways (15 min after stimulation) and (B) BrdU uptake (24 h after stimulation) was
II-30
Figure S3: The effect of EGF treatment on DNA synthesis, ppErk and pAkt signals
in MCF-10A cell clusters. See legend of Fig. 2 for experimental details. The scale bars
II-31
Figure S4: EGF replenishment rescues Erk signaling and cell cycle activity. (A) The level of ppErk in peripheral and interior cells following 15 min of EGF replenishment. (B) The percentage of peripheral and interior cells incorporating BrdU was quantified 24 h after medium was (+) or was not (-) replenished. The error bars indicate s.e.m. (n=2-5).
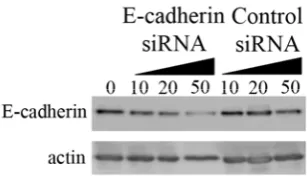
II-32
Figure S5. Effect of siRNA treatment on E-cadherin expression. Cells were transfected with control or E-cadherin siRNA in serum-free medium. The extent of
III-1
Chapter III. Substratum stiffening promotes the quantitative,
progressive loss of contact-inhibition of proliferation
Abstract
Cancer progression occurs through multiple genetic and epigenetic perturbations. Elucidating how these perturbations collectively confer selective advantages, such as
unconstrained proliferation, is central to our understanding of disease progression and for developing treatment strategies. Here, we show that (1) there are measurable, quantitative degrees of contact-inhibition of proliferation, and that (2) the stiffening of the microenvironment, a widely observed perturbation during cancer development, promotes
a quantitative, progressive loss of contact-inhibition. Even when substratum stiffening has no discernible effect on the phenotype of contact-inhibition, it significantly reduces the threshold amount of EGF needed to transition cells from inhibited to
contact-independent proliferation. Thus, the threshold amount of EGF provides a metric of the extent of contact-inhibition. Quantifying the threshold EGF level reveals the potent synergism between matrix stiffening and EGF signaling. Matrix stiffening reduces the EGF threshold by over two orders-of-magnitude, thereby markedly reducing the extent of EGF amplification needed to switch into contact-independent proliferation. These
III-2 principles for engineering spatial patterns of growth of multicellular structures using synthetic mechanically-tunable biomaterials.
III-3
Introduction
A hallmark of normal epithelial cells is contact-inhibition of proliferation (1). In
contrast, cancer cells proliferate chaotically in a contact-independent manner, leading to tumor formation. Elucidating how epithelial cells transition from a contact-inhibited state to a contact-independent mode of proliferation will provide insight into a pivotal step in cancer progression.
Epithelial cells reside in a microenvironment replete with stimuli, and cell-cell contact is just one among many signals that regulate cell proliferation. Parsing how contact-inhibition is enforced in a rich microenvironment that also presents conflicting
growth-promoting stimuli remains a challenge. Both biochemical and physical mechanisms seem to be involved. Cell-cell contacts affect GF-mediated intracellular signaling pathways, such as ERK and Akt, to suppress cell cycle progression (2-3). Further upstream, GF receptors themselves interact with receptors that mediate cell-cell
adhesion, such as E/VE-cadherin (4-6). In addition, cadherins mediate contact-inhibition by mechanically coupling neighboring cells and affecting the distribution of traction forces in multicellular clusters (7). Atypical cadherin, Fat, and ERM family proteins, Merlin, and Expanded, are also implicated in the Hippo pathway which has
III-4 While progress continues in uncovering the physiochemical mechanisms
mediating contact-inhibition, it remains unclear how these mechanisms collectively reconcile the competing influences of GFs and cell-cell contact on cell cycle activity.
We recently proposed a quantitative framework for contact-inhibition in which the levels of cell-cell contact and epidermal growth factor (EGF) determine whether cell
proliferation is contact-inhibited or contact-independent (Fig. 1) (10). A significant implication of the proposed state diagram is that contact-inhibition and its loss during
cancer development must be viewed from a quantitative perspective. It suggests that cancer-promoting perturbations may quantitatively shift normal cells closer to the transition line to contact-independence. While the effect of such perturbations on the gross phenotype would remain latent (i.e., proliferation would still be contact-inhibited),
the perturbations would have a quantitative, measureable effect on the threshold amount of EGF needed to transform cells into a contact-independent mode of proliferation. Thus, the proposition is that the “degree of contact-inhibition” may be quantified by how close a cell system is to the transition line and that the effect of multiple seemingly latent
hits can be tracked by measuring changes in the EGF threshold.
Here, we set out to explore whether physiologically-relevant cancer-promoting events actually cause such measurable quantitative shifts in the degree of
contact-III-5 independent state. Increasing the stiffness of a collagen- or fibronectin-coated elastic substrate reduces the threshold amount of EGF needed to induce tumor-like, contact-independent proliferation. By reducing the EGF threshold, matrix stiffening reduces the
extent to which EGF signaling must be amplified to enable contact-independent growth, thereby quantitatively facilitating transformation. Our findings provide quantitative insights into how matrix compliance and EGF signaling synergistically affect contact-inhibition. These insights have implications for our understanding of cancer progression
[image:54.595.145.427.409.647.2]and offer design principles for engineering spatial patterns and rates of growth of multicellular structures using synthetic mechanically-tunable biomaterials.
Fig. 1. State diagram for contact-inhibition of proliferation and the hypothesis of
III-6 transition to a contact-independent mode of proliferation upon crossing a critical
threshold level of growth factor (G1*). We hypothesize that cancer-promoting
perturbations may quantitatively shift normal cells closer to the transition line to
contact-independence (1 Æ 2 Æ 3). Although such perturbations may not have a phenotypic effect (i.e., cells remain contact-inhibited), we hypothesize that these perturbations may have a quantitative, measurable effect on the threshold amount of EGF (G1*Æ G2*Æ G3*) needed to transform normal cells to achieve contact-independent growth. Insets
show representative fluorescence images probed for BrdU incorporation (green) and DAPI (blue) for epithelial clusters in contact-inhibited and contact-independent states of
proliferation. (Scale bar, 50 μm.)
Results
Substratum compliance affects spatial patterns in proliferation and contact-inhibition of
proliferation
To explore the effect of substratum compliance on contact-inhibition of proliferation, we cultured Madin-Darby canine kidney (MDCK) epithelial cells on
collagen (ColI)-coated polyacrylamide gels of varying stiffness and identical adhesion ligand composition (Fig. S1). Over a range of substratum compliance (7-31 kPa), cells formed two-dimensional multicellular clusters. On the most compliant substratum (7 kPa), treatment with a supra-saturating dose of EGF (100 ng/ml) induced BrdU uptake
III-7 this spatial pattern in proliferation (Fig. 2Aiii and B). Quantitative analysis showed that BrdU uptake of interior cells was equivalent to that of peripheral cells on the stiffer substrates (17-31 kPa) (Fig. 2B).
To confirm that the observed spatial pattern in proliferation on soft substrates was in fact due to contact-inhibition, we tested the effect of diminishing cell-cell interactions by down-regulating E-cadherin expression using siRNA. Compared to a
control construct, transfection with siRNA reduced E-cadherin expression by ~50% in MDCK cells grown on the compliant substratum (Fig. S2). Transfection with a control siRNA had no effect on the spatial pattern in proliferation on soft substrates (Fig. 2C). In contrast, the spatial pattern was eliminated in cells treated with E-cadherin siRNA.
These results demonstrate that E-cadherin-mediated cell-cell contact is involved in establishing the spatial pattern in proliferation on soft substrates.
Taken together, these observations reveal that cell-cell contact effectively
III-8
Fig. 2. Substratum compliance affects spatial patterns in cell-cycle activity and
contact-inhibition of proliferation. (A) MDCK cells cultured on ColI-coated
polyacrylamide gels of varying stiffness were treated with 100 ng/ml EGF following serum starvation. BrdU incorporation (green) and DAPI staining (blue) were assessed 16 h after EGF treatment. (B) The graph shows the quantitation of the percentage of
III-9 induced by compliant substrata. MDCK cells grown on soft substrates were transfected with control or E-cadherin siRNA in serum-free medium for 24 h. Cells were then stimulated with 100 ng/ml EGF. BrdU uptake (green) and DAPI (blue) were assessed 16
h later. Percentage of peripheral and interior cells incorporating BrdU was quantified. The extent of knockdown in E-cadherin was determined by Western blot. Equal loading was confirmed by probing for actin. Error bars, s.d. (n = 2), *, P < 0.01. (Scale bars, 100
μm.)
Substratum compliance quantitatively modulates the transition between contact-inhibited
and contact-independent proliferation
Our initial experiments showing the effect of substratum compliance on contact-inhibition were conducted at a single supra-saturating dose of EGF. We have previously shown that epithelial cells transition between contact-inhibited and contact-independent
modes of proliferation when the amount of EGF crosses a critical threshold level (Fig. 1). Thus, we reasoned that it may be important to evaluate the effect of substratum
compliance on contact-inhibition in the context of a third critical aspect of the microenvironment, soluble GFs.
To begin to examine this interplay between EGF, substratum compliance and cell-cell contact, we examined cell cycle activity in clusters of non-transformed human mammary epithelial cells (MCF-10A) cultured on substrates of different mechanical
III-10 respectively), peripheral cells proliferated with a higher propensity than interior cells, exhibiting the spatially-patterned, contact-inhibited mode of proliferation (Fig. 3Ai and Aii). The fraction of interior cells undertaking DNA synthesis was approximately
2-fold lower than the fraction of cells uptaking BrdU in the periphery of the clusters (Fig. 3B). However, as the EGF concentration was increased above 1 ng/ml, the spatial disparity in proliferation diminished such that an equal fraction of interior and peripheral cells incorporated BrdU when stimulated with 100 ng/ml EGF (Fig. 3Aiii and B). These
findings reveal that even on soft surfaces, both contact-inhibited and contact-independent modes of proliferation can occur and that the state of the system depends not only on substratum stiffness, but also on whether the level of EGF is above or below the threshold (in this case, ~1 ng/ml EGF).
A key question is whether this EGF threshold is sensitive to substratum
compliance. That is, does changing substratum compliance quantitatively modulate the transition point between contact-inhibition and contact-independent proliferation? To
address this question, we repeated the EGF dose study, now using stiffer substrates (31 kPa). As with the soft surface, we found that MCF-10A cells exhibited both contact-inhibited and contact-independent modes of proliferation. At relatively low EGF concentrations (0.001 and 0.01 ng/ml), BrdU uptake was concentrated at the periphery of
III-11 substrate exhibited contact-independent growth with both peripheral and interior cells proliferating with equal propensity (Fig. 3Av).
These results demonstrate that substratum stiffening (from 7 to 31 kPa)
quantitatively reduces the EGF threshold from 1 to 0.01 ng/ml in MCF-10A cells. Thus, growth is not simply contact-inhibited on soft substrates and contact-independent on stiff substrates. Rather, changes in substratum compliance have a quantitative effect on the
degree of contact-inhibition. Matrix stiffening reduces the EGF threshold at which the system transitions from a contact-inhibited to contact-independent mode of proliferation, thereby quantitatively facilitating this transformation.
We corroborated this quantitative effect of substratum compliance in another epithelial cell system. Cell cycle activity was assessed in MDCK cell clusters, now in response to varying both substratum stiffness and EGF concentration. On soft
substrates (7 kPa), MDCK cells exhibited contact-inhibition even at supra-saturating
doses of EGF (100 ng/ml), suggesting that the threshold EGF is too high to attain contact-independent growth on these substrates (Fig. S3A and B). However, on substrates of intermediate stiffness (17 kPa), MDCK cells underwent a clear transition from contact-inhibited to contact-independent growth at a threshold of approximately 0.1 ng/ml EGF.
III-12 Taken together, these results in MCF-10A and MDCK epithelial cells
demonstrate that substratum stiffening quantitatively modulates contact-inhibition by
reducing the EGF threshold needed to shift cells from inhibited to contact-independent proliferation. In addition, the results show that epithelial cell systems can exhibit different sensitivities to substratum compliance (Fig S3C). Over the same range of substratum compliance (7-31 kPa), the EGF threshold shifted two orders-of-magnitude
in MCF-10A cells. Meanwhile, in MDCK cells, the effect extended even beyond the range of EGF concentrations used in our experiments. This difference in sensitivity to substratum compliance may arise from the difference in adhesion structures between two cell types. For example, MCF-10A cells lack Crumbs3 required for the tight junction
III-13
Fig. 3. Substratum stiffening reduces the EGF threshold needed to transition from
contact-inhibited to contact-independent proliferation. MCF-10A cells plated on soft and stiff substrates coated with fibronectin were serum-starved for 24 h and stimulated
III-14 peripheral cells incorporating BrdU were quantified and the ratio of these two fractions is plotted as a function of EGF concentration. Error bars, s.d. (n = 2-3), * and **, P < 0.01.
(Scale bar, 100 μm.)
Substratum compliance affects the maturation of cell-cell contacts
Our results reveal that stiffening the adhesive matrix reduces the threshold EGF at which the system transitions from contact-inhibited to contact-independent growth. This suggests that matrix stiffening may slide the cell system to the left on the state diagram (Fig. 1). That is, increasing stiffness may attenuate cell-cell contacts. To test
this possibility, we examined the subcellular localization of E-cadherin and ZO-1. In mature epithelial monolayers, E-cadherin localizes typically to basolateral regions while ZO-1 is found in an apical band of mature cell-cell contacts (14).
In MDCK cells, we observed strong basolateral localization of E-cadherin at cell-cell junctions (indicated by white arrows) in cell-cells seeded on soft substrates (Fig. 4A and B, left). In contrast, on stiff substrates, E-cadherin exhibited partial basolateral
localization in addition to significant residual localization in the cytosol (Fig. 4A and B,
right). These observations suggest that more mature cell-cell contacts are established on more compliant substrates.
This effect of substratum compliance on contact maturation was even more
III-15 substrates, while only modestly present on stiff substrates (Fig. 4B). More strikingly, we observed significant differences in ZO-1 nuclear localization on soft versus stiff substrates (Fig 4B and C). On the soft surface, ZO-1 was found in the cytoplasm and
nucleus only among the cells at the periphery of the cluster. The growth-arrested cells in the interior of the cluster did not exhibit nuclear ZO-1 localization. In contrast, on the stiff surface, significant nuclear localization of ZO-1 was observed among all cells in the cluster. This nuclear localization of ZO-1 was highly correlated with the proliferation
III-16
Fig. 4. Substratum compliance affects the molecular organization of adhesion
structures at cell-cell contacts. MDCK cells cultured on soft and stiff substrata were serum starved for 24 h and immunostained for ZO-1 (green) and E-cadherin (red). Nuclei were co-stained with Hoechst33342 (blue). (A) Merged images were generated by projecting down in the z-direction so that each pixel represents the average intensity
III-17 indicate the planes for which x-z section views were generated. (B) x-z view of the plane indicated by the white line in the merged image. White arrows indicate cell-cell contacts. (C) Heat maps of ZO-1 represent the relative abundance of the molecule within epithelial
clusters across the z-stacks. (Scale bar, 10 μm.)
Enhanced contact-maturation on soft substrates selectively affects EGF receptor (EGFR)
and ERK signaling, but not Akt signaling
The emerging model from our data is that stiff substrates disrupt cell-cell contacts and sensitize cellular response to EGF, thereby reducing the threshold EGF
needed to transform the system into a contact-independent mode of proliferation. To elucidate how substratum stiffening-mediated disruption of cell-cell contacts affects EGF signaling, we examined the effect of modulating substratum compliance on the
subcellular localization of EGFR. On a soft substratum, EGFR was highly localized to
the basolateral membrane compartments at which stable E-cadherin-mediated adherens junctions formed (Fig. 5A, left, indicated by white arrows). In contrast, on a stiffer substratum, EGFR seemed to be evenly distributed among apical and basal membranes without co-localizing with E-cadherin (Fig. 5A, right). These results suggest that
substratum stiffening may reduce the EGF threshold by disrupting cell-cell contacts and de-localizing EGFR from mature cell-cell contacts.
To determine whether this change in EGFR sequestration affects receptor
III-18 and stiff substrates. In contrast to the spatially uniform phosphorylation in cell clusters on the stiff substratum, both the level of EGFR phosphorylation and the formation of intracellular vesicles through EGFR internalization were diminished in the interior of cell
clusters on the soft substratum (Fig. 5Bi). This spatial pattern in EGFR phosphorylation and internalization corresponds to the observed growth patterns (Fig. 2). We quantified the total cytoplasmic level of phospho-Y1068 EGFR in single cells at the periphery and interior of clusters. Consistent with our qualitative assessment, EGFR Y1068
phosphorylation was diminished in central cells by 20% relative to peripheral cells on the soft surface, but this spatial pattern was not found on the stiff substratum.
To determine whether these effects of substratum compliance on EGFR
localization and phosphorylation transduce to downstream signaling pathways, we examined two EGF-mediated intercellular signals, ERK and Akt, that are involved in cell cycle regulation (15). Following 15 min of stimulation with 100 ng/ml EGF, cells were immunostained for phospho-ERK and phospho-Akt. On the soft substratum, ERK
signaling was diminished by approximately 40% in the interior cells compared to their peripheral counterparts (Fig. 5Bii), correlating to the spatial pattern in EGFR
phosphorylation and proliferation in this condition (Fig. 2 and 5Bi). Meanwhile, on stiffer substrates, ERK activation was homogeneous across the cell cluster, consistent
III-19 eliminates the spatial disparity in proliferation, leading to contact-independent
[image:68.595.108.552.158.418.2]proliferation.
Fig. 5. Substratum compliance affects subcellular localization of EGFR and
selectively regulates EGFR and ERK, but not Akt, signaling. (A) Effect of substratum compliance on subcellular localization of EGFR and E-cadherin. MCF-10A
cells cultured on soft and stiff substrates were serum starved for 24 h and immunostained for EGFR (green) and E-cadherin (red). Nuclei were co-stained with Hoechst33342 (blue). Merged images represent the fluorescence signals averaged across the z-stacks acquired by confocal imaging. x-z views were generated at the planes indicated by white
lines (pointed by black arrows) in the merged images. White arrows indicate cell-cell
contacts. (Scale bar, 10 μm.) (B) Substratum compliance affects spatial patterns in EGFR