International Research Journal of Human Resources and Social Sciences Impact Factor- 3.866
Vol. 3, Issue 10, October 2016 ISSN(O): (2349-4085) ISSN(P): (2394-4218)
© Associated Asia Research Foundation (AARF)
Website: www.aarf.asia Email : [email protected] , [email protected]
RURAL LEVEL INFORMATION SYSTEM USING GIS AND REMOTE
SENSING
Dr. Kavita
Associate Professor, Dept of Civil Engineering, Institute of Aeronautical Engineering, Dundigal Hyderabad-500043, Telangana, India.
ABSTRACT
The Basic information (effective information) describes the physical, social and
economical aspects of the communities subjected to direct and indirect effects. It requires the
estimates of the extent of spatial and socio-economic characteristics. Gathering of basic
information is the primary step in taking the proper decision in developmental activities of
the study areas. The basic information can be obtained by different methods like field
surveys, aerial surveys, Census of India. Census of India provides information about
demographic and socio-economic aspects at the census ward level but it lacks to provide
information at housing level. The Governmental organizations or agencies (Mandal Revenue
Offices, do not keep the digital data properly (i.e., at microlevel scale) and it is very difficult
to get some usable basic information from the available sources. The information necessary
to make available all kinds of data related to the village, easily and concisely for planning at
micro- level. It also helps in regular updation of database over the time period to ensure
better availability of village information. High-resolution satellite data IRS P6 LISS IV MX
(5.8 m Resolution) has been used for the preparation of large scale maps on 1:10000 Scale
using ARCGIS 10.1.2 platform, supported with extensive field survey. This information
system will be helpful for planners, academicians, geographers, decision makers and
government officers. For proper sustainable development at mandal level and Rural level.
1. INTRODUCTION
Decision makers and Planners for micro level planning have to depend on geospatial and attribute data. (Ravindran. A,Jaishankar.J 2000) for optimal interpretation. Hence, the planners need to have sophisticated data management systems to handle such spatially correlated data. Village studies are one of the most efficient ways to understand the farming systems and helps in identifying the socio-economic problems faced by farming community.
The chief objective of the study area is development of rural level information system is to provide absolute information for taking any decision based on their existing resources and capabilities.
The emergence of Remote Sensing (Lillesand, T.M. and Kiefer, R.W. 1994)and Geographic Information System (Burrough Peter A and Rachael A Mc Donnell1983).as a powerful tool for spatial analysis and storage has in effect alleviated the problem by computerization of the spatial data. The GIS technology can decrease the cost and time of the decision makers and planners in arranging the data in reaching the accurate conclusion and. Rural level Information system, generated in the present work which joins the geospatial village maps with or tabular information, has demonstrated the prospective for grass-root level development planning taking into deliberation the local needs and constraints. It has also recognized its effectiveness to the decision-makers in the district to generate views for decision-making at local-level. mapping natural resources , utilities, land use / Land cover etc. thematic information on 1:10,000 scale, so that micro level preparation is possible for the development at village level.
1.1 ARCGIS
GIS can also be defined as “decision support system involving the integration of spatially referenced data in a problem solving environment’ (Cowen, 1988). ArcGIS has a sophisticated geographic information model for representing spatial information as spatial data, features, and rasters data types types. ArcGIS supports an accomplishment of the data model for both DBMS and file systems. GIS datasets include file based models, such as shapefiles, coverages, images and grids triangulated irregular networks (TINs). The geodatabased model manages the same types of geographic information in a DBMS, providing many of the management benefits offered by a DBMS
the behaviour of a generic geographic data model, geographic information in ArcGIS provides a robust platform for any GIS application
ArcGIS facilitate huge volumes of imagery to be made quickly accessible to a wide range of applications and users. ArcGIS provides the infrastructure that supports multiple workflows associated with collection, management, production, and utilization of imagery.
1.2 Study area and Objectives
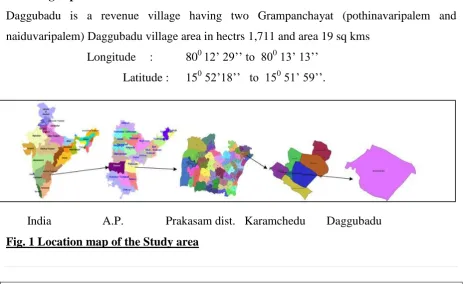
The study area selected for the project is Daggubadu village of karamchedu mandal of prakasam district Andhra Pradesh in India.(Fig 1) Prakasam district having 56 mandals and occupies an area of 17,626 Sq. Km with various agricultural, quarrying, manufacturing, mining and other household industries. One of the Karamchedu mandal is very prosperous and having seven villages with aerial extent of 161.827 Sq.Km and it is located 8.5 km from the busy commercial township of Chirala mandal in Prakasam district Andhra Pradesh state, India. In this research paper one of the village “Daggubadu” village is selected to develop large scale rural information system using advanced ARC/GIS Software 10.1.2. Geographical location of the study area 800 12’ 29’’ to 800 13’ 13’’ longitudeand150 52’18’’ to 150 51’ 59’’latitude. Daggubadu village is getting benefit from the facilities like irrigation provided by the century-old, British-built Krishna and the post-Independence Nagarjunasagar canals, the fertile irrigated land and combined with tobacco farming at Nizam area were the major sources of prosperity of the village
1.3 Village Spatial Extent
Daggubadu is a revenue village having two Grampanchayat (pothinavaripalem and naiduvaripalem) Daggubadu village area in hectrs 1,711 and area 19 sq kms
Longitude : 800 12’ 29’’ to 800 13’ 13’’ Latitude : 150 52’18’’ to 150 51’ 59’’.
[image:3.595.66.530.483.767.2]1.4 OBJECTIVE
The primary objective of the study is to develop a Information System focusing on the following issues
Development of detail Socio-economic data base of the study area
To prepare the digital thematic map namely base map,land use/ land cover,drainage, transport, soil map and cadastral map using satellite imageries and survey of india toposheet on ArcGIS 10.1.2 platform and to maintain a spatial digital database.
To develop and maintain Village Information System (VIS) and its database which can be used for micro level planning. .
2. Material and methods
2.1 Data & Software used
The following datasets have been used to prepare the village information system, Survey of India toposheets: No.s 66A1NE and 66A1SE on 1:25,000 scale Satellite Imagery of IRS P6 LISS IV MX (5.8 m Resolution)
Secondary data from Local Revenue Office Primary data acquired through field survey
For this purpose, ERDAS IMAGINE 8.6, ARC GIS 10.1.2, software’s has been used. 2.2 Methodology
For analysis and interpretation, two types of data products are needed, namely that is Spatial and Attribute data.
2.3 Spatial Data
cover features systematically on the enhanced satellite imagery during the classification of features (Thomas M. Lillesand, 2000). The thematic maps generation system used in this study is the system, which is pioneered by United States Geological Survey (USGS) (Anderson, 1977) and is modified by National Remote Sensing Centre (NRSC) according to Indian conditions. A preliminary image classification key is prepared for the fused pictorial data and is used during interpretation process. The base map is overlaid on the satellite imagery. Then the different thematic layers features are extracted from the satellite pictorial data.
2.4 Attribute Data
The thematic maps are converted to digital mode using automated digitization process. These maps are prepared to a certain scale and show the attributes of entities by different symbols or coloring. The location of entities on the earth’s surface is then specified by means of an agreed co-ordinate system (Burrough, 1983). It is mandatory that all spatial data in a GIS are located with respect to a frame of reference (Aronoff, Stan.1989). For most GIS, the common frame of reference co-ordinate system is that of plane, Orthogonal Cartesian co-ordinates oriented conventionally North-South and East-West. This entire process is called geo-referencing (Mark et al, 1994). The same procedure is also applied on remote sensing data before it is used to prepare thematic maps from satellite data. This digitized data is then exported to ARC/INFO, Arc View, and ARC/GIS to create digital database for subsequent data analysis
2.5 Overall Methodology:
The overall methodology adopted for the present study is broadly divided into three phases, 1. Data collection and analysis
2. Field work and ground truth data collection
DATA COLLECTION
Primary Data Secondary Data
Data Base Creation
Spatial Data Base Attribute Data Base
Raw Satellite Data SOI Topo Sheets
Georefercing Extraction of GCPS Pre Processing
Mosaicing Enhancement
Final rectified Toposheet Final Merged geodata
out put
Thematic Layer (using visual interpretation technique)
Scanning Digitization Editing & overlay using
Arc/GIS platform
Spatial and Attribute Data Linkage From Satellite Image/Top sheet
LU/LC Soil Base Drainage Transport
Generation of Rural level information system
Agriculture, Population, Irrigation, Education, Power supply, Telephone and detail Socio-economic data.
3.Results and discussions and conclusions
3.1 Data Base Creation
[image:7.595.80.505.264.547.2]Satellite imageries are georeferenced using the Ground Control Points with SOI toposheets (1:25,000) as a reference and further merged using ERDAS (8.6) software to obtain a fused high resolution (5.8 m) LISS-IV MX and Cartosat PAN 2.5 m resolution. The study area is then delineated and subsetted from the fused data based on the latitude and longitude values and the final hard copy output is prepared for the generation of thematic maps using visual interpretation techniques.
Fig 2 showing toposheet and satellite imagery of daggubadu village
3.2 Spatial Database
3.2.1 Base map
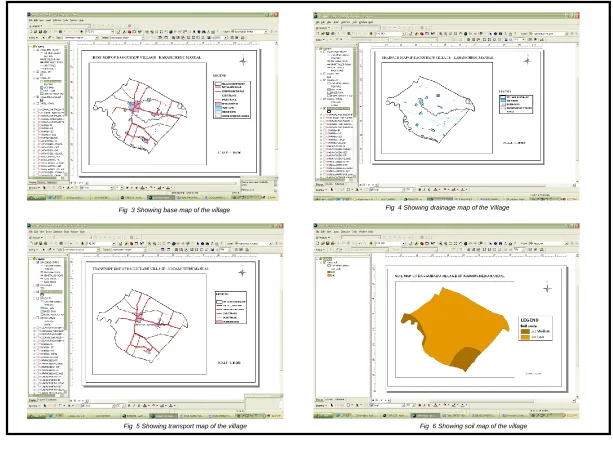
Base Map is prepared by using Survey of India topographic maps on 1:25,000 scale. All the settlements, major road network, water bodies areas are taken into consideration. By comparing the Survey of India topographic maps with that of the satellite image the size of all the settlements are increased and updated. The aerial extent of the study area is 19sq. km. (Fig3.)
3.2.2 Drainage
Dendritic drainage pattern has been observed in the study area .All the water bodies are divided into dry and wet areas. These wet (water spread) areas changes from time to time and some new tanks are found in the satellite images. For this reason, the drainage map is updated from the satellite. Nagarjun sagar jawahar canal is the major canal flowing through the study area (Fig.4)
3.2.3 Transport map
In the study area all the settlements are connected by metalled road or Un-metalled road. In the study area the image shows the transport network map of the Daggubadu village of karamchedu mandal. In the village cemented road is connected upto 0.452 kms, metalled road is connected upto 2kms, katcha road is conjnected upto 0.55kms. Transport disatance from state Highway 0.4 kms, transport disatance from national Highway 29kms. Bus facility is also available in the village.(fig.5)
3.2.4 Soil Map
In the study area most of the part is covering with very deep imperfectly drained cracking clay soils on flat lands, slightly flooded and associated with deep imperfectly drained cracking clay and calcareous soil. (fig.6)
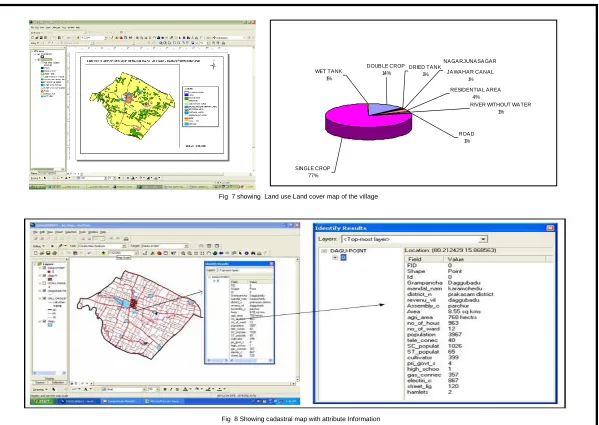
3.2.5 Land use/Land cover
double crop observed at some places of the study area. 1%of the area is covered with land with scrub, and rest of 18% of the area is covered with water bodies. (Fig.7)
3.2.6 Crops Cultivated in the study area:
Paddy, Maize, Bengal gram and Black gram, Chillies Cotton, Tobacco, jute has been identified in the study area. Lift irrigation facilities is available the study area.(table 1)
Crop Name Kharif Rabi Total
Irrigated
Unirri gated
Irriga
ted Unirrigated Irrigated
Unir rigat ed
Paddy 4 0 28 0 32 0
Maize 0 0 0 35 0 35
Black gram 0 162 0 182 0 344
Chillies 0 182 0 360 0 542
Cotton 0 114 0 0 0 114
Jute 0 20 0 0 0 20
Tobacco 0 0 0 6 0 6
Bengal gram 0 0 0 751 0 751
Area under Principal Crops In Hectares (Table-1)
3.3 ATTRIBUTE DATA BASE
3.3.1 Cadastral Information
Cadastral map of daggubadu village showing with all the land survey points. There are six plates covering in daggubadu village. all the six plates are adjusted by doing edge matching and through spatial adjustment and later on spatial information is linked to the spatial data.
Cadastral Map Showing Survey Numbers and spatial information about the village. (fig: 8 )
3.3.2 Population
Ward Wise Population (Fig.9)
3.3.3 Social Group Wise Population
Mainly three social groups in daggubadu village i.e., scheduled caste, scheduled tribes and others among then 1026 are scheduled caste 65 are scheduled tribe and rest of the population comes under others i.e., 2876 in the study area Most of the population belongs to others groups other than scheduled caste and scheduled tribes. (Table 2: showing social group wise population)
(Table 2-Showing the GroupWise population)
Financial Position Receipts (in Rupees)
1. Property Tax 127,438.00
2.Other taxes 221,944.00
3. Grants- in- Aid 100,388.00
4.Sale of Goods and Services 92,000.00
5. Miscellaneous Receipts 68,780.00
Total 610,550.00
Expenditure(in Rupees)
1.Staff Salaries 163,638.00
2.Roads 135,230.00
3.Purchase of Commodities and
services 122,213.00
4. Other Expenditure 179,401.00
TOTAL 600,482.00
(Table 3 -Showing the financial position)
Social Group Wise Population Males Females Total
a) Scheduled Caste 543 483 1026
b) Scheduled Tribes 31 34 65
3.3.7 Agricultural Machinery Implements
In the study area total 7 machinery implements are available among them 29 bullock carts,51 ploughs among them 28 wooden and 23 iron ploughs, 20 tractors are available and rest of the machinery are pumsets, dusters,power tillers and others.
3.3.8 Industries and Business
In the study area total 16 self employment enterprises are there. In that total 131 workers are involve in that among them 91 are male 40 are female workers.
ENTERPRISES Self Employment Enterprises
No. of Units Self Employment Enterprises
male female
SHOPS SELLING AGRICULTURE
EQUIPMENTS 7 7
FLOUR MILLS 4 4 4
TAILORING 13 9 4
CAR/SCOOTER/CYCLE REPAIR
SHOP 2 2 4
TEA STALL 14 10 4
SWEET SHOP
PAN/BEEDI/CIGARETTEE 12 8 4
MEAT SHOP 2 2
DISPENSARY AND MEDICINE
SHOP 3 3
ALLOPATHIC 4 3 1
RICKSHAW-PULLARS 5 5
AUTO/TAXI DRIVERS 3 3
STD BOOTHS 16 14 2
KIRANA SHOPS 8 8 8
LAUNDRY 9 9 9
BARBER SHOPS 4 4
3.3.9 Education Information
In the study area total 6 schools are available and all are primary schools and run by government management.
(Table 5: Showing the Education status)
For the development of any particular region, attention on the essential amenities such as drinking water, electricity, primary education, health etc, is the first priority. The rural level maps showing a number of particulars would facilitate in proper scientific developmental planning of the villages. IRS(Indian Remote Sensing Satellite) P6 LISS-IV MX with very high resolution shows magnificent potential to prepare the rural level thematic maps. Therefore village information system helps the planners to do planning at village level. Socio economic data of the study area is available in detail which can be updated in future. This is useful to find out the potential and drawbacks of any region before going for any developmental actions.The rural information system can be used to evaluate the Capacity of the area for its shortcomings and therefore to improve the productivity. India is a developing country and for the development of Indian economy rural level development is an significant factor. The micro level rural development minister in India is a apex body to build up the rural 170 areas by implementing abudent developmental programmes projects.It requires the latest and related spatial and non-spatial data at and village and mandal level. The research habitation name School Name
School
Type Management Facilities
MPPS (MAIN)
primary
school GOVT
Toilet facilities for girls and boys
MPPS (MOSQUE)
primary
school GOVT
Toilet facilities for girls and boys
Ambedkar nagar MPPS
primary
school GOVT
Toilet facilities for girls and boys
Indira colony MPPS
primary
school GOVT
Toilet facilities for girls and boys
Pothinavari
palem MPPS
primary
school GOVT
Toilet facilities for girls and boys
Naiduvari palem MPPS
primary
Fig 3 Showing base map of the village Fig 4 Showing drainage map of the Village
[image:14.792.83.696.61.514.2]WET TA NK 1%
SINGLE CROP 77%
DOUB LE CROP 14%
NA GA RJUNA SA GA R JA WA HA R CA NA L
1%
RIVER WITHOUT WA TER 1%
ROA D 1% RESIDENTIA L A REA
4% DRIED TA NK
1%
[image:15.792.97.696.49.474.2]Fig 7 showing Land use Land cover map of the village
References
[1] Ravindran.A, Jaishankar.J, GIS based information system for village level planning
page No:320-335. 13, 2000.
[2] Lillesand, T.M. and Kiefer, R.W. Remote Sensing and image Interpretation. Wiley Publication, New York, 1994.
[3] Burrough Peter A and Rachael A Mc Donnell, Principles of GIS, Oxford University Press, New York, 1983.
[4] Aronoff, Stan, Geographic Information Systems: A Management Perspective. Wdl Publications, Ottowa, Canada, .(1989).
[5] Mark A. Ross Et Al, Groundwater Modeling With GIS. Symposium on Groundwater Edited by Gerard.P. Lennon, (1991).
[6] Manual for preparation of zoning atlas for sitting of industries, Central Pollution Control Board, 1997-1998.
[7] Technical guidelines of Integrated Mission for Sustainable Development, National Remote Sensing Agency, Department of Space, Govt. of India, 1995.
[8] Technical guidelines of Disaster management Information System (DMIS), Maharashtra State Remote Sensing Centre, Nagpur, 1998.
[9] Technical guidelines of Rajiv Gandhi drinking water mission, National Remote Sensing Agency, Department of Space, Govt. of India, 1999.
[10] Toposheets prepared by Survey of India, 1978
[11] Manual of Land use / land cover mapping using satellite imagery, Part I and II, National Remote Sensing Agency, Department of Space, Govt. of India, 1989.
[12] Manual of proceedings for wasteland mapping, National Remote Sensing Agency, Department of Space, Govt. of India, 1986.
[13] Watershed atlas of India, Published by All India Soil and Landuse Survey, 1990 [14] U.S Department of Agriculture: Soil survey manual, Agricultural hand book No –18.4 SDA, Soil survey staff, Washington, D.C., 1951.
[15] Manual for preparation of zoning atlas for siting of industries, Central Pollution Control Board, 1997-98.