Command Area Management Study of Karjan
Dam Gujarat, India using Remote Sensing and
GIS
Priteshkumar R. Mori Dr. Pradeep P.Lodha
M.E. Student Associate Professor Department of Civil Engineering (WRM) Department of Civil Engineering
L.D.C.E- Ahmedabad G.E.C– VALSAD, Gujarat
Dr. Indra Prakash Chiragkumar S. Bhura
Faculty-BISAG M.E. Student
Department of Department of Civil Engineering (WRM) BISAG Gandhinagar, Gujarat L.D.C.E- Ahmedabad
Abstract
The command area management of a dam includes various parameters to studied i.e. ground water recharge, irrigation intensity, water use efficiency (WUE) knowing land use pattern, various thematic maps etc. These parameter are estimated using some calculation and by generating maps using Remote sensing and Geographical system (GIS). The software model used in this study is ArcGIS 9.3. The thematic maps of command area shows the land use pattern, canal network, village boundary, ground water level depth of Karjan dam command area.
Keywords: Irrigation Intensity, Remote Sensing, GIS, Ground Water Level, Water Use Efficiency
________________________________________________________________________________________________________
I.
I
NTRODUCTIONCommand area management, is on-farm development works such as, construction of field channels, land leveling/ shaping, realignment of field boundaries where necessary and set of action plans for rejuvenation of irrigation system. Management of water below the canal outlets offers the greatest scope for increased production and productivity in the irrigation commands.
Irrigation Water Management is defined as a process by which water resources are manipulated in order to provide water for plant growth. Management is accomplished through a system of hardware (structure) and the operating rules (software). An irrigation system has three basic components-delivery, application and disposal. These are part of hardware system. While delivery procedure encompass rate, duration and frequency, water allocation, scheduling of irrigation are the system software. Both these system are important in management of irrigation system.
Irrigation management may mean differently from person to person. To the irrigation system manager good management means equitable distribution of water without significant losses and with a fairly good degree of certainty.
Irrigation is vital for realizing full potential of agriculture sector and efficient utilization of our water resources, therefore assumed great significance. The distribution of rainfall is not only seasonal but also unequal. Partial failure or delayed arrival of the monsoon may cause extensive damage of crops. Besides, as the winter months are mostly dry, the cultivation of rabbi crops depends largely on irrigation so irrigation is needed
II.
S
TUDY AREAKarjan Reservoir Project is suited near Jitagadh village of Nandod Taluka, Dist Narmada of Gujarat state. River Karjan is left bank tributary of river Narmada. It is down stream of Sardar Sarovar Project. The project covers 51000 ha CCA through left and right bank canal system. The project area lies on the western coast of the Indian continent, between 730.5’ and 730.40’ longitude east and 210.30’ and 220.0’ latitude north. The elevation of the project area varies between 18m to 120m. above MSL.
III.
O
BJECTIVESTo analyze efficacy of command area development after construction of dam and canal network. Parameter included in this study are:
fed farming being less than half of that in the irrigated farming, there exists high potential of increasing crop production in India by extending irrigation to rain fed areas. The Government of India is spending considerably large amounts of money on creation and management of irrigation facilities to realize the untapped potential and to achieve the goal of sustainable agriculture. Irrigation scheduling deserves the top priority as an instrument of canal irrigation management and optimal crop production.
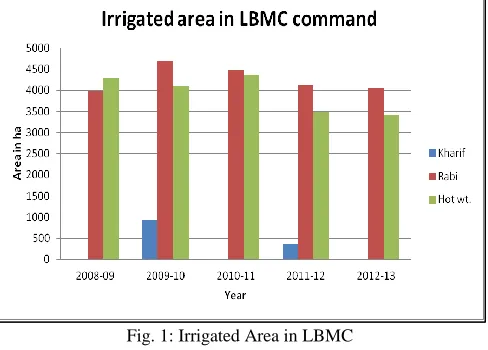
Fig. 1: Irrigated Area in LBMC
In study region the cultivable command area of left bank main canal(LBMC) is 37557 hector. From Fig.1 it is clear that in hot wt. a very less area is irrigated through canal irrigation. Major crop area is covered in rabi season. Maximum annual irrigated area was 31000 ha in 2009-10.
Fig. 2: Irrigated Area in RBMC
The total cultivable command area in Right Bank Main Canal(RBMC) is 10537 ha. It is clear from Figure.2 is maximum one third area of command is irrigated through canal irrigation. In rabi season maximum irrigation done through canal while in hot weather irrigation through canal is not satisfied.
Fig. 3: Canal Wise Intensity of Irrigation
VI.
G
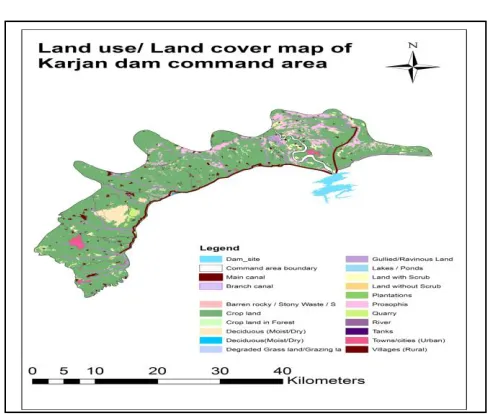
ENERATING THEMATIC MAPSFig. 4: Land Use Map of Karjan Dam Command Area
The methodology of LU/LC mapping has been explained in form of flowchart containing all steps as shown in figure 3.1. The data inputs in a Arc GIS 9.3 usually spatial and consists of thematic maps derived from a combination of existing maps and manual interpretation of remotely sensed imagery.
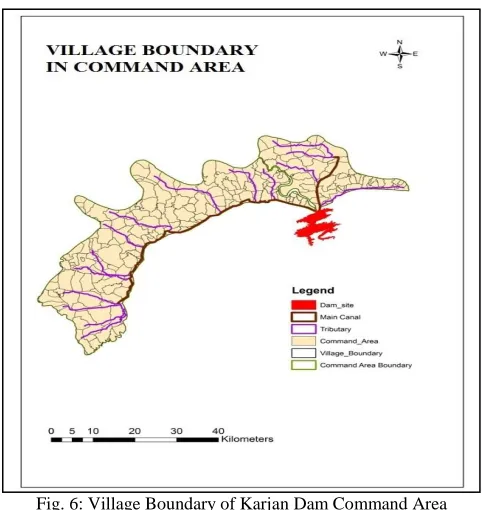
Fig. 6: Village Boundary of Karjan Dam Command Area
The irrigation water is originated from the Karjan dam and is distributed through Left and Right main canal. The canal network data structure is important to assess the spatial distribution of the water demand and supply for irrigation planning and management.
VII.
G
ROUNDW
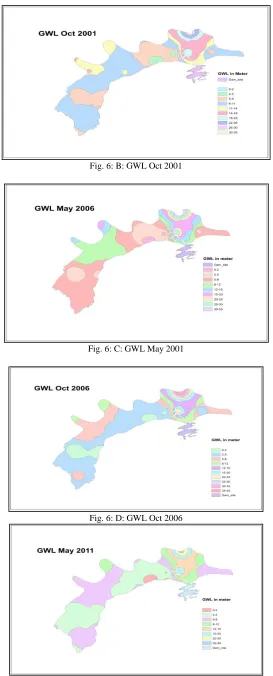
ATER LEVELElevation or level of the water table in a well when the pump is not operating. The level or elevation to which water would rise in a tube connected to an artesian aquifer or basin in a conduit under pressure.
Procedure for Generating Water Table Maps: A.
Open ArcGIS Add XY data IDW 3D
RECLASSIFY
1) Provide interval and give classes as required Raster to Polygon
Smooth Polygon
Clip required map area and save file File properties – categories- Grid code Export the map
Fig. 6: B: GWL Oct 2001
Fig. 6: C: GWL May 2001
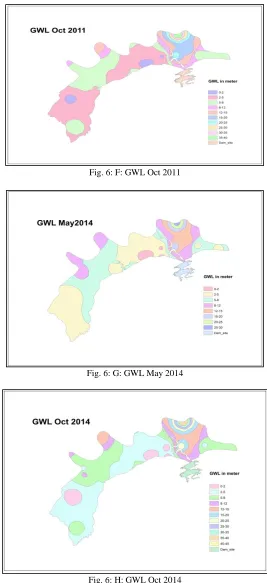
Fig. 6: F: GWL Oct 2011
Fig. 6: G: GWL May 2014
Fig. 6: H: GWL Oct 2014
VIII.
W
ATER USE EFFICIENCYWater use efficiency indicate the overall efficiency of the agricultural land, agro climate condition of existing canal network. It means considering all losses how much amount of water more then it release needs to make the existing irrigation system efficient.
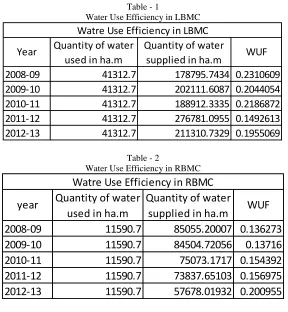
Table - 1
Water Use Efficiency in LBMC
Table - 2
Water Use Efficiency in RBMC
2008-09
11590.7
85055.20007 0.136273
2009-10
11590.7
84504.72056
0.13716
2010-11
11590.7
75073.1717 0.154392
2011-12
11590.7
73837.65103 0.156975
2012-13
11590.7
57678.01932 0.200955
Watre Use Efficiency in RBMC
year
Quantity of water
used in ha.m
Quantity of water
supplied in ha.m
WUF
IX.
C
ONCLUSIONThe overall impact of the canal irrigation has been increased in Rabi and Hot weather seasons. The maximum and minimum annual intensity of canal irrigation in RBMC was 58 percent and 28 percent respectively, whereas in LBMC 30 percent and 22 percent. In LBMC the major area is irrigated through ground water and due to perennial crop pattern of the area the requirement water is fulfill by both the ground water and canal releases.
A Land use map of the Karjan dam command area shows the 80 percent area of gross command area is covered by the crop land. Generating map of canal network with village boundary help to analyze the potentiality of canal to different places in command area.
Ground water level maps has been shows the change in area of water levels in last 14 years. In 2001 the maximum area is covered by 8 to 15 meter depth whereas in 2014 the major area covered by 2 to 8 meter depth of water. The result shows the ri se of water level after implementation of dam and canal network system.
Water Use Efficiency of canal irrigation in between 2008 to 2014 in RBMC command was 0.13 to 0.20 whereas in LBMC command there was 0.14 to 0.25 minimum and maximum respectively.
A
CKNOWLEDGMENTAuthors are thankful to the Director, BISAG and his technical staff for providing valuable help and facilities for conducting this study. Authors are also thankful to the Department of Karjan dam Rajpipla, Gujarat. for sharing the data and information of the study area.
R
EFERENCES[1] A. K. Mishra1, Bir Pal Singh2 and R. K. Sharma3, “Influence of canal water distribution system on water productivity of selected kharif crops in distributaries of Eastern Yamuna Canal (EYC) command area - Recent Research in Science and Technology 2012
[2] Anil Kumar “Application of GIS and RS on Catchment and Command Area Management of Hattikuni Dam, Yadgiri District. By, IJERT-VOL-3
[3] Chalumiri Ramesh Naidu, M.V.S.S.Giridhar “Geo-spatial Database Creation for Wazirabad Canal Command Area”, journal of Geographic Information System,2011, 3,290-297(JGIS-Scientific Research)
[4] Dwitikrishna Panigrahi “On-Farm Water Management Options for Increasing Irrigation Efficiency in Command Areas of Orissa”. Orissa review-October 2009.
[5] Dr.B.C.Punamia, et. Al “Irrigation and Water Power Engineering”, Laxmi Publication-New Delhi-110002
[6] G. D. Bhatt I*,· S. P. S. KushwahaI , S. NandyI , Kiran BargaliII· “Vegetation types and land uses mapping in South Gujarat using remote sensing and