Citation:
Weaving, D and Whitehead, SR and Till, K and Jones, BL (2017) The validity of real-time data gen-erated by a wearable microtechnology device. The Journal of Strength and Conditioning Research, 31 (10). pp. 2876-2879. ISSN 1064-8011 DOI: https://doi.org/10.1519/JSC.0000000000002127 Link to Leeds Beckett Repository record:
http://eprints.leedsbeckett.ac.uk/3898/ Document Version:
Article
The aim of the Leeds Beckett Repository is to provide open access to our research, as required by funder policies and permitted by publishers and copyright law.
The Leeds Beckett repository holds a wide range of publications, each of which has been checked for copyright and the relevant embargo period has been applied by the Research Services team.
We operate on a standard take-down policy. If you are the author or publisher of an output and you would like it removed from the repository, please contact us and we will investigate on a case-by-case basis.
ABSTRACT
The purpose of this study was to investigate the validity of global positioning system (GPS) and micro-electrical-mechanical-system (MEMS) data generated in real-time via a dedicated receiver. Post-session data acted as criterion as it is used to plan the volume and intensity of future training and is downloaded directly from the device. 25 professional rugby league players completed two training sessions wearing a MEMS device (Catapult S5, firmware version: 2.27). During sessions, real-time data was collected via the manufacturer receiver and dedicated software (Openfield v1.14) which was positioned outdoors at the same location for every session. GPS variables included total-, low- (0 to 3 m∙s-1), moderate- (3.1 to 5 m∙s -1), high- (5.1 to 7 m∙s-1) and very-high-speed (> 7.1 m∙s-1) distances. MEMS data included total session PlayerLoad™. When compared to post-session data, mean bias for total-, low-, moderate-, high- and very-high-speed distances were all trivial, with the typical error of the estimate (TEE) small, small, trivial, trivial and small respectively. Pearson correlation coefficients for total-, low-, moderate-, high- and very-high-speed distances were nearly perfect, nearly perfect, perfect, perfect and nearly perfect respectively. For PlayerLoad™, mean bias was trivial whilst TEE was moderate and correlation nearly perfect. Practitioners should be confident that when interpreting real-time speed-derived metrics, the data
generated in real-time is comparable to that downloaded directly from the device post-session. However, practitioners should refrain from interpreting accelerometer derived data (i.e. PlayerLoad™) or acknowledge the moderate error associated with this real-time measure.
INTRODUCTION
Quantifying the training and competition loads placed upon team sport players is an important process to promote adaptations and manage negative outcomes (e.g. injury).4,6 Global positioning systems (GPS) and micro-electrical-mechanical-systems (MEMS) are now commonly utilised to measure the external loads (e.g., walking, running, sprinting distances) accrued by athletes.10 Strength and conditioning coaches ‘download’ this data directly from the device (i.e. post-session data) to calculate training loads over longitudinal periods (e.g. 28- and 7-day averages of training load [i.e. acute:chronic workload ratio]) to inform the planning of both the volume and intensity of future field-based training sessions.4 Since the initiation of GPS and MEMS data within team-sports, microtechnology companies have provided the capability to monitor these loads in real-time via a dedicated receiver (Figure 1) to increase the control of training prescription.2 For example, if a strength and conditioning coach identified a need to limit the amount of high-speed-running during the session on that day, it is perceived that this can then be accurately controlled in real-time as players complete the session.
Although both derived from GPS and MEMS, real-time data arrives at the end-user
differently, via a specific receiver, whereas post-session data is downloaded directly from the device. Therefore, at present, practitioners should not assume that the data they receive in
real-time during the session is comparable to that which they use to inform the planning of training (e.g. post-session data). As the volume and intensity targets for each player are underpinned by longitudinal analyses conducted using post-session data and subsequently controlled in real-time7, understanding the agreement between real-time and post-training
aspect of training load monitoring.1 By comparing the signal (smallest meaningful difference [SMD]) to the noise (typical error [TE]) of real-time to post-session data, Aughey and Falloon (2010)1 found that whilst the signal exceeded the noise (SMD = 134.6 m; TE = 55.8 m) for total distance, this was reduced considerably during jogging (4.2 to 5.0 m∙s-1; SMD = 33.5 m; TE = 30.1 m) and running (5.0 to 6.9 m∙s-1; SMD = 31.9 m; TE = 31.3 m). In
particular, the noise exceeded the signal during real-time collection for sprinting (SMD = 17.3 m; TE = 23.7 m). The above findings showed that only total distance demonstrated an acceptable signal:noise ratio, suggesting that real-time data possesses limited validity and applicability to practice. However, despite the previous findings, developments in MEMS, its associated software and the increased number of variables available during real-time analysis, mean a reinvestigation is warranted.7 Strength and conditioning coaches who use
microtechnology devices in real-time require confidence that this data is comparable to that which is used to conduct detailed analyses of the accumulation and distribution of training load. Therefore, the aim of the current study was to re-establish the validity of real-time
MEMS data compared to post-session data derived from a commonly used software platform (Catapult Openfield).
METHODS
Experimental Approach to the Problem
prescription of training content relating to the sessions. Real-time GPS and MEMs data was generated during each session and compared to that downloaded directly from the device
post-session. Therefore, players provided 40 session observations in total comprising of both
real-time and post-session data per observation. The lead researcher was experienced (> 5 years) in operating the microtechnology system and players possessed full familiarisation with the devices as part of their regular monitoring practices (i.e. > 3 seasons).
Subjects
Twenty male professional rugby league players (age: 27.0 ± 5.0; height: 184.3 ± 6.9 cm; weight: 94.4 ± 11.7 kg) from one European Super League club participated in the current study. Ethics approval was gained by the universities Institutional Review Board conforming to the spirit of the Helsinki declaration and written informed consent was gained from all participants following information of the benefits and risks of the investigation.
Procedures
During all sessions, players wore a GPS and MEMS device (Optimeye S5, Catapult
Innovations, Scoresby, Victoria) which included 10 Hz GPS, 100-Hz tri-axial accelerometer, gyroscope and magnetometer (firmware version 2.27; Figure 1). This positioned between the scapulae within a manufacturer designed vest and operated by the lead researcher according to typical procedures.7 10 Hz GPS has been reported to be valid and reliable for quantifying
Innovatons, Scoresby, Victoria). This was positioned outdoors on a grass pitch at the same location for every training session, positioned 5 metres away from the ‘in-goal’ line so that at any time during the session, players were within 5 to 105 metres of the receiver. This distance falls within manufacturer recommended radius of 150 metres (personal communication with manufacturers). During each session, periods of training were ‘clipped’ in real-time so that no data recorded for analysis included scheduled periods of no activity (i.e. drinks breaks). These periods were automatically synchronised between real-time and post-training
conditions within the software.
***** INSERT FIGURE 1 HERE*****
The total distance (m) covered during a training session was compared for real-time and post-training within arbitrarily demarcated speed zones. This included low- (0 to 3 m∙s-1),
moderate- (3.1 to 5 m∙s-1), high- (5.1 to 7 m∙s-1) and very-high-speed-distances (> 7.1 m∙s-1). Derived from the tri-axial accelerometer, the total PlayerLoad™ accumulated in each training session was compared between real-time and post-training conditions. PlayerLoad™ is a modified vector magnitude which aims to encapsulate all velocity, acceleration, change of direction and collision demands experienced by players.3 It is expressed as the square root of the sum of the squared instantaneous rate of change in acceleration in each of the three vectors (X: mediolateral, Y: anterio-posterior, and Z: vertical) divided by 100 and expressed in arbitrary units (AU).2,3
STATISTICAL ANALYSES
rated as trivial (< 0.19), small (0.2 to 0.59), medium (0.6 to 1.19) or large (1.2 to 1.99).5 The standardised TEE was rated as trivial (< 0.1), small (0.1 to 0.29), moderate (0.3 to 0.59) or
large (> 0.59).5 Correlation coefficient magnitudes were rated as trivial (0 to 0.09), small (0.1 to 0.29), moderate (0.3 to 0.49), large (0.5 to 0.69), very large (0.7 to 0.89), nearly perfect
(0.9 to 0.99) and perfect (> 0.99).5
RESULTS
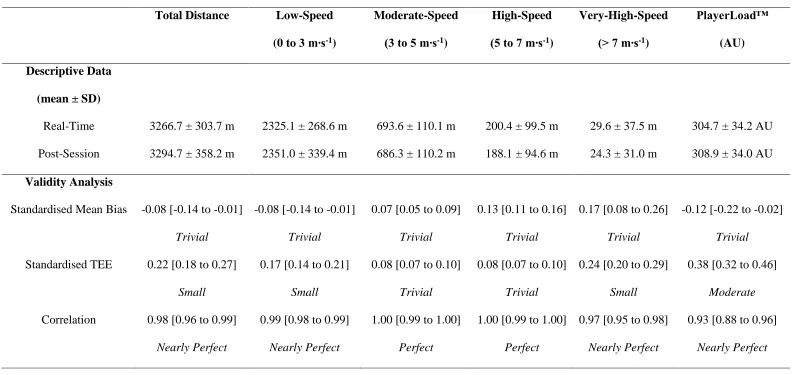
The mean duration of the sessions were 50.3 ± 2.6 mins. Table 1 highlights the mean ± standard deviation of the external loads (PlayerLoad™ [AU], total-, low-, moderate-, high- and very-high-speed distances [m]) plus the standardised mean bias, TEE and Pearson correlation coefficients all with 90% CL for real-time and post-session conditions.
**** INSERT TABLE 1 HERE****
The regression equation to estimate post-session data from real-time data for each variable is:
Y = intercept + (slope x X)
Where Y is the estimated post-session data for a given variable and X is the real-time data for a given variable.
The regression equations for each variable are:
Total-Distance:
Y = -467.601 + (1.152 x X)
Low-Speed Distance (0 to 3 m∙s-1):
Moderate-Speed Distance (3 to 5 m∙s-1):
Y = -5.814 + (0.998 x X)
High-Speed Distance (5 to 7 m∙s-1):
Y = -1.959 + (0.948 x X)
Very-High-Speed Distance (> 7 m∙s-1):
Y = 0.528 + (0.804 x X)
PlayerLoad™:
Y = 27.899 + (0.922 x X)
DISCUSSION
This study assessed the agreement between GPS and MEMS data derived by either real-time
accrued by players when compared to data downloaded directly from the device. However, practitioners should be cautious of interpreting real-time accelerometer derived data. For strength and conditioning coaches working with team-sport players, controlling and developing their high-speed running exposure has been suggested to be an important process to reduce negative training outcomes such as injury.8 Given the trivial error between real-time and post-session data, the findings of the current study suggest that practitioners should be confident of making decisions in real-time regarding the accumulation of a players high-speed (5 to 7 m∙s-1) distance. However, they should acknowledge the small error between
post-session and real-time when quantifying very-high-speed (> 7.1 m∙s-1) running exposure. The current findings somewhat support earlier research1 using previous models of the
microtechnology device (MinimaxXX, Team Sport 2.0, Catapult Innovations) which report poorer agreement for very-high-speed running (i.e. > 7 m∙s-1) compared to lower speeds, although in the current study very-high-speed running was still found to possess acceptable error.
For collision-based team-sports (e.g. rugby league, American football), quantifying collision- and accelerative-based activity during training and competition is an important aspect3 and therefore, monitoring accelerometer derived measures in real-time is an attractive capability for practitioners. However, whilst post-session PlayerLoad™ data has been found to be both
reliable and valid2, in real-time, moderate errors were found when compared to the data downloaded directly from the device. It is unknown why real-time PlayerLoad™ data demonstrated greater errors compared to speed-derived methods. It is possible that
differences in how the real-time receiver receives data from the 100Hz tri-axial accelerometer compared to 10Hz GPS can explain the greater errors associated with real-time
PlayerLoad™. Therefore, practitioners should ideally refrain from interpreting real-time
from real-time data, the regression equations provided in the current study can be used whilst acknowledging the error associated with this.
PRACTICAL APPLICATIONS
Practitioners can be confident in making decisions of the training load imposed using data that calculates the real-time distance covered in low- (0 to 3 m·s-1) to high-speed (5.1 to 7 m·s-1) thresholds derived from the Catapult S5 microtechnology device. However,
practitioners should focus on speed-derived methods given the errors associated with real-time tri-axial accelerometer data.
REFERENCES
1. Aughey RJ, Faloon C. Real-time versus post-game GPS data in team sports. J Sci Med Sport. 2010;13:348-349.
2. Barrett S, Midgley A, Lovell R. PlayerLoad™: reliability, convergent validity, and influence of unit position during treadmill running. Int J Sports Physiol Perform. 2014;9:945-952.
3. Gabbett TJ. Relationship between accelerometer load, collisions, and repeated high-intensity effort activity in rugby league players. J Strength Cond Res. 2015;29:3424-3431.
4. Gabbett TJ. The training-injury prevention paradox: should athletes be training smarter and harder? Br J Sports Med. 2016;50:273-280.
5. Hopkins WG. Spreadsheets for analysis of validity and reliability. Sportscience.
2015;19:36-42.
6. Impellizzeri FM, Rampinini E, Marcora S. Physiological assessment of aerobic training in soccer. J Sports Sci. 2005;23:583–592. PubMed
7. Malone JJ, Lovell R, Varley MC, Coutts AJ. Unpacking the black box: applications and considerations for using GPS devices in sport. Int J Sports Physiol Perform. 2016;13:1-30.
8. Malone S, Roe M, Doran DA, Gabbett TJ, Collins K. High chronic training loads and exposure to bouts of maximal velocity running reduce injury risk in elite Gaelic football. J Sci Med Sport. 2016; Advance online publication. doi:
10.1016/j.jsams.2016.08.005
9. Scott MT, Scott TJ, Kelly VG. The validity and reliability of global positioning systems in team sport: a brief review. J Strength Cond Res. 2016;30:1470-1490. 10.Weaving D, Marshall P, Earle K, Nevill A, Abt G. Combining internal- and
Table 1. Comparison of real-time and post-session GPS and MEMS data including standardised mean bias, typical error of estimate (TEE) and Pearson correlation coefficient, all with 90% confidence limits.
Total Distance Low-Speed
(0 to 3 m∙s-1)
Moderate-Speed (3 to 5 m∙s-1)
High-Speed (5 to 7 m∙s-1)
Very-High-Speed (> 7 m∙s-1)
PlayerLoad™
(AU)
Descriptive Data (mean ± SD)
Real-Time 3266.7 ± 303.7 m 2325.1 ± 268.6 m 693.6 ± 110.1 m 200.4 ± 99.5 m 29.6 ± 37.5 m 304.7 ± 34.2 AU Post-Session 3294.7 ± 358.2 m 2351.0 ± 339.4 m 686.3 ± 110.2 m 188.1 ± 94.6 m 24.3 ± 31.0 m 308.9 ± 34.0 AU Validity Analysis
Standardised Mean Bias -0.08 [-0.14 to -0.01]
Trivial
-0.08 [-0.14 to -0.01]
Trivial
0.07 [0.05 to 0.09]
Trivial
0.13 [0.11 to 0.16]
Trivial
0.17 [0.08 to 0.26]
Trivial
-0.12 [-0.22 to -0.02]
Trivial
Standardised TEE 0.22 [0.18 to 0.27]
Small
0.17 [0.14 to 0.21]
Small
0.08 [0.07 to 0.10]
Trivial
0.08 [0.07 to 0.10]
Trivial
0.24 [0.20 to 0.29]
Small
0.38 [0.32 to 0.46]
Moderate
Correlation 0.98 [0.96 to 0.99]
Nearly Perfect
0.99 [0.98 to 0.99]
Nearly Perfect
1.00 [0.99 to 1.00]
Perfect
1.00 [0.99 to 1.00]
Perfect
0.97 [0.95 to 0.98]
Nearly Perfect
0.93 [0.88 to 0.96]