0095-1137/05/$08.00⫹0 doi:10.1128/JCM.43.10.5332–5337.2005
Copyright © 2005, American Society for Microbiology. All Rights Reserved.
Evaluation of Universal Probes and Primer Sets for Assessing Total
Bacterial Load in Clinical Samples: General Implications and
Practical Use in Endodontic Antimicrobial Therapy
H. P. Horz,
1M. E. Vianna,
1,2B. P. F. A. Gomes,
2and G. Conrads
1*
Division of Oral Microbiology and Immunology, Department of Operative and Preventive Dentistry & Periodontology,
and Department of Medical Microbiology, RWTH Aachen University Hospital, Aachen, Germany,1and
Endodontic Area, Department of Restorative Dentistry, Piracicaba Dental School,
State University of Campinas, Piracicaba, SP, Brazil2
Received 16 February 2005/Returned for modification 26 April 2005/Accepted 20 July 2005
By reexamining 10 previously published “universal” PCR assays using the ARB phylogenetic software package and database with 41,000 16S rRNA gene sequences, we found that they differed considerably in their coverage of the domainBacteria. We evaluated the broadest-range real-time quantitative PCR protocol for its efficacy in measuring the antimicrobial effects of endodontic treatments.
Bacteria in a tooth’s root canal both initiate and perpetuate periapical inflammatory lesions (7). Thus, the principal goal of root canal treatment is to reduce the number of bacteria (1); conversely, the principal cause of treatment failure is consid-ered to be the residual bacteria in the apical part of the root canal (18, 24). To evaluate the efficacy of any antimicrobial therapy, it is therefore important to determine the total num-ber of bacteria in the root canal before and after treatment. For the enumeration of bacteria, the real-time quantitative PCR (RTQ-PCR) technology represents a promising alterna-tive to the traditional but time-consuming and error-prone cultivation approach. However, the microbiota involved in endodontic infections is not a predefined group of pathogens but makes up a complex, dynamic, and varying consortium of many oral bacterial species (5, 22, 23). Thus, any RTQ-PCR-based evaluation of an endodontic treatment ideally should be able to measure the entire bacterial load without missing cer-tain taxa. While several PCR-based pitfalls due to cell lysis techniques or PCR conditions have been reported (31), the universality of “universal” PCR primers has been less fully evaluated. Numerous broad-range 16S rRNA gene-directed primers and probes have been developed with the intention of targeting all bacteria present in clinical or environmental sam-ples (10, 21, 26); to this end, the quality of PCR assays is usually confirmed by testing representative species of a wide range of bacterial taxa. However, since it is impossible to empirically test all bacterial strains it cannot be proven whether those PCR assays considered to be universal actually encompass the entire bacterial spectrum. For example, some evidence exists that even the prominent pair of primers, “27F” and “1492R” (32), which target highly conserved regions of the 16S rRNA gene, are not completely universal (3, 20, 28). For every PCR-based assay for the detection of bacteria in clinical samples in general and for the enumeration of endodontic
bacteria in particular, it is therefore crucial to know the taxon coverage of the PCR system used. We addressed this issue by evaluating in silico 10 previously published broad-range 16S rRNA gene-directed PCR assays using the most updated ARB database (13). ARB is a graphically oriented software package that comprises various tools for database handling and se-quence analysis. The special advantage of ARB is the devel-opment of a structured database of more than 41,000 validated 16S rRNA gene sequences in an aligned format that includes all recognized division-level lineages of the domainBacteria. The high number of interacting software tools integrated in ARB permits not only a general probe evaluation against all sequences but also a disclosure of all phylogenetic groups (in-cluding clinically relevant taxa) that are not covered.
Using the function “probe match” in ARB, we determined for each assay the proportion of 16S rRNA gene sequences that perfectly matched with the primers and, if given, with the hybridization probe (Table 1). Although the site and the type of a mismatch are not equally critical for successful amplifica-tion in every case, the mere presence of a mismatch can lead to a biased retrieval of different 16S rRNA gene sequence types in a multitemplate PCR assay (25, 31) and, ultimately, to in-accurate quantification. Therefore, we considered only perfect matches (i.e., no mismatch between probe and target DNA) for estimating the “universal” capacity of the PCR assays. Using these criteria, we observed significant differences among protocols, as seen in Table 1. The PCR assays used by Siqueira et al. (23), Corless et al. (2), and Khan et al. (8) showed only a low incidence of perfect matches (5 to 17%); and protocols published by Labrenz et al. (12) and Yang et al. (33) indicated perfect matches with 27% and 35% of the sequences, respec-tively. The RTQ-PCR described by Klaschik et al. (9) had a 41% coverage; however, the gram-positive and gram-negative organism-specific hybridization probes matched only a very small proportion of the sequences included in ARB. In con-trast, we observed a much higher percentage of perfect matches with the protocols used by Takai et al. (26), Tseng et al. (27), Maeda et al. (14), and Nadkarni et al. (17), with the last protocol having the highest scores for both PCR
amplifi-* Corresponding author. Mailing address: Division of Oral Micro-biology and Immunology, University Hospital (RWTH), Pauwelsstrasse 30, D-52057 Aachen, Germany. Phone: 9632141. Fax: 49-241-8082483. E-mail: [email protected].
5332
on May 15, 2020 by guest
http://jcm.asm.org/
TABLE 1. Overview of broad-range bacterial PCR assays and the proportion of perfect matches between primers (and the probe, if given) with the target molecule, determined by in silico analysis of all 16S rRNA gene sequences included in the ARB database a Assay no. Primer or probe Sequence (5 ⬘ –3 ⬘ ) Escherichia coli position Reference Intended application as published % Perfect matches b Detection system 1 Forward TCCTACGGGAGGCAGCAGT 331–349 Nadkarni et al. (17) RTQ-PCR detection of bacteria in carious dentine 74, 63 ABI PRISM 7700, TaqMan (ABI c ) Reverse GGACTACCAGGGTATCTAATCCTGTT 772–797 Probe CGTATTACCGCGGCTGCTGGCAC 506–528 2 Forward GTGSTGCAYGGYTGTCGTCA 1048–1067 Maeda et al. (14) RTQ-PCR detection of bacteria in dental plaque 73 GeneAmp 5700, SYBR green (ABI) Reverse ACGTCRTCCMCACCTTCCTC 1175–1194 3 Forward “p201” GAGGAAGGIGIGGAIGACGT 1175–1194 Tseng et al. (27) RTQ-PCR detection of bacterial pathogens 71 GeneAmp 5700, Sybr green (ABI) Reverse “p1370” AGICCCGIGAACGTATTCAC 1371–1390 4 Forward “Bac349F” AGGCAGCAGTDRGGAAT 349–365 Takai and Horikoshi (26) RTQ-PCR detection of bacte-ria in various environments 64, 55 GeneAmp 5700, TaqMan (ABI) Reverse “Bac806R” GGACTACYVGGGTATCTAAT 787–806 Probe “Bac516F” TGCCAGCAGCCGCGGTAATACRDAG 516–540 5 Forward “PLK1” TACGGGAGGCAGCAGT 343–358 Klaschik et al. (9) Gram-specific RTQ-PCR detection of 17 intensive care unit relevant pathogens 41, 3 (gram-negative bacteria), 0.1 (gram-positive bacteria) LightCycler (Roche) Reverse “PLK2” TATTACCGCGGCTGCT 520–535 Probe “ISN2” CCGCAGAATAAGCACCGGCTAACTCCGT 489–516 Probe “ISP2” CCTAACCAGAAAGCCACGGCTAACTACGTG 488–517 6 Forward “p891F” TGGAGCATGTGGTTTAATTCGA 943–964 Yang et al. (33) RTQ-PCR detection of bacterial pathogens 39, 35 ABI PRISM 7700, TaqMan (ABI) Reverse “p1033R” TGCGGGACTTAACCCAACA 1083–1101 Probe “UniProbe” CACGAGCTGACGACARCCATGCA 1052–1074 7 Forward “Com1” CAGCAGCCGCGGTAATAC 519–536 Labrenz et al. (12) RTQ-PCR analysis of bacteria in aquatic systems 27 iCycler, SYBR green (Bio-Rad) Reverse “Com2” CCGTCAATTCCTTTGAGTTT 907–926 8 Forward “ANA1F” GCCTAACACATGCAAGTCGA 46–65 Khan et al. (8) T-RFLP d analysis of intestinal microflora 17 Reverse “K2R” GTATTACCGCGGCTGCTGG 518–536 9 Forward CCATGAAGTCGGAATCGCTAG 1327–1347 Corless et al. (2) RTQ-PCR detection of bacterial pathogens 8, 7 ABI PRISM 7700, TaqMan (ABI) Reverse ACTCCCATGGTGTGACGG 1403–1420 Probe CGGTGAATACGTTCCCGGGCCTTGTAC 1369–1395 10 Forward “968f” AACGCGAAGAACCTTAC 968–984 Siqueira et al. (23) DGGE e analysis of endodontic bacteria 5 Reverse “1401r” CGGTGTGTACAAGACCC 1385–1401 a Only PCR assays that amplified fragments of less than 500 bp were considered in order to meet the ABI guidelines for RTQ-PCR. Only assays with primers loc ated within E. coli positions 45 and 1430 (the testable range of the ARB sequences) were included in the study. The list of PCR protocols may not be complete. The ARB database currently consists of 41,019 16S rRNA gene sequences of at least 1,000 bp in length in an aligned format (last update, 2004). b Numbers indicate the proportion of 16S rRNA gene sequences that showed a perfect match with both the forward and the reverse primers; underlining indi cates the proportion of perfect matches with both primers and the detection probe. c ABI, Applied Biosystems. d T-RFLP, terminal restriction fragment length polymorphism. e DGGE, denaturing gradient gel electrophoresis.
on May 15, 2020 by guest
http://jcm.asm.org/
cation and probe hybridization (i.e., 74% and 63%, respec-tively). However, as is evident from Table 2, no PCR protocol includes all taxonomic groups (i.e., phyla), and among them-selves, the protocols vary strongly in their individual coverage. For example, although it is superior to all the other assays, the protocol of Nadkarni et al. (17) covers the phyla chlamydiae and spirochetes only poorly (Table 2), with the latter phylum including such clinically relevant genera as Treponema and
Borrelia. These data reflect the difficulty of designing a
broad-range protocol which would evenly cover all taxonomic groups. Because a “perfect” universal assay is lacking, we focused on the protocol of Nadkarni et al. (17) as the one that came the closest to being perfect (according to overall coverage) and whose general methodological characteristics (e.g., reproduc-ibility and sensitivity) had been extensively validated (11, 15, 17).
Since to our knowledge the RTQ-PCR technology has not so far been applied to the field of endodontics, our aim was to test the protocol of Nadkarni et al. (17) for its principal applica-bility in quantifying endodontic bacteria. To accomplish this, we measured the bacterial load before and after applying two different intracanal irrigating substances. Thirty-two patients who presented for root canal treatment at the Piracicaba Den-tal School and who were otherwise healthy and who had not received antibiotic treatment during the previous 3 months were selected for this study. Their ages ranged from 19 to 63 years. All teeth selected were uniradicular and asymptomatic, did not respond to sensitivity testing, had not received previous
endodontic treatment, and showed radiographic evidence of periapical bone loss. The teeth were randomly divided into two treatment groups: the 2.5% NaOCl (group 1,n⫽16) and the 2% chlorhexidine (CHX) gel (group 2,n⫽16). The irrigating substances were prepared according to Vianna et al. (29).
[image:3.585.43.543.80.224.2]Access to the pulp chamber and sample collection (before and after endodontic procedures) were performed by the pro-tocol described by Jacinto et al. (6). The initial samples were collected and transported to the laboratory within 15 min. Aliquots (100l) were immediately processed for culture anal-ysis, while 900l was frozen (⫺70°C) for later molecular anal-ysis. The working length (1 mm from the radiographic apex) was established with a radiograph and was confirmed with an apical locator (Novapex; Forum Technologies, Israel). The apical preparation was performed by using K files (DYNA-FIDM, Bourges, France), followed by the use of Step-Back preparation. In the first group, the root canal was irrigated with 5 ml of 2.5% NaOCl after each filing; and in the second group, the root canal was irrigated with 1 ml of the CHX gel and immediately after with 4 ml of physiological saline solution. The working time for the chemomechanical procedure was 20 min for all cases. Before collection of the second sample, the root canal was rinsed for 1 min with 5 ml of irrigating neutral-izers (for the NaOCl group, 0.5% sodium thiosulfate, 0.5% Tween 80, and 0.07% lecithin). The time that elapsed for the subsequent processing of the second samples was identical to the time required for the initial sample set (see above). Finally, all teeth were filled and the access cavities were restored with
TABLE 2. Coverage of selected bacterial phyla by 10 different broad-range PCR assaysa
Reference
% Coverage of the following phyla (no. of sequences in ARB): Proteobacteria
(18,920)
Actinobacteria (5,348)
Firmicutes (8,022)
Spirochetes (852)
Chlamydiae (168)
Bacteroidetes (2,677)
Further phyla (5,032)
Nadkarni et al. (17) 86, 74 82, 72 81, 69 1,⬍1 0 83, 76 16, 9
Maeda et al. (14) 79 85 72 44 1 61 54
Tseng et al. (27) 77 77 73 57 79 62 38
Takai and Horikoshi (26)
63, 56 82, 73 80, 69 ⬍1,⬍1 0 87, 65 18, 8
Klaschik et al. (9)b 67, 4 1, 0 8,⬍1 ⬍1, 0 0 84,⬍1 20, 0
Yang et al. (33) 47, 42 ⬍1,⬍1 55, 51 88, 85 82, 81 16, 12 21, 17
Labrenz et al. (12) 33 1 3 ⬍1 ⬍1 83 40
Khan et al. (8) 29 1 9 ⬍1 0 11 9
Corless et al. (2) 16, 16 0 ⬍1,⬍1 0 0 ⬍1, 0 ⬍1,⬍1
Siqueira et al. (23) ⬍1 3 20 0 ⬍1 0 1
aNumbers indicate the proportion of 16S rRNA gene sequences within the particular phylum that showed a perfect match with both the forward and the reverse
primers; underlining indicates the proportion of perfect matches with both primers and the detection probe. The assignment of sequences from uncultured bacteria to the indicated phylum was based on the topology of the universal tree implemented in ARB.
bFor the protocol of Klaschik et al. (9), underlined values within the actinobacteria and the firmicutes were retrieved by testing with the gram-positive
organism-specific probe; all other phyla were tested by use of the gram-negative organism-organism-specific probe.
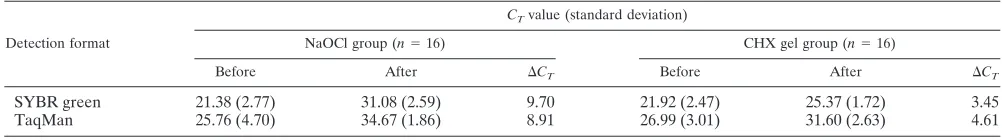
TABLE 3. Mean RTQ-PCRCTvalues determined for bacterial samples of 32 patients with periapical lesions before and after
chemomechanical treatment with either NaOCl or CHX gel as the irrigating substancea
Detection format
CTvalue (standard deviation)
NaOCl group (n⫽16) CHX gel group (n⫽16)
Before After ⌬CT Before After ⌬CT
SYBR green 21.38 (2.77) 31.08 (2.59) 9.70 21.92 (2.47) 25.37 (1.72) 3.45
TaqMan 25.76 (4.70) 34.67 (1.86) 8.91 26.99 (3.01) 31.60 (2.63) 4.61
aData acquisition was based on a threshold value of 0.2, which was approximately 10 times the background fluorescence, defined as the mean fluorescence values
for the first 6 to 15 PCR cycles. All samples were run in duplicate. The variation between duplicates was less than 3%.
on May 15, 2020 by guest
http://jcm.asm.org/
[image:3.585.41.542.639.709.2]TABLE 4. Bacterial load and percent reduction determined for root canal samples of 32 patients with periapical lesions before and after chemomechani cal treatment with either NaOCl or CHX gel as the irrigating substance a Sample NaOCl group CHX gel group SybrGreen TaqMan Sample SYBR green TaqMan Bacterial load (rRNA gene copy no.) % Reduction Bacterial load (rRNA gene copy no.) % Reduction Bacterial load (rRNA gene copy no.) % Reduction Bacterial load (rRNA gene copy no.) % Reduction Before After Before After Before After Before After H1 19 ⫻ 10 6 2 ⫻ 10 2 99.99 32 ⫻ 10 6 64 ⫻ 10 4 98.00 C1 69 ⫻ 10 3 63 ⫻ 10 3 8.69 46 ⫻ 10 3 41 ⫻ 10 3 10.86 H2 32 ⫻ 10 2 1 ⫻ 10 2 96.87 43 ⫻ 10 3 12 ⫻ 10 3 72.09 C2 16 ⫻ 10 4 78 ⫻ 10 2 95.12 36 ⫻ 10 4 11 ⫻ 10 3 96.94 H3 19 ⫻ 10 4 Negative 100 37 ⫻ 10 4 25 ⫻ 10 3 93.24 C3 47 ⫻ 10 4 38 ⫻ 10 4 19.14 89 ⫻ 10 4 48 ⫻ 10 4 46.06 H4 15 ⫻ 10 6 2 ⫻ 10 2 99.99 11 ⫻ 10 6 76 ⫻ 10 2 99.93 C4 20 ⫻ 10 4 70 ⫻ 10 3 65.00 24 ⫻ 10 4 22 ⫻ 10 3 90.83 H5 30 ⫻ 10 5 2 ⫻ 10 2 99.99 43 ⫻ 10 5 42 ⫻ 10 2 99.90 C5 13 ⫻ 10 6 53 ⫻ 10 3 99.59 84 ⫻ 10 5 28 ⫻ 10 3 99.66 H6 20 ⫻ 10 5 14 ⫻ 10 3 99.30 31 ⫻ 10 5 16 ⫻ 10 3 99.48 C6 16 ⫻ 10 5 28 ⫻ 10 3 98.25 24 ⫻ 10 5 34 ⫻ 10 4 85.83 H7 22 ⫻ 10 6 22 ⫻ 10 2 99.99 11 ⫻ 10 6 12 ⫻ 10 3 99.89 C7 30 ⫻ 10 5 43 ⫻ 10 3 98.56 37 ⫻ 10 5 11 ⫻ 10 2 99.97 H8 53 ⫻ 10 6 1 ⫻ 10 2 99.99 36 ⫻ 10 6 17 ⫻ 10 3 99.95 C8 63 ⫻ 10 4 15 ⫻ 10 3 97.61 10 ⫻ 10 5 10 ⫻ 10 3 99.00 H9 71 ⫻ 10 6 21 ⫻ 10 3 99.97 59 ⫻ 10 6 36 ⫻ 10 3 99.93 C9 43 ⫻ 10 6 47 ⫻ 10 3 99.89 67 ⫻ 10 6 51 ⫻ 10 3 99.92 H10 12 ⫻ 10 7 16 ⫻ 10 3 99.98 87 ⫻ 10 6 31 ⫻ 10 4 99.64 C10 18 ⫻ 10 4 61 ⫻ 10 3 66.11 42 ⫻ 10 4 44 ⫻ 10 3 89.52 H11 33 ⫻ 10 3 3 ⫻ 10 2 99.09 33 ⫻ 10 3 17 ⫻ 10 3 48.48 C11 14 ⫻ 10 6 56 ⫻ 10 4 96.00 21 ⫻ 10 6 12 ⫻ 10 5 94.28 H12 58 ⫻ 10 4 2 ⫻ 10 2 99.96 10 ⫻ 10 5 17 ⫻ 10 3 98.30 C12 12 ⫻ 10 5 66 ⫻ 10 3 94.50 18 ⫻ 10 5 54 ⫻ 10 3 97.00 H13 19 ⫻ 10 5 1 ⫻ 10 2 99.99 24 ⫻ 10 5 12 ⫻ 10 3 99.30 C13 47 ⫻ 10 5 13 ⫻ 10 4 97.23 91 ⫻ 10 5 34 ⫻ 10 4 96.26 H14 25 ⫻ 10 5 3 ⫻ 10 2 99.98 21 ⫻ 10 5 81 ⫻ 10 2 99.61 C14 30 ⫻ 10 5 60 ⫻ 10 3 98.00 44 ⫻ 10 5 11 ⫻ 10 4 97.50 H15 19 ⫻ 10 6 1 ⫻ 10 2 99.99 17 ⫻ 10 6 10 ⫻ 10 3 99.94 C15 17 ⫻ 10 6 15 ⫻ 10 4 99.11 18 ⫻ 10 6 44 ⫻ 10 4 97.55 H16 22 ⫻ 10 5 18 ⫻ 10 3 99.18 35 ⫻ 10 6 22 ⫻ 10 3 99.93 C16 67 ⫻ 10 6 42 ⫻ 10 5 93.73 63 ⫻ 10 6 96 ⫻ 10 5 84.76 Mean 21 ⫻ 10 6 45 ⫻ 10 2 99.64 19 ⫻ 10 6 73 ⫻ 10 3 94.23 Mean 10 ⫻ 10 6 37 ⫻ 10 4 82.91 12 ⫻ 10 6 80 ⫻ 10 4 86.62 Median 28 ⫻ 10 5 2 ⫻ 10 2 99.99 76 ⫻ 10 5 16 ⫻ 10 3 99.63 Median 23 ⫻ 10 5 62 ⫻ 10 3 96.62 30 ⫻ 10 5 53 ⫻ 10 3 96.60 a DNA from Prevotella nigrescens (ATCC 33563) was used to establish the standard curve for calculating the gene copy numbers. The linear scope of detection ranged from 10 2 to 10 8 .
on May 15, 2020 by guest
http://jcm.asm.org/
2 mm of Cavit and resin (Z-250; 3M Dental Products, St. Paul, Minn.).
In order to determine the RTQ-PCR-measurable scale of bacterial reduction, we used both the SYBR green and the TaqMan formats (i.e., SYBR green PCR master mix and Taq-Man PCR master mix, respectively; Applied Biosystems). The PCR conditions used were different for both assays: (i) for the TaqMan format, denaturation at 94°C for 10 min and 40 cycles of 94°C for 1 min and annealing at 60°C for 1 min and 45 s; (ii) for the SYBR green format, denaturation at 94°C for 10 min and 40 cycles of 94°C for 1 min, annealing at 60°C for 1 min, and elongation at 72°C for 1 min and 30 s, followed by a final elongation at 72°C for 5 min. Melting curve analysis was formed to assess reaction specificity. RTQ-PCR was per-formed with the aid of an ABI-PRISM 7000 sequence detec-tion system (Applied Biosystems, Foster City, Calif.) by using optical-grade 96-well plates. Samples were run in duplicate in a total volume of 25l. Final reaction mixtures contained 100 nM of each primer and 2l of template DNA (approximately 50 ng of template DNA). Data acquisition and subsequent analysis were performed with ABI-PRISM 7000 SDS software (Applied Biosystems). DNA extracted from Prevotella
nigre-scensATCC 33563 was used to establish the standard curve,
based on a series of 10-fold dilutions. The bacterial load was quantified by determining the cycle threshold (CT), i.e., the number of PCR cycles required for the fluorescence to exceed a value significantly higher than the background fluorescence. We assumed a threshold value of 0.2, which was approximately 10 times the background fluorescence, defined as the mean fluorescence values of the first 6 to 15 PCR cycles. Since there is an inverse linear relationship between the logarithm of the initial bacterial DNA load and the correspondingCTvalue, the
change in theCTvalue (⌬CT) from before and after chemo-mechanical preparation of the root canal gives a first estimate of the bacterial reduction and, thus, of treatment efficacy. The mean ⌬CT determined by the SYBR green format in the
NaOCl treatment group was 9.70, whereas it was 8.91 by the TaqMan assay (Table 3). In contrast, the mean ⌬CT
deter-mined by the SYBR green format in the CHX gel treatment group was only 3.45, whereas it was 4.61 by TaqMan analysis. These values could indicate a better bacterial clearance in the NaOCl group. It is important that determination of the precise cell number of a multispecies bacterial population is compli-cated by the wide range of rRNA operon numbers among different bacterial taxa (range, 1 toⱖ10) (4, 17). The numbers (bacterial loads) calculated here are therefore referred to as “rRNA gene copy numbers,” since the ratio between rRNA genes and cells is unknown. The individual bacterial load dif-fered considerably among samples, ranging from 3.2⫻103to
1.2 ⫻ 108 rRNA gene copy numbers before treatment and
from “negative” to 9.6⫻106rRNA gene copy numbers after
endodontic treatment (Table 4). In the CHX gel treatment group, the SYBR green- and the TaqMan-based detection formats led, with a few exceptions (samples C6 and C7), to similar results, which is in accordance with previous findings (14). In the NaOCl treatment group, however, we observed a posttreatment trend toward lower gene copy numbers when we used the SYBR green format. This might largely be due to the SYBR green-specific effect on impairment of PCR efficiency (19), which becomes more relevant with low template
concen-trations. Irrespective of the individual bacterial load, the anti-microbial reduction within treatment groups was largely con-sistent in both the SYBR green and the TaqMan analyses. While the microbial reduction in the NaOCl treatment group was in most cases greater than 99% (for the SYBR green format, mean of 99.64% and median of 99.99%; for the Taq-Man format, mean of 94.23% and median of 99.63%), we observed a much lower microbial reduction in the CHX gel treatment group (for the SYBR green format, mean of 82.91% and median of 96.62%; for the TaqMan format, mean of 86.62% and median of 96.60%). This difference between the two treatment groups was statistically significant by the non-parametric Mann-Whitney test (P ⬍ 0.01). We also deter-mined the bacterial load by parallel plate counting. In the initial samples, the numbers of CFU ranged from 4⫻102to 1
⫻106, with a median of 3.2⫻105CFU. In contrast, the CFU
counts in the posttreatment samples declined drastically to a median of 0 (range, from 0 to 6.8⫻102CFU). While a direct
comparison between the cell numbers retrieved by counting the numbers of CFU and the gene copy numbers determined by RTQ-PCR is not possible, the scale of microbial reduction can be compared since it is proportional to the initial values measured. The bacterial reduction determined by parallel cell counting was similar in both treatment groups (for the CHX gel group, mean of 99.6% and median of 99.9%; for the NaOCl group, mean of 99.9% and median of 100%).
Thus, the difference between the treatment groups was much more pronounced when the reduction was measured by RTQ-PCR. This assay detects not only noncultivable species but also, to a certain extent, dead cell debris, a risk factor for a successful clinical outcome (16). The most broad-range RTQ-PCR might therefore be a valuable, complementary tool for the monitoring of anti-infective therapies.
In conclusion, assessment of the total bacterial load in a sample by universal PCR will certainly have an increasing impact on future microbiology, and important formats will be RTQ-PCR and PCR-based microarrays for diagnostic pur-poses (30). We have shown that the universal PCR assays published previously might potentially detect only a small to medium proportion of the bacterial 16S rRNA gene sequences included in ARB. Therefore, every user of a PCR protocol should first ensure its relevance for its intended application by retesting the probes and primers for covering the most impor-tant or dominant species in a particular sample. Even then, the results should be interpreted carefully, since the problem of finding a true universal PCR assay that reliably and invariably detects all bacterial species present in complex samples re-mains unresolved.
This work was supported by the CAPES (BEX 3410/04-8), FAPESP (02/13980-9), and the START program of the Faculty of Medicine, RWTH Aachen, Germany.
We thank Ilse Seyfarth, Vreni Merriam, and Diane M. Citron for various forms of assistance.
REFERENCES
1.Bystrom, A., and G. Sundqvist.1981. Bacteriologic evaluation of the efficacy of mechanical root canal instrumentation in endodontic therapy. Scand. J.
Dent. Res.89:321–328.
2.Corless, C. E., M. Guiver, R. Borrow, V. Edwards-Jones, E. B. Kaczmarski, and A. J. Fox.2000. Contamination and sensitivity issues with a real-time
universal 16S rRNA PCR. J. Clin. Microbiol.38:1747–1752.
3.Derakshani, M., T. Lukow, and W. Liesack.2001. Novel bacterial lineages at
on May 15, 2020 by guest
http://jcm.asm.org/
the (sub)division level as detected by signature nucleotide-targeted recovery of 16S rRNA genes from bulk soil and rice roots of flooded rice microcosms.
Appl. Environ. Microbiol.67:623–631.
4.Farrelly, V., F. A. Rainey, and E. Stackebrandt.1995. Effect of genome size
andrrngene copy number on PCR amplification of 16S rRNA genes from a
mixture of bacterial species. Appl. Environ. Microbiol.61:2798–2801.
5.Gomes, B. P., E. T. Pinheiro, C. R. Gade-Neto, E. L. Sousa, C. C. Ferraz, A. A. Zaia, F. B. Teixeira, and F. J. Souza-Filho. 2004. Microbiological
examination of infected dental root canals. Oral Microbiol. Immunol.19:
71–76.
6.Jacinto, R. C., B. P. Gomes, C. C. Ferraz, A. A. Zaia, and F. J. Filho.2003. Microbiological analysis of infected root canals from symptomatic and asymptomatic teeth with periapical periodontitis and the antimicrobial sus-ceptibility of some isolated anaerobic bacteria. Oral Microbiol. Immunol.
18:285–292.
7.Kakehashi, S., H. R. Stanley, and R. J. Fitzgerald.1965. The effects of surgical exposures of dental pulps in germ-free and conventional laboratory
rats. Oral Surg. Oral Med. Oral Pathol.20:340–349.
8.Khan, A. A., M. S. Nawaz, L. Robertson, S. A. Khan, and C. E. Cerniglia. 2001. Identification of predominant human and animal anaerobic intestinal bacterial species by terminal restriction fragment patterns (TRFPs): a rapid,
PCR-based method. Mol. Cell. Probes15:349–355.
9.Klaschik, S., L. E. Lehmann, A. Raadts, M. Book, A. Hoeft, and F. Stuber. 2002. Real-time PCR for detection and differentiation of gram-positive and
gram-negative bacteria. J. Clin. Microbiol.40:4304–4307.
10.Kroes, I., P. W. Lepp, and D. A. Relman.1999. Bacterial diversity within the
human subgingival crevice. Proc. Natl. Acad. Sci. USA96:14547–14552.
11.Kuboniwa, M., A. Amano, K. R. Kimura, S. Sekine, S. Kato, Y. Yamamoto, N. Okahashi, T. Iida, and S. Shizukuishi.2004. Quantitative detection of periodontal pathogens using real-time polymerase chain reaction with
Taq-Man probes. Oral Microbiol. Immunol.19:168–176.
12.Labrenz, M., I. Brettar, R. Christen, S. Flavier, J. Botel, and M. G. Hofle. 2004. Development and application of a real-time PCR approach for quan-tification of uncultured bacteria in the central Baltic Sea. Appl. Environ.
Microbiol.70:4971–4979.
13.Ludwig, W., O. Strunk, R. Westram, L. Richter, H. Meier, Yadhukumar, A. Buchner, T. Lai, S. Steppi, G. Jobb, W. Forster, I. Brettske, S. Gerber, A. W. Ginhart, O. Gross, S. Grumann, S. Hermann, R. Jost, A. Konig, T. Liss, R. Lussmann, M. May, B. Nonhoff, B. Reichel, R. Strehlow, A. Stamatakis, N. Stuckmann, A. Vilbig, M. Lenke, T. Ludwig, A. Bode, and K. H. Schleifer. 2004. ARB: a software environment for sequence data. Nucleic Acids Res.
32:1363–1371.
14.Maeda, H., C. Fujimoto, Y. Haruki, T. Maeda, S. Kokeguchi, M. Petelin, H. Arai, I. Tanimoto, F. Nishimura, and S. Takashiba.2003. Quantitative
real-time PCR using TaqMan and SYBR green forActinobacillus
actinomy-cetemcomitans,Porphyromonas gingivalis,Prevotella intermedia, tetQ gene
and total bacteria. FEMS Immunol. Med. Microbiol.39:81–86.
15.Martin, F. E., M. A. Nadkarni, N. A. Jacques, and N. Hunter.2002. Quan-titative microbiological study of human carious dentine by culture and real-time PCR: association of anaerobes with histopathological changes in
chronic pulpitis. J. Clin. Microbiol.40:1698–1704.
16.Martin, H.1991. Cleanliness, disinfection, and sterilization of the root canal.
Curr. Opin. Dent.1:734–736.
17.Nadkarni, M. A., F. E. Martin, N. A. Jacques, and N. Hunter.2002.
Deter-mination of bacterial load by real-time PCR using a broad-range (universal)
probe and primers set. Microbiology148:257–266.
18.Nair, P. N., U. Sjogren, G. Krey, K. E. Kahnberg, and G. Sundqvist.1990. Intraradicular bacteria and fungi in root-filled, asymptomatic human teeth with therapy-resistant periapical lesions: a long-term light and electron
mi-croscopic follow-up study. J. Endodont.16:580–588.
19.Nath, K., J. W. Sarosy, J. Hahn, and C. J. Di Como.2000. Effects of ethidium bromide and SYBR green I on different polymerase chain reaction systems.
J. Biochem. Biophys. Methods42:15–29.
20.Paster, B. J., F. E. Dewhirst, W. G. Weisburg, L. A. Tordoff, G. J. Fraser, R. B. Hespell, T. B. Stanton, L. Zablen, L. Mandelco, and C. R. Woese.1991.
Phylogenetic analysis of the spirochetes. J. Bacteriol.173:6101–6109.
21.Rolph, H. J., A. Lennon, M. P. Riggio, W. P. Saunders, D. MacKenzie, L. Coldero, and J. Bagg.2001. Molecular identification of microorganisms from
endodontic infections. J. Clin. Microbiol.39:3282–3289.
22.Siqueira, J. F., Jr.2003. Taxonomic changes of bacteria associated with
endodontic infections. J. Endodont.29:619–623.
23.Siqueira, J. F., I. N. Rocas, and A. S. Rosado.2004. Investigation of bacterial communities associated with asymptomatic and symptomatic endodontic infections by denaturing gradient gel electrophoresis fingerprinting
ap-proach. Oral Microbiol. Immunol.19:363–370.
24.Sjogren, U., B. Hagglund, G. Sundqvist, and K. Wing.1990. Factors affecting
the long-term results of endodontic treatment. J. Endodont.16:498–504.
25.Suzuki, M. T., and S. J. Giovannoni.1996. Bias caused by template annealing in the amplification of mixtures of 16S rRNA genes by PCR. Appl. Environ.
Microbiol.62:625–630.
26.Takai, K., and K. Horikoshi.2000. Rapid detection and quantification of members of the archaeal community by quantitative PCR using fluorogenic
probes. Appl. Environ. Microbiol.66:5066–5072.
27.Tseng, C. P., J. C. Cheng, C. C. Tseng, C. Wang, Y. L. Chen, D. T. Chiu, H. C. Liao, and S. S. Chang.2003. Broad-range ribosomal RNA real-time PCR after removal of DNA from reagents: melting profiles for clinically important
bacteria. Clin. Chem.49:306–309.
28.Vergin, K. L., E. Urbach, J. L. Stein, E. F. DeLong, B. D. Lanoil, and S. J. Giovannoni.1998. Screening of a fosmid library of marine environmental genomic DNA fragments reveals four clones related to members of the order
Planctomycetales. Appl. Environ. Microbiol.64:3075–3078.
29.Vianna, M. E., B. P. F. A. Gomes, V. B. Berber, A. A. Zaia, C. C. R. Ferraz, and F. J. de Souza.2004. In vitro evaluation of the antimicrobial activity of chlorhexidine and sodium hypochlorite. Oral Surg. Oral Med. Oral Pathol.
Oral Radiol. Endodont.97:79–84.
30.Vianna, M. E., H. P. Horz, B. P. F. A. Gomes, and G. Conrads.2005. Microarrays complement culture methods for identification of bacteria in
endodontic infections. Oral Microbiol. Immunol.20:253–258.
31.von Wintzingerode, F., U. B. Gobel, and E. Stackebrandt.1997. Determina-tion of microbial diversity in environmental samples: pitfalls of PCR-based
rRNA analysis. FEMS Microbiol. Rev.21:213–229.
32.Weisburg, W. G., S. M. Barns, D. A. Pelletier, and D. J. Lane.1991. 16S
ribosomal DNA amplification for phylogenetic study. J. Bacteriol.173:697–
703.
33.Yang, S., S. Lin, G. D. Kelen, T. C. Quinn, J. D. Dick, C. A. Gaydos, and R. E. Rothman.2002. Quantitative multiprobe PCR assay for simultaneous detec-tion and identificadetec-tion to species level of bacterial pathogens. J. Clin.
Mi-crobiol.40:3449–3454.