JOURNAL OFCLINICALMICROBIOLOGY, Mar. 2003, p. 1135–1142 Vol. 41, No. 3
0095-1137/03/$08.00⫹0 DOI: 10.1128/JCM.41.3.1135–1142.2003
Copyright © 2003, American Society for Microbiology. All Rights Reserved.
Two-Center Collaborative Evaluation of the Performance of the BD
Phoenix Automated Microbiology System for Identification and
Antimicrobial Susceptibility Testing of
Enterococcus
spp.
and
Staphylococcus
spp.
Anne-Marie Fahr,
1* Ulrich Eigner,
1Martina Armbrust,
1Alexandra Caganic,
1Giuseppe Dettori,
2Carlo Chezzi,
2Luca Bertoncini,
2Magda Benecchi,
2and Maria Grazia Menozzi
2Department of Microbiology, Laboratory Group Heidelberg, D-69126 Heidelberg, Germany,1and Section of Microbiology,
Department of Pathology and Laboratory Medicine, University of Parma, I-43100 Parma, Italy2
Received 9 August 2002/Returned for modification 8 October 2002/Accepted 15 December 2002
The performance of the BD Phoenix Automated Microbiology System (BD Diagnostic Systems, Sparks, Md.) was assessed for identification (ID) and antimicrobial susceptibility testing (AST) for the majority of clinically encountered bacterial isolates in a European collaborative two-center trial. A total of 469 bacterial isolates of the generaStaphylococcus(275 isolates),Enterococcus(179 isolates), andStreptococcus(15 isolates, for ID only) were investigated; of these, 367 were single patient isolates, and 102 were challenge strains tested at one center. Sixty-four antimicrobial drugs were tested, including the following drug classes: aminoglycosides, beta-lactam antibiotics, beta-lactam–beta-lactamase inhibitors, carbapenems, cephems, folate antagonists, quinolones, glycopeptides, macrolides-lincosamides-streptogramin B (MLS), and others. Phoenix ID results were com-pared to those of the laboratories’ routine ID systems (API 32 Staph, API 32 Strep, and VITEK 2 [bioMe´rieux, Marcy l’Etoile, France]); Phoenix AST results were compared to those of frozen standard broth microdilution (SBM) panels according to NCCLS guidelines (NCCLS document M 100-S 9, approved standard M 7-A 4). Discrepant results were repeated in duplicate. Concordant IDs of 97.1, 98.9, and 100% were observed for staphylococci, enterococci, and streptococci, respectively. For AST results the overall essential agreement was 93.3%; the category agreement was 97.3%; and the very major error rate, major error rate, and minor error rate were 1.2, 1.9, and 1.3%, respectively. In conclusion, the Phoenix ID results showed high agreement with results of the systems to which they were being compared; the AST performance was highly equivalent to that of the SBM reference method.
The clinical microbiology laboratory is confronted with an alarming increase of antimicrobial resistance on a global scale (7, 8, 9, 13). Furthermore, the emergence of bacterial isolates with special resistance mechanisms such as oxacillin-resistant staphylococci or vancomycin-resistant enterococci constitutes a major problem, especially in intensive care units (1, 4). Both accurate and rapid diagnosis of oxacillin-resistant staphylo-cocci and vancomycin-resistant enterostaphylo-cocci has therefore be-come essential in the current health care environment.
The BD Phoenix Automated Microbiology System (BD Di-agnostic Systems, Sparks, Md. [BD]) is a newly developed instrument for the reliable and accurate identification and sus-ceptibility testing for the majority of clinically encountered strains. The system is comprised of disposable panels, which combine both identification testing (ID) and antimicrobial sus-ceptibility testing (AST), and an instrument which performs automatic reading at 20-min intervals during incubation. The system claims to provide accurate and rapid susceptibility re-sults with easy workflow for the laboratory worker.
We report on the ability of the Phoenix system to accurately perform ID and AST of clinical and challenge isolates in a
large collaborative two-center trial involving the Section of Microbiology, University of Parma, Parma, Italy, and the Lab-oratory Group Heidelberg, Heidelberg, Germany. In this study, gram-positive bacteria were evaluated in a comparison of the system to routine laboratory methods for ID and to a standard broth microdilution (SBM) procedure for AST ac-cording to NCCLS guidelines (14).
(These findings were partly presented at the 11th Eur. Cong. Clin. Microbiol. Infect. Dis. 2001, abstr. P 1522, 2001, and the 12th Eur. Cong. Clin. Microbiol. Infect. Dis. 2002, abstr. P 1047, 2002.)
MATERIALS AND METHODS
Proficiency.Each technician was required to simultaneously set up 20 strains (provided by the manufacturer) in both the Phoenix system and the reference AST system. Proficiency testing was successful if a correct result was obtained in 90% or more of single tests performed.
Reproducibility.This phase of the study was performed at one center (Parma). Fifteen strains (including the NCCLS-recommended quality control [QC] strains) provided by the manufacturer were set up on three different days in triplicate in the Phoenix system only. Results were evaluated to determine variability of repeat AST testing. The MIC results for each strain-antimicrobial agent combination were used to determine a modal MIC result, and the fre-quency of MICs within plus or minus one dilution of this mode was determined and used as an expression of reproducibility.
Bacterial isolates.A total of 469 bacterial isolates of the generaStaphylococcus (275 isolates),Enterococcus(179 isolates), andStreptococcus(15 isolates, evalu-ated for identification only) were investigevalu-ated. The following species were in-cluded:Staphylococcus aureus(114 isolates),Staphylococcus epidermidis(90 iso-* Corresponding author. Mailing address: Department of
Microbi-ology, Laboratory Group Heidelberg, D-69126 Heidelberg, Germany. Phone: 49 6221 3432 125. Fax: 49 6221 3432 263. E-mail: A.Fahr@docnet .de.
1135
on May 15, 2020 by guest
http://jcm.asm.org/
lates), Staphylococcus haemolyticus (23 isolates), Staphylococcus capitis (9 isolates),Staphylococcus hominis (8 isolates),Staphylococcus saprophyticus(6 isolates),Staphylococcus warneri(6 isolates),Staphylococcus lugdunensis(5 iso-lates),Staphylococcus simulans(4 isolates),Staphylococcus cohnii(4 isolates), other coagulase-negative staphylococci (CoNS) (6 isolates),Enterococcus faecalis (113 isolates),Enterococcus faecium(50 isolates),Enterococcus gallinarum(7 isolates),Enterococcus casseliflavus(5 isolates), otherEnterococcusspp. (4 iso-lates),Streptococcus agalactiae(15 isolates). Of these strains, 367 were single patient isolates (200 from Heidelberg and 167 from Parma) and 102 were chal-lenge strains supplied by the manufacturer to one of the sites (Heidelberg). The challenge set included strains from various sources, including the Centers for Disease Control and Prevention, French National Reference Center (Societe´ Franc¸aise de Microbiologie [SFM]), and BD internal collection with well-defined resistance mechanisms.
Phoenix ID.The Phoenix system used one ID and AST combination panel (CT04P), with the identification substrates on one side and antimicrobial drugs on the other side of the panel. The ID side of the panel for gram-positive bacteria contained a total of 45 dried substrates, including 20 fluorogenic substrates, 8 fermentation substrates, 8 carbon source substrates, 5 chromogenic substrates, esculin, urea, and two fluorescent controls. Isolates were subcultured twice onto Trypticase Soy Agar supplemented with 5% sheep blood (TSA II, BD Diagnostic Systems) to ensure viability and purity. The Phoenix ID broth was inoculated with bacterial colonies from a pure culture adjusted to a 0.5 to 0.6 McFarland standard using a CrystalSpec Nephelometer (BD Diagnostic Systems). After having transferred 25l of the ID suspension to the Phoenix AST broth, the suspension was poured into the ID side of the Phoenix panel. Once inoculated the panel was logged and loaded into the instrument, where kinetic measure-ments of colorimetric and fluorescent signals were collected every 20 min.
Reference ID.The laboratory’s routine ID system was set up from the same agar pure culture. In Heidelberg staphylococci were identified with the API 32 Staph system (bioMe´rieux, Marcy l’Etoile, France) and enterococci were iden-tified with the API 32 Strep system (bioMe´rieux). At the University of Parma staphylococci and enterococci were investigated using the VITEK 2 system (bioMe´rieux).
Additionally, for staphylococci the clumping factor (Staphyslide; bioMe´rieux) and the coagulase test (rabbit plasma; bioMe´rieux) were used. For enterococci, the esculin reaction and, if necessary, the motility test were performed.
Antimicrobials.In total, 64 drugs were tested including the following drug classes (number of drugs): aminoglycosides (7), lactam antibiotics (6), beta-lactam–beta-lactamase inhibitors (4), carbapenems (2), cephems (17), folate antagonists (3), quinolones (10), glycopeptides (2), macrolides-lincosamides-streptogramin B (MLS) (7), and others (6). NCCLS breakpoints were utilized for most antimicrobial agents, but breakpoints from the Comite´ de l’Antibiogramme de la SFM (5) were used for four antibiotics (pristinamycin, pefloxacin, fusidic acid, and lincomycin) for which there are no NCCLS breakpoints. Additionally, breakpoints of the Deutsches Institut fu¨r Normung (DIN) (6) were used for trimethoprim-sulfamethoxazole utilizing the DIN recommended concentration range, and moxifloxacin was evaluated using breakpoints recommended by the pharmaceutical manufacturer (Bayer, Leverkusen, Germany, personal commu-nication).
Phoenix AST.The Phoenix AST broth was supplemented by one drop of Phoenix AST indicator (oxidation-reduction indicator based on resazurin). From the standardized ID suspension 25l was transferred to the AST broth, resulting in a final inoculum density of approximately 5⫻105CFU/ml. The broth was
poured into the fill port on the AST side of the Phoenix panel. Following filling, the panels were sealed with a closure and together with three additional similarly inoculated AST-only panels (CT02P, CT03P, and CT11P) were logged and loaded into the Phoenix instrument. For each antibiotic a minimum of eight concentrations (doubling dilutions) were tested with the Phoenix system. The Phoenix panels contained a staphylococcal penicillinase test including a nitroce-fin-based well on the ID side plus a growth based test for penicillinase production on the AST side. The two results were integrated into a single beta-lactamase test result. That is, if the beta-lactamase test was positive, the interpretation for penicillinase-susceptible penicillins (PNSP) was automatically set to resistant. The Phoenix penicillinase test was compared in this study to the cefinase test (BD Diagnostic Systems).
Reference AST.The reference method frozen SBM panels (five panels) con-tained the same antimicrobial agents in doubling dilutions as the Phoenix panels. The reference panels were prepared and tested according to NCCLS standards (14). The reference panel contained tests for high-level resistance to aminogly-cosides (HLAR), including both gentamicin and streptomycin. Additionally, the following supplemental tests were performed: cefinase test without induction by oxacillin, catalase test, oxacillin screen agar (Oxascreen; BD Diagnostic
Sys-tems), anEnterococcus QUAD plate containing 6g of vancomycin, as well as gentamicin- and streptomycin-HLAR tests (BD Diagnostic Systems). The refer-ence method for oxacillin was the SBM method for all staphylococci other than S. aureus, and SBM combined with the oxacillin screen agar was the reference method forS. aureus. When the oxacillin result was susceptible and the Oxa-screen result was positive, the reference oxacillin result was resistant.
QC.For QC, 16 ATCC strains were tested for each run, resulting in a total of 29 Phoenix and 41 reference panels:E. faecalisATCC 29212,S. aureusATCC 29213,S. aureusATCC 25923,E. faecalisATCC 14506,E. faecalisATCC 49533, E. faecalisATCC 10741,E. faeciumSCPOS 4295,E. faecalisATCC 51299,S. aureusATCC 43300,S. epidermidisATCC 35547,S. saprophyticusATCC 35552, Staphylococcus sciuriATCC 29062, E. faeciumATCC 49032, Escherichia coli ATCC 25922,Pseudomonas aeruginosaATCC 27853,E. coliATCC 35218. For the reference system, results of QC strains had to be within the acceptable NCCLS limits, as defined by the U.S. Food and Drug Administration guidance document for AST devices (3, 14).
Molecular tests.For oxacillin-resistant staphylococci, a PCR-basedmecAgene method was performed. The primers designed in our Laboratory Group were Mec3s (5⬘-ACA TCT ATT AGG TTA TGT TGG-3⬘) and Mec3as (5⬘-TAT ATT CTT CGT TAC TCA TGC-3⬘), which produced a PCR product of 492 bp. For the PCR analysis of enterococcalvanA,vanB, andvanCgene clusters, primers described by Patel et al. were used; for detection, gel electrophoresis was per-formed without prior restriction enzyme digestion (15). Molecular methods were evaluated and discussed separately from the primary comparison of Phoenix to reference method.
Data analysis and management.The Phoenix and the reference data were entered into a Microsoft SQL Server (version 7.0) database (Microsoft Corpo-ration, Redmond, Wash.). Applying NCCLS, SFM, DIN, or pharmaceutical company breakpoints and associated rule recommendations, sensitive, interme-diate, and resistant (SIR) interpretations were determined electronically in the database for both the reference data and the Phoenix data, ensuring that the same rules were applied for each data set (9, 13). The Phoenix ID was used in the interpretation of all AST results obtained by both the Phoenix system and the SBM method for each respective isolate.
All AST accuracy reports were generated using SAS software (version 8.0; SAS Institute, Cary, N.C.). For each drug the following measures of accuracy were used: essential agreement (EA), or MICs between systems being within plus or minus one doubling dilution, and category agreement (CA), or SIR interpre-tative results matching between the two systems. Errors were classified as very major error (VME), or false susceptible Phoenix result; major error (ME), or false resistant Phoenix result; and minor error (mE), i.e., one system reporting an intermediate result and the other reporting a susceptible or resistant result. In calculating the error rates the following denominators have been used: the number of reference resistant isolates for VME rate, the number of reference susceptible isolates for ME rate, and the total number of tests for mE rate.
Discrepancy resolution.Isolates for which there were ID discrepancies, VME, and ME were subjected to repeat testing in duplicate in both the Phoenix system and the reference methods, giving three results in total. A majority rule deter-mined the final resolved outcome. For remaining ID discrepancies both com-parator methods (API 32 Staph, API 32 Strep, VITEK 2 [bioMe´rieux]) were set up.
RESULTS
Proficiency. All laboratory personnel of both centers in-volved in this study passed the proficiency phase.
Reproducibility.On a total of 1,314 single tests, reproduc-ibility testing within the expected modal MIC range showed correct results in 95.9% of cases. Reproducibility within the SIR categories showed correct results in 99.2% of cases.
ID.Out of 469 strains tested, a concordant ID to the species
level was obtained in 97.9% of cases. Staphylococci, entero-cocci, and streptococci showed a concordant result in 97.1, 98.9, and 100% of cases, respectively; 10 strains, 6 clinical and 4 challenge isolates, showed an ID discordant with that of the respective comparator method (Table 1). For one challenge strain (S. hominis) the VITEK 2 comparator system also gave a discordant result, as did the Phoenix instrument (S. haemo-lyticus).
on May 15, 2020 by guest
http://jcm.asm.org/
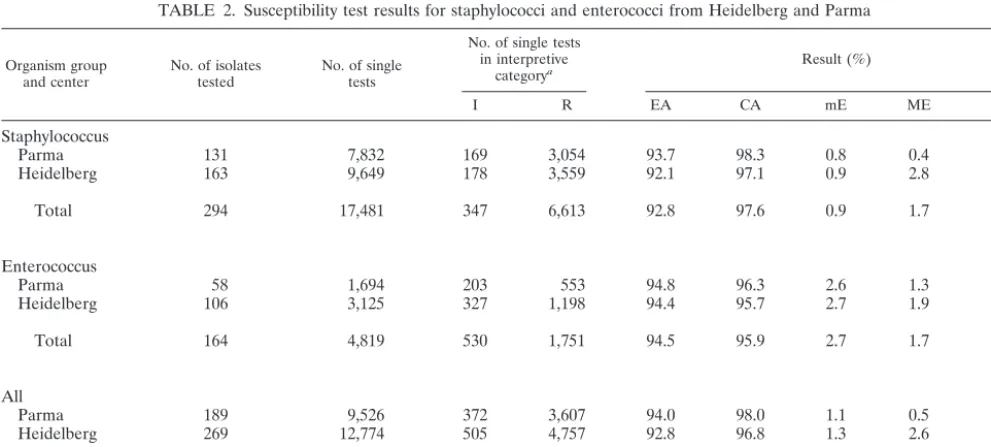
Overall AST results. The total percentage of QC failures based on QC runs and single drug failures was 0.6%. A total of 22,300 single AST results were evaluated for staphylococci (17,481 results) and enterococci (4,819 results). The evaluation included 13,869 clinical and 3,612 challenge single test results for staphylococci and 3,851 clinical and 968 challenge single test results for enterococci. The AST results of all drug classes combined for Heidelberg and Parma are shown in Table 2. The overall EA was 93.3%, the CA was 97.3%, the VME rate was 1.2%, the ME rate was 1.7%, and finally, the mE rate was 1.3%. For staphylococci and enterococci the EA were 92.8 and 94.5%, the CA were 97.6 and 95.9%, the VME rates were 1.2 and 1.4%, the ME rates were 1.7 and 1.7%, and the mE rates were 0.9 and 2.7%, respectively.
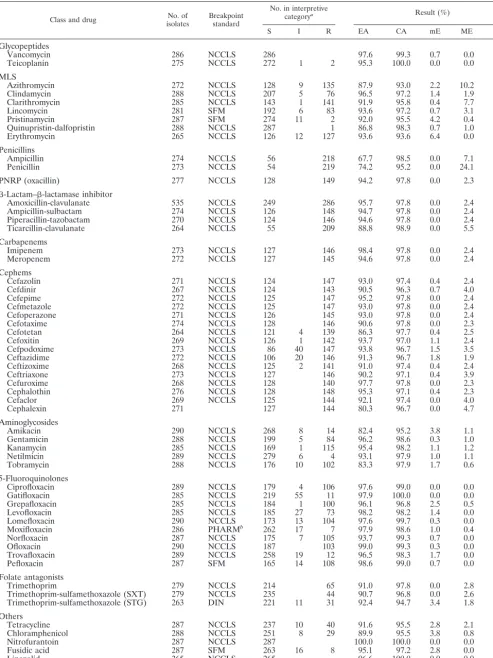
Staphylococcus AST results.Table 3 shows the combined staphylococcus results of the individual drugs for both centers. Excluded from this table are the drugs for which there are no NCCLS, DIN, or SFM breakpoints available (5, 6, 14).
For penicillin and ampicillin the results for EA were below 90%, but CA results were greater than 95%. For penicillin the
ME rate was 24.1% and no VME was found. The high ME rate did not significantly affect the CA, because the frequency of susceptible strains was low compared to that of resistant strains. The absence of VME was also found for ampicillin while the ME rate was 7.1%.
The representative antibiotic for penicillinase-resistant pen-icillins (PNRP) in Phoenix is oxacillin. The EA for this drug
was 94.2%, and the CA was 97.8%. Out of 116 S. aureus
isolates tested, 54 were positive for themecAgene. They were
also oxacillin resistant according to the Phoenix system and the SBM method. Out of 161 CoNS tested, 155 strains gave the same results by all methods. For six CoNS isolates we found discrepant results; three CoNS were resistant according to the Phoenix system and the SBM method but did not express the
mecA gene. For three strains VMEs were reported but the
trains also lacked themecAgene.
[image:3.603.41.549.81.200.2]The glycopeptide antibiotics showed an EA of 96.4% and a CA of 99.6%; one intermediate and two resistant CoNS strains for teicoplanin were correctly determined by the Phoenix sys-tem. The MLS group showed an EA of 91.8% and a CA of
TABLE 1. Identification results for gram-positive cocci
Organism group isolatesNo. of tested
No. (%) of IDs
Phoenix ID n Comparator system ID
Concordant Discordant API Staph or API Strep VITEK 2
Staphylococcus 275 267 (97.1) 8 (2.9) Staphylococcus caprae-S. warneria 3 S. cohnii S. cohnii
S. hominis-S. capitis 2 S. epidermidis S. epidermidis S. haemolyticus 1 S. hominis S. haemolyticus S. cohnii 1 S. saprophyticus S. saprophyticus S. gallinarum 1 Staphylococcus xylosus Staphylococcus xylosus Enterococcus 179 177 (98.9) 2 (1.1) E. casseliflavus-E. gallinarum 2 E. faecalis E. faecalis
Streptococcus 15 15 (100)
Total 469 459 (97.9) 10 (2.1)
aForS. caprae-S. warneri,n⫽1; forS. warneri,n⫽2.
TABLE 2. Susceptibility test results for staphylococci and enterococci from Heidelberg and Parma
Organism group
and center No. of isolatestested No. of singletests
No. of single tests in interpretive
categorya Result (%)
I R EA CA mE ME VME
Staphylococcus
Parma 131 7,832 169 3,054 93.7 98.3 0.8 0.4 1.7
Heidelberg 163 9,649 178 3,559 92.1 97.1 0.9 2.8 0.8
Total 294 17,481 347 6,613 92.8 97.6 0.9 1.7 1.2
Enterococcus
Parma 58 1,694 203 553 94.8 96.3 2.6 1.3 1.1
Heidelberg 106 3,125 327 1,198 94.4 95.7 2.7 1.9 1.5
Total 164 4,819 530 1,751 94.5 95.9 2.7 1.7 1.4
All
Parma 189 9,526 372 3,607 94.0 98.0 1.1 0.5 1.6
Heidelberg 269 12,774 505 4,757 92.8 96.8 1.3 2.6 1.0
Total 458 22,300 877 8,364 93.3 97.3 1.3 1.7 1.2
aAbbreviations: I, intermediate; R, resistant.
VOL. 41, 2003 PERFORMANCE OF BD PHOENIX SYSTEM FOR AST 1137
on May 15, 2020 by guest
http://jcm.asm.org/
[image:3.603.44.540.494.717.2]Class and drug isolatesNo. of Breakpointstandard
No. in interpretive
categorya Result (%)
S I R EA CA mE ME VME
Glycopeptides
Vancomycin 286 NCCLS 286 97.6 99.3 0.7 0.0
Teicoplanin 275 NCCLS 272 1 2 95.3 100.0 0.0 0.0 0.0
MLS
Azithromycin 272 NCCLS 128 9 135 87.9 93.0 2.2 10.2 0.0
Clindamycin 288 NCCLS 207 5 76 96.5 97.2 1.4 1.9 0.0
Clarithromycin 285 NCCLS 143 1 141 91.9 95.8 0.4 7.7 0.0
Lincomycin 281 SFM 192 6 83 93.6 97.2 0.7 3.1 0.0
Pristinamycin 287 SFM 274 11 2 92.0 95.5 4.2 0.4 0.0
Quinupristin-dalfopristin 288 NCCLS 287 1 86.8 98.3 0.7 1.0 0.0
Erythromycin 265 NCCLS 126 12 127 93.6 93.6 6.4 0.0 0.0
Penicillins
Ampicillin 274 NCCLS 56 218 67.7 98.5 0.0 7.1 0.0
Penicillin 273 NCCLS 54 219 74.2 95.2 0.0 24.1 0.0
PNRP (oxacillin) 277 NCCLS 128 149 94.2 97.8 0.0 2.3 2.0
-Lactam–-lactamase inhibitor
Amoxicillin-clavulanate 535 NCCLS 249 286 95.7 97.8 0.0 2.4 2.1
Ampicillin-sulbactam 274 NCCLS 126 148 94.7 97.8 0.0 2.4 2.0
Piperacillin-tazobactam 270 NCCLS 124 146 94.6 97.8 0.0 2.4 2.1
Ticarcillin-clavulanate 264 NCCLS 55 209 88.8 98.9 0.0 5.5 0.0
Carbapenems
Imipenem 273 NCCLS 127 146 98.4 97.8 0.0 2.4 2.1
Meropenem 272 NCCLS 127 145 94.6 97.8 0.0 2.4 2.1
Cephems
Cefazolin 271 NCCLS 124 147 93.0 97.4 0.4 2.4 2.0
Cefdinir 267 NCCLS 124 143 90.5 96.3 0.7 4.0 2.1
Cefepime 272 NCCLS 125 147 95.2 97.8 0.0 2.4 2.0
Cefmetazole 272 NCCLS 125 147 93.0 97.8 0.0 2.4 2.0
Cefoperazone 271 NCCLS 126 145 93.0 97.8 0.0 2.4 2.1
Cefotaxime 274 NCCLS 128 146 90.6 97.8 0.0 2.3 2.1
Cefotetan 264 NCCLS 121 4 139 86.3 97.7 0.4 2.5 1.4
Cefoxitin 269 NCCLS 126 1 142 93.7 97.0 1.1 2.4 1.4
Cefpodoxime 273 NCCLS 86 40 147 93.8 96.7 1.5 3.5 1.4
Ceftazidime 272 NCCLS 106 20 146 91.3 96.7 1.8 1.9 1.4
Ceftizoxime 268 NCCLS 125 2 141 91.0 97.4 0.4 2.4 2.1
Ceftriaxone 273 NCCLS 127 146 90.2 97.1 0.4 3.9 1.4
Cefuroxime 268 NCCLS 128 140 97.7 97.8 0.0 2.3 2.1
Cephalothin 276 NCCLS 128 148 95.3 97.1 0.4 2.3 2.7
Cefaclor 269 NCCLS 125 144 92.1 97.4 0.0 4.0 1.4
Cephalexin 271 127 144 80.3 96.7 0.0 4.7 2.1
Aminoglycosides
Amikacin 290 NCCLS 268 8 14 82.4 95.2 3.8 1.1 0.0
Gentamicin 288 NCCLS 199 5 84 96.2 98.6 0.3 1.0 1.2
Kanamycin 285 NCCLS 169 1 115 95.4 98.2 1.1 1.2 0.0
Netilmicin 289 NCCLS 279 6 4 93.1 97.9 1.0 1.1 0.0
Tobramycin 288 NCCLS 176 10 102 83.3 97.9 1.7 0.6 0.0
5-Fluoroquinolones
Ciprofloxacin 289 NCCLS 179 4 106 97.6 99.0 0.0 0.0 2.8
Gatifloxacin 285 NCCLS 219 55 11 97.9 100.0 0.0 0.0 0.0
Grepafloxacin 285 NCCLS 184 1 100 96.1 96.8 2.5 0.5 1.0
Levofloxacin 285 NCCLS 185 27 73 98.2 98.2 1.4 0.0 1.4
Lomefloxacin 290 NCCLS 173 13 104 97.6 99.7 0.3 0.0 0.0
Moxifloxacin 286 PHARMb 262 17 7 97.9 98.6 1.0 0.4 0.0
Norfloxacin 287 NCCLS 175 7 105 93.7 99.3 0.7 0.0 0.0
Ofloxacin 290 NCCLS 187 103 99.0 99.3 0.3 0.0 1.0
Trovafloxacin 289 NCCLS 258 19 12 96.5 98.3 1.7 0.0 0.0
Pefloxacin 287 SFM 165 14 108 98.6 99.0 0.7 0.0 0.9
Folate antagonists
Trimethoprim 279 NCCLS 214 65 91.0 97.8 0.0 2.8 0.0
Trimethoprim-sulfamethoxazole (SXT) 279 NCCLS 235 44 90.7 96.8 0.0 2.6 6.8
Trimethoprim-sulfamethoxazole (STG) 263 DIN 221 11 31 92.4 94.7 3.4 1.8 3.2
Others
Tetracycline 287 NCCLS 237 10 40 91.6 95.5 2.8 2.1 0.0
Chloramphenicol 288 NCCLS 251 8 29 89.9 95.5 3.8 0.8 0.0
Nitrofurantoin 287 NCCLS 287 100.0 100.0 0.0 0.0 0.0
Fusidic acid 287 SFM 263 16 8 95.1 97.2 2.8 0.0 0.0
Linezolid 265 NCCLS 265 96.6 100.0 0.0 0.0 0.0
Rifampin 288 NCCLS 268 3 17 97.6 99.3 0.7 0.0 0.0
aAbbreviations: S, susceptible; I, intermediate; R, resistant. bPharmaceutical company.
1138
on May 15, 2020 by guest
http://jcm.asm.org/
[image:4.603.46.540.58.716.2]95.8%, and no VMEs were detected. The EA for linezolid was 96.6%, and all strains were susceptible by both methods.
For the beta-lactam–beta-lactamase inhibitor combinations only ticarcillin-clavulanate had an EA of 88.8%; the other four formulations showed values of 94.6 to 95.7%. For imipenem and meropenem the EAs were 98.4 and 94.6%, respectively. For the 17 cephems tested in this trial, the EAs ranged from 90.2 to 97.7%, except for cephalexin (80.3%) and cefotetan (86.3%). The three VMEs observed with each of these drugs resulted from the resistance mechanism to oxacillin.
Among the aminoglycosides only amikacin and tobramycin had an EA of 82.4 and of 83.3%, whereas all other drugs had values above 90%; all drugs of this class showed a CA of 95.2 to 98.6%, and only one VME was seen, with gentamicin. The results of the EA of the 5-fluoroquinolones showed a distribu-tion from 93.7 to 99.0%; the CA ranged from 96.8 to 100%, and the overall VME rate was 1.0%.
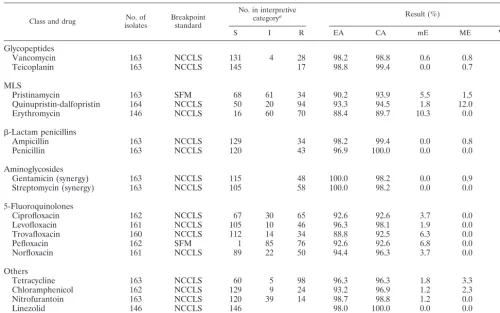
Enterococcus AST results.The results for enterococci are shown in Table 4. Excluded from this table are the drugs for which there are no NCCLS, DIN, or SFM breakpoints avail-able.
For the glycopeptides the EA was 98.5% and the CA was 99.1%, with a VME rate of 0% and an ME rate of 0.7%. All of
the 32 vancomycin-intermediate or -resistantE. faecalisandE.
faeciumisolates were detected by the Phoenix system, while
oneE. faeciumisolate gave a false resistant result. Ampicillin
and penicillin showed an EA of 98.2 and 96.9%, a CA of 99.4
and 100%, and a VME rate of 0 and 0%, respectively. The CA of the high-level resistance for gentamicin and streptomycin was 98.2%, with a VME rate of 4.7%. The five 5-fluoroquino-lones showed an EA of 93.0%, a CA of 94.4%, and a VME rate of 3.3%. The EA for linezolid was 98.0%; all strains were susceptible by both methods.
DISCUSSION
This two-center trial is focused on the performance of the Phoenix system with gram-positive strains. Prior to this report, only one such study had been published, by Brisse et al. (2), but numerous posters have been presented on the comparison between the Phoenix system and other reference and commer-cial ID and AST systems. We have compared the ID perfor-mance of the Phoenix to commercially available ID methods routinely used in our laboratories. In this evaluation only 10 out of 469 gram-positive strains tested showed an incorrect ID
result; eight were CoNS strains, and noS. aureusisolate was
misidentified. The discrepancies concerning two enterococcal isolates were resolved with the motility test. This finding was also reported with the VITEK 2 system by Garcia-Garrote et
al., where 10 out of 55E. faeciumisolates with low-level
resis-tance to vancomycin were identified as E. gallinarum-E.
cas-seliflavus and where the motility test also resolved these
[image:5.603.41.542.81.394.2]dis-crepancies (10). When testing more than 1,000 gram-positive isolates, Salomon et al. could demonstrate the discriminatory
TABLE 4. Susceptibility test results for enterococci
Class and drug isolatesNo. of Breakpointstandard
No. in interpretive
categorya Result (%)
S I R EA CA mE ME VME
Glycopeptides
Vancomycin 163 NCCLS 131 4 28 98.2 98.8 0.6 0.8 0.0
Teicoplanin 163 NCCLS 145 17 98.8 99.4 0.0 0.7 0.0
MLS
Pristinamycin 163 SFM 68 61 34 90.2 93.9 5.5 1.5 0.0
Quinupristin-dalfopristin 164 NCCLS 50 20 94 93.3 94.5 1.8 12.0 0.0
Erythromycin 146 NCCLS 16 60 70 88.4 89.7 10.3 0.0 0.0
-Lactam penicillins
Ampicillin 163 NCCLS 129 34 98.2 99.4 0.0 0.8 0.0
Penicillin 163 NCCLS 120 43 96.9 100.0 0.0 0.0 0.0
Aminoglycosides
Gentamicin (synergy) 163 NCCLS 115 48 100.0 98.2 0.0 0.9 4.2
Streptomycin (synergy) 163 NCCLS 105 58 100.0 98.2 0.0 0.0 5.2
5-Fluoroquinolones
Ciprofloxacin 162 NCCLS 67 30 65 92.6 92.6 3.7 0.0 9.2
Levofloxacin 161 NCCLS 105 10 46 96.3 98.1 1.9 0.0 0.0
Trovafloxacin 160 NCCLS 112 14 34 88.8 92.5 6.3 0.0 5.9
Pefloxacin 162 SFM 1 85 76 92.6 92.6 6.8 0.0 1.3
Norfloxacin 161 NCCLS 89 22 50 94.4 96.3 3.7 0.0 0.0
Others
Tetracycline 163 NCCLS 60 5 98 96.3 96.3 1.8 3.3 0.0
Chloramphenicol 162 NCCLS 129 9 24 93.2 96.9 1.2 2.3 0.0
Nitrofurantoin 163 NCCLS 120 39 14 98.7 98.8 1.2 0.0 0.0
Linezolid 146 NCCLS 146 98.0 100.0 0.0 0.0 0.0
Rifampin 163 NCCLS 56 40 67 68.1 76.1 13.5 30.4 0.0
aAbbreviations: S, susceptible; I, intermediate; R, resistant.
VOL. 41, 2003 PERFORMANCE OF BD PHOENIX SYSTEM FOR AST 1139
on May 15, 2020 by guest
http://jcm.asm.org/
power of the different substrate classes used in the Phoenix system (J. E. Salomon, T. Wiles, C. Yu, and T. Dunk, Abstr. 99th Gen. Meet. Am. Soc. Microbiol. 1999, abstr. C-448, 1999). This resulted in a list of approximately 100 gram-positive spe-cies (taxon list) which can be identified by the Phoenix system. Our testing included only a small proportion of this taxon list; however, this challenge represented the most frequently en-countered species in a routine clinical laboratory. Marco et al. investigated 136 gram-positive cocci with the Phoenix instru-ment and the MicroScan Walk-Away-40 (Dade-MicroScan, W. Sacramento, Calif.) and reported a concordance with this MicroScan system of 98.5% including arbitration (F. Marco, A. Jurado, and M. T. Jimenez de Anta, Abstr. 12th Eur. Cong. Clin. Microbiol. Infect. Dis. 2002, abstr. P 711, 2002). When comparing the performance of the Phoenix instrument with the VITEK 2 system Gross et al. investigated 400 staphylococcal
strains and 121Enterococcusspp. (R. Gross, U. Ho¨rling, and
G. Peters, Abstr. 12th Eur. Cong. Clin. Microbiol. Infect. Dis. 2002, abstr. P 703, 2002). Out of 520 gram-positive strains tested, 498 gave similar ID results in both systems. Most of the discrepant results occurred with CoNS.
We have compared the AST performance of the Phoenix system to the broth microdilution reference method with a broad range of antimicrobial agents. The PNSP class of anti-biotics is one of the clinically important drug classes for en-terococci which to a lesser extent is also true for staphylococci. For enterococci the results of EA, CA, VME, ME, and mE for all PNSP were very good. For ampicillin, which is generally considered to be an indicator antibiotic for enterococci, there were zero VME out of 32 resistant strains. This has also been confirmed by other groups (T. Wiles, W. Brasso, D. Turner, D. Holliday, and K. Fischbein, Abstr. 9th Eur. Cong. Clin. Micro-biol. Infect. Dis. 1999, abstr. P 1156, 1999; F. Marco, A. Jurado, and M. T. Jimenez de Anta, Abstr. 12th Eur. Cong. Clin. Microbiol. Infect. Dis. 2002, abstr. P 712, 2002; R. Gross, U. Hoerling, and G. Peters, Abstr. 12th Eur. Cong. Clin. Micro-biol. Infect. Dis. 2002, abstr. P 704, 2002).
For staphylococci we observed a low EA for penicillin (74.2%) and ampicillin (67.7%), while the CA was 95.2 and 98.5%, respectively. The integration of the penicillinase test into the interpretation of the penicillin MIC resulted in the high CA by virtually eliminating false susceptible results. This was also found by Wiles et al., who found the EAs to be 85% (penicillin) and 86% (ampicillin) (Wiles et al., 9th ECCMID) but found high CAs of 99 and 97%, respectively. Marco et al. also reported a Phoenix CA of 93.7% in comparison to the MicroScan system result for penicillin, and Gross et al. found a 99.1% Phoenix CA in comparison to the VITEK 2 system (Marco et al., 12th ECCMID, abstr. P 712; Gross et al., 12th ECCMID, abstr. P 704). In this study we observed no VME for any PNSP but an ME rate with penicillin of 24.1%. Yu et al. investigated 95 staphylococcal isolates for beta-lactamase ac-tivity, comparing the Phoenix system with the Cefinase Plus disk (BD Diagnostic Systems), which is reported to be more sensitive than the cefinase test which we used in our protocol (C. Yu, D. Turner, G. Karr, J. Sinha, and S. Wulff, Abstr. 9th Eur. Cong. Clin. Microbiol. Infect. Dis. 1999, abstr. P 38, 1999). This study did not use the above product because it had been discontinued by BD prior to our study. They also tested for beta-lactamase production following induction with
oxacil-lin and reported that 13 of these strains were determined to be sensitive to penicillin using the SBM, where these were positive by the Cefinase Plus disk procedure and thus should be resis-tant to all PNSP. It is possible that some of the Phoenix MEs which we observed are truly cases of PNSP resistance in which the reference cefinase did not detect beta-lactamase due to the fact that this study used the less-sensitive indicator and did not involve testing with induction.
Arguably the most significant AST test for staphylococcus is with the PNRP, which in the case of Phoenix is represented by oxacillin. This test is crucial because it identifies the critical resistance mechanism of methicillin-resistant staphylococcus (MRS), which is related to the acquisition of a modified PBP
2a encoded by themecAgene. The presence of this resistance
mechanism renders or implies resistance to all current beta-lactam antibiotics (according to NCCLS, SFM, and DIN breakpoints). However, many of these other beta-lactam anti-biotics test in vitro as susceptible. Thus, the test of one PNRP influences the results for many antibiotics. The performance of the Phoenix system with oxacillin was an area of great interest in our study. We observed very good performance with only three VMEs out of 149 MRS strains tested. These VMEs occurred with CoNS only in cases where definition of MIC breakpoints is currently controversial and changing. The over-all EA and CA were excellent, at 94.2 and 97.8%, respectively. Similar performance was observed by other groups (C. Yu, W. Brasso, D. Holliday, B. Turng, and J. Sinha, Abstr. 9th Eur. Cong. Clin. Microbiol. Infect. Dis. 1999, abstr. P 37; Gross et al., 12th ECCMID, abstr. P 704; J. A. Johnson, P. Murray, G. A. Denys, K. C. Hazen, and M. Saubolle, Abstr. 102nd Gen. Meet. Am. Soc. Microbiol., abstr. C-118, 2002; Marco et al., 12th ECCMID, abstr. P 712; D. M. Silver, L. Louie, and A. E. Simor, Abstr. 102nd Gen. Meet. Am. Soc. Microbiol., abstr. C-132, 2002). Silver et al. observed for staphylococci a slightly higher VME rate of 9.8% for the Phoenix system and of 8.1% for the VITEK 2 system, mostly seen with isolates that had low-level
oxacillin resistance (MICs between 4 and 8g/ml) (Silver et
al., 102nd Gen. Meet. Am. Soc. Microbiol.). Conversely,
John-son et al. detected 98.1% out of 312 methicillin-resistant S.
aureusisolates tested (VME, 1.9%) with the Phoenix system
when compared to SBM (Johnson et al., 102nd Gen. Meet. Am. Soc. Microbiol.). Likewise this performance is equivalent to those of the VITEK 2 and MicroScan systems overnight (12, 16, 17).
Given the current controversy regarding oxacillin break-points with CoNS, we tested all oxacillin-resistant strains for
themecAgene and found 3 out of 95 isolates to bemecAgene
negative. Three additionalmecA-negative strains tested
oxacil-lin sensitive by the Phoenix but resistant by the SBM method. This finding was confirmed by Horstkotte et al., who tested 124 CoNS strains by the Phoenix system and compared the results
to mecA gene results (M. A. Horstkotte, J. Knobloch, H.
Rohde, and D. Mack, Abstr. Dtsch. Gesellsch. Hyg. Mikrobiol. 2000, abstr. P 020, 2002). Using the new NCCLS breakpoints they found only one VME but 26 MEs; 15 of these 26 were
non-S. epidermidisstrains. However, when applying the DIN
breakpoint of 2.0 g/ml, only four MEs would have been
re-ported. Marco et al. and Gross et al. also questioned the appropriateness of the new NCCLS breakpoint for CoNS
other thanS. epidermidis. (Marco et al., 12th ECCMID, abstr.
on May 15, 2020 by guest
http://jcm.asm.org/
P 712; Gross et al., 12th ECCMID, abstr. P 704). Similar conclusions have been stated by Hussain et al. (11). Taking into account both the issues with the breakpoints and the reported results, we conclude that the Phoenix system gives very satisfying oxacillin test results.
The most commonly used antibiotic for MRS is vancomycin. With this antimicrobial agent, we observed a very good EA of 97.6%. The CA was also very good. Outright resistance to vancomycin has only been reported with staphylococci very recently, in two patients from geographically widely separated areas in the United States (htpp://www.cdc.gov/mmwr/preview /mmwrhtml/mm5126a1.htm and http://www.cdc.gov/mmwr /preview/mmwrhtml/mm5140a3.htm). In both cases an
entero-coccusvanAgene was detected. An intermediate level of
re-sistance has previously been reported rarely worldwide forS.
aureus, S. haemolyticus, andS. epidermidis. Such strains were
not available in this study.
Vancomycin is the antibiotic of choice for serious infections with ampicillin-resistant enterococci. Enterococcal resistance to vancomycin is commonly observed in the United States, and its frequency is increasing throughout the world (1, 4). All of the 32 vancomycin-resistant enterococci were correctly de-tected by the Phoenix system, and there was only one false resistant result. Gross et al. and Marco et al. found a CA of 100% for enterococci and vancomycin (Gross et al., 12th ECCMID, abstr. P 704; Marco et al., 12th ECCMID, abstr. P
712). Butterworth et al. investigated 86 isolates ofE. faecium
(46 with the vanA gene and 22 with thevanB gene) (A. M.
Butterworth, B. Turng, M. Votta, T. Wiles, J. Salomon, and J. Reuben, Abstr. 12th Eur. Cong. Clin. Microbiol. Infect. Dis. 2002, abstr. P 706). Compared to molecular methods the Phoe-nix system and the SBM method gave equal results, detecting
95% (44 of 46) of thevanAstrains and 77% (17 of 22) of the
vanB strains; for the latter the Bauer-Kirby method gave a
performance of 100%, and for thevanAstrains it gave a
per-formance of 87%. With 732 clinical enterococcal strains tested by the Phoenix system and SBM method for vancomycin re-sistance, Hamel et al. found a sensitivity and specificity of 100 and 98.7%, respectively, with no VME (K. M. Hamel, G. A. Denys, K. C. Hazen, P. Murray, J. Johnson, and M. Saubolle, Abstr. 102nd Gen. Meet. Am. Soc. Microbiol., abstr. C-118, 2002).
The MLS class is of some therapeutic importance for staph-ylococci but limited importance for enterococci, except for
quinupristin-dalfopristin withE. faecium. For staphylococci the
CA ranged from 93.0% (azithromycin) to 98.3% (quinupristin-dalfopristin); a CA of 94.5% was observed for enterococci with quinupristin-dalfopristin. Reuben et al. described for both bac-terial groups a CA of 95, 99, and 98% for azithromycin, clar-ithromycin, and quinupristin-dalfopristin, respectively, with one VME and three MEs (J. Reuben, D. Turner, C. Yu, and T. Wiles, Abstr. 40th Intersci. Conf. Antimicrobial Agents and Chemother., abstr. 1621, 2000).
Among the aminoglycosides only gentamicin results for staphylococci are available from other studies. Wiles et al. found an EA of 95% and a CA of 96% with no VME (Wiles et al., 9th ECCMID). These results are confirmed by Gross et al. (CA, 98.2%), Marco et al. (CA, 100%), and in the present study with 98.6% (Gross et al., 12th ECCMID, abstr. P 704; Marco et al., 12th ECCMID, abstr. P 712).
For HLAR of enterococci we detected two VMEs for gen-tamicin synergy and three VMEs for streptomycin synergy out of 163 isolates tested (combined VME, 4.72%), with a CA of 98.2%. Of these total five VMEs the SBM resistance result was verified by agar screen for three strains. Compared to the SBM results, Hong et al. detected no VME for both drugs out of 45 enterococci tested (J. Hong, J. Hejna, B. Turng, and V. Kennedy, Abstr. 100th Gen. Meet. Am. Soc. Microbiol., abstr. C-308, 2000). Gross et al. found three major discrepancies (90 strains tested), and Marco et al. detected no major differences for HLAR (40 strains tested) (Gross et al., 12th ECCMID, abstr. P 704; Marco et al., 12th ECCMID, abstr. P 712).
For the 5-fluoroquinolones there were a high EA and a high CA for staphylococci in our study, which was confirmed by the other working groups for ciprofloxacin (Wiles et al., 9th ECCMID; Gross et al., 12th ECCMID, abstr. P 704; Marco et al., 12th ECCMID, abstr. P 712).
In conclusion, the ID results of the Phoenix system were in very high agreement with those of the commercially available comparator systems used in this study. The AST performance
withStaphylococcusspp. andEnterococcusspp. was generally
highly equivalent to that of the SBM method. The specificity of the system, i.e., detection of susceptible strains, was, with a few exceptions, also very good. The Phoenix system was very ac-curate in detecting the most important resistance mechanisms encountered by this group of microorganisms. This included oxacillin resistance for staphylococci and vancomycin resis-tance for enterococci, compared to molecular methods.
ACKNOWLEDGMENTS
For excellent technical assistance we acknowledge U. Wild, S. Co-van, S. Rossi, and P. Somenzi, and for performing molecular tests we acknowledge M. Hengstler and R. Paulini. We also acknowledge the dedicated assistance of the personnel of BD Diagnostic Systems, es-pecially U. Kunert for coordination of the study.
This work was sponsored by Becton Dickinson and Company through its Diagnostic Systems Division, Sparks, Md.
REFERENCES
1. Bonten, M. J., R. Willems, and R. A. Weinstein.2001. Vancomycin-resistant enterococci: why are they here, and where do they come from? Lancet Infect. Dis.1:314–325.
2. Brisse, S., S. Stefani, J. Verhoef, A. Van Belkum, P. Vandamme, and W. Goessens.2002. Comparative evaluation of the BD Phoenix and VITEK 2 automated instruments for identification of isolates of theBurkholderia ce-paciacomplex. J. Clin. Microbiol.40:1743–1748.
3. Center for Devices and Radiological Health.2000. Guidance on review criteria for assessment of antimicrobial susceptibility devices. U.S. Depart-ment of Health and Human Services, U.S. Food and Drug Administration, Washington, D.C.
4. Cetinkaya, Y., P. Falk, and C. G. Mayhall.2000. Vancomycin-resistant en-terococci. Clin. Microbiol. Rev.13:686–707.
5. Comite´ de l’Antibiogramme de la Societe´ Franc¸aise de Microbiologie.1999. 1999 report of the Comite´ de l’Antibiogramme de la Societe´ Franc¸aise de Microbiologie. Institut Pasteur, Paris, France.
6. Deutsches Institut fu¨r Normung.1998. Methoden zur Empfindlichkeitspru¨-fung von mikrobiellen Krankheitserregern gegen Chemotherapeutika. Teil 4: Bewertungskriterien der minimalen Hemmkonzentration. DIN 58940-4, Bbl. 1.
7. Fluit, A. C., M. E. Jones. F. J. Schmitz, J. Acar, R. Gupta, and J. Verhoef for the SENTRY Participants Group.2000. Antimicrobial resistance among urinary tract infection (UTI) isolates in Europe: results from the SENTRY Antimicrobial Surveillance Program 1997. Antonie Leeuwenhoek77:147– 152.
8. Fluit, A. C., M. E. Jones, F.-J. Schmitz, J. Acar, R. Gupta, and J. Verhoef for the SENTRY Participants Group.2000. Bacteremia in European hospitals, incidence and antimicrobial susceptibility. Clin. Infect. Dis.30:454–460. 9. Fluit, A. C., F.-J. Schmitz, M. E. Jones, J. Acar, R. Gupta, and J. Verhoef for
the SENTRY Participants Group.1999. Antimicrobial resistance among
VOL. 41, 2003 PERFORMANCE OF BD PHOENIX SYSTEM FOR AST 1141
on May 15, 2020 by guest
http://jcm.asm.org/
community-acquired pneumonia isolates in Europe: first results from the SENTRY antimicrobial surveillance program 1997. Int. J. Infect. Dis.3:153– 156.
10. Garcia-Garrote, F., E. Cercenado, and E. Bouza.2000. Evaluation of a new system, VITEK 2, for identification and antimicrobial susceptibility testing of enterococci. J. Clin. Microbiol.38:2108–2111.
11. Hussain, Z., L. Stoakes, M. A. John, S. Garrow, and V. Fitzgerald.2002. Detection of methicillin resistance in primary blood culture isolates of co-agulase-negative staphylococci by PCR, slide agglutination, disk diffusion, and a commercial method. J. Clin. Microbiol.40:2251–2253.
12. Ligozzi, M., C. Bernini, M. G. Borona, M. de Fatima, J. Zuliani, and R. Fontana.2002. Evaluation of the VITEK 2 system for identification and antimicrobial susceptibility testing of medically relevant gram-positive cocci. J. Clin. Microbiol.40:1681–1686.
13. Livermore, D. M.1995.-Lactamases in laboratory and clinical resistance. Clin. Microbiol. Rev.8:557–584.
14. National Committee for Clinical Laboratory Standards.1999. Performance standards for antimicrobial susceptibility testing: ninth informational sup-plement, vol. 19, no 1. NCCLS document M 100-S 9. Approved standard M 7-A 4. National Committee for Clinical Laboratory Standards, Wayne, Pa. 15. Patel, R., J. R. Uhl, P. Kohner, M. K. Hopkins, and F. R. Cockerill III.1997.
Multiplex PCR detection ofvanA,vanB,vanC-1, and vanC-2/3genes in enterococci. J. Clin. Microbiol.35:703–707.
16. Sakoulas, G., H. S. Gold, L. Venkataraman, P. C. Degirolami, G. M. Elio-poulos, and Q. Qian.2001. Methicillin-resistantStaphylococcus aureus: com-parison of susceptibility testing methods and analysis ofmecA-positive sus-ceptible strains. J. Clin. Microbiol.39:3946–3951.
17. Swenson, J. M., P. P. Williams, G. Killgore, C. M. O’Hara, and F. C. Tenover.2001. Performance of eight methods, including two new rapid methods, for detection of oxacillin resistance in a challenge set of Staphylo-coccus aureusorganisms. J. Clin. Microbiol.39:3785–3788.