http://dx.doi.org/10.4236/ojoph.2015.53017
How to cite this paper: Merriam, J.C., Nong, E., Zheng, L. and Stohl, M. (2015) Optimization of the A Constant for the SRK/T Formula. Open Journal of Ophthalmology, 5, 108-114. http://dx.doi.org/10.4236/ojoph.2015.53017
Optimization of the A Constant for the
SRK/T Formula
John C. Merriam
1, Eva Nong
2, Lei Zheng
1, Malka Stohl
31Edward S. Harkness Eye Institute, College of Physicians and Surgeons, Columbia University, New York, NY, USA 2Department of Ophthalmology, University of Maryland, Baltimore, MD, USA
3New York State Psychiatric Institute, New York, NY, USA Email: [email protected]
Received 13 May 2015; accepted 31 July 2015; published 5 August 2015
Copyright © 2015 by authors and Scientific Research Publishing Inc.
This work is licensed under the Creative Commons Attribution International License (CC BY). http://creativecommons.org/licenses/by/4.0/
Abstract
Purpose: To evaluate the effect of axial length (AL) and the average preoperative keratometry (K) on the A constant in the SRK/T formula. Methods: The retrospective, comparative case series in-cludes 635 eyes from 407 cataract patients from Columbia University Medical Center from January 2006 to August 2010, operated by a single surgeon using a temporal incision and the Acrysof SN60WF IOL (Alcon Laboratories, TX). Using the postoperative manifest refraction and biometry data, we calculated the precise A constant (Ap) necessary to yield the postoperative spherical equivalent for each eye. To optimize the A constant, we developed three regression models (linear, quadratic, and categorical in 7 AL groups) to relate these precise A constants to AL and K. We veri-fied our method with another series of 45 eyes for which we calculated mean errors (defined as the difference between the spherical equivalent of the postoperative refraction and the predicted postoperative refraction) using the optimized and manufacturer’s suggested A constants. Results: There is a statistically significant relationship between AL (P < 0.001), K (P < 0.001) and the A con-stant. Ap increased as AL increased and as K decreased. In the validation data set, optimizing the A constant reduced mean errors from 0.50 D to 0.25 D and also reduced hyperopic refractive out-comes. Conclusions: The A constant for longer eyes with flatter corneas is larger than the A con-stant for shorter eyes with steeper corneas. Optimizing A concon-stants using both AL and K improved the predictability of refractive outcomes without modification to the SRK/T formula.
Keywords
Cataract Surgery, SRK/T, A Constant
1. Introduction
109
power formula, accurate biometry, and appropriate IOL constants. The SRK/T formula [1] is a third generation formula to determine the power of the implanted IOL. The IOL manufacturers suggest a lens-specific value for the A constant as a starting point for IOL calculation. Despite advances in surgical technique and biometry mea-surement, the post-operative refraction may deviate from the target refraction. Refinement of the constants of the IOL formulas may help to achieve the targeted refraction [2]-[4]. Olsen showed that incorporating the postopera-tive IOL position of the first eye improved the prediction accuracy for the second eye [5], and this method served as the basis for further studies [2] [6] [7]. Sheard and colleagues [8] reported that at the extremes of AL and K, the SRK/T was less accurate in calculating the corrected AL and corneal height, leading to inaccuracies in the IOL power prediction. Eom and colleagues showed that using A constants adjusted for corneal power improved refractive outcomes [9].
Authors of modern formulas have recommended many methods for optimizing IOL constants [10]-[12], but there is currently no standard method of optimization. Furthermore, patients with eyes at the extremes of axial length may be underrepresented [3]. This study examines the effect of AL and average preoperative keratometry (K) on the A constant using a large cohort of cataract surgery patients and the Acrysof SN60WF IOL. We de-veloped regression models to optimize the A constant for each eye using its AL and K measurements. Our results suggest the use of these optimized A constants can improve the accuracy of the predicted postoperative refrac-tion.
2. Methods
The Institutional Review Board of Columbia University approved this retrospective study of 635 cataract surgery cases (mean age 75 years, with 172 male eyes and 235 female eyes) with at least three consistent preoperative keratometry measurements and a consistent postoperative refraction. The study excludes patients unable to maintain fixation and those whose corneas were irregular due to conditions such as megalocornea or other con-genital abnormalities, scars, dystrophies, or edema, or whose cataracts were too dense for accurate AL measure-ment with the IOLMaster (Carl Zeiss Meditec AG, Jena, Germany).
The surgeon selected the IOL power based on the preoperative biometry using the SRK/T formula. Keratome-try measured with the IOLMaster was compared to manual keratomeKeratome-try, but in all cases the IOL calculation was based on the average keratometry values generated by the IOLMaster. A single surgeon (JCM) performed all procedures with local anesthesia and a temporal 2.2 or 2.6 mm clear corneal incision. The surgeon injected an Acrysof SN60WF (Alcon Laboratories, TX) into the capsule and dilated all patients postoperatively to be certain that both haptics of the IOL were within the capsule. The surgeon refracted all patients and entered the spherical equivalent of the stable postoperative manifest refraction into the IOLMaster’s database.
The biometry data for each patient was extracted from the IOLMaster database by Zeiss in Jena, Germany. Using the biometry data and the spherical equivalent of the postoperative manifest refraction, we used the SRK/T formula to back calculate the precise A constant (Ap) for each eye.3 We ran multiple regression analyses to identify three possible models to optimize the A constant based on AL and Kavg 1) as linear variables, 2) AL as a quadratic variable, and 3) AL as a categorical variable with 7 subgroups in 1 mm increments ranging from less than 22 mm to greater than 27 mm. Optimized A constants from each model were used to predict the refrac-tive outcome and the mean absolute error from the achieved refraction for each patient. The extracted data con-tained measurements from IOLMaster versions 3 and 5. Separate analysis of these two groups showed no signif-icant difference between their Ap (P = 0.91), and the groups were merged for this paper.
Statistical Analysis
Mixed linear models were developed to describe the association between Ap and age, gender, AL, and Kavg. Variables with no significant effect on Ap were removed from the regression models, and SAS PROC MIXED (SAS software version 9.2, SAS Inc., Cary, NC) was used to account for the intra-class correlation between eyes of the same patient and to allow for a random intercept. Results were considered statistically significant if the P value was < 0.05.
3. Results
3.1. The Models to Optimize the A Constant
110
Table 1. The mean, minimum, and maximum values of the data-adjusted precise A constant (Ap), AL, and Kavg.
Variable Mean + StdDev Min, Max
Maximum Mean + StdDev Min, Max
Data Set for Developing Formulas (635 eyes) Data Set for Validating Formulas (45 eyes)
Ap (mm) 119.31 ± 0.51 117.44, 122.58 -- --
AL (mm) 24.1 ± 1.37 20.5, 30.0 23.9 ± 1.16 22.2, 27.5
Kavg (mm) 43.7 ± 1.42 39.4, 48.3 44.1 ± 1.48 40.2, 47.1
mm. The Ap almost always differed from the manufacturer’s A constant of 118.7 mm. Linear regressions indi-cate that Ap has a significant correlation with both AL and K (P < 0.0001). No correlation is evident between Ap and age (P = 0.92). While a statistically significant relationship was also found between gender and the A-constant (P = 0.005), AL was highly correlated with gender, so gender provided no additional information to the model. Pearson correlation coefficients showed that AL (correlation coefficient 0.39) has a stronger effect than K (correlation coefficient −0.25) on Ap. AL and K are also inversely correlated with one another (correla-tion coefficient −0.23) (P < 0.0001). Figure 1 shows the relationship between Ap and the corresponding AL for each eye, and a least squares polynomial regression of the plot suggests that the relationship between the A con-stant and AL is non-linear (R2 = 0.25).
Regression analysis identified a linear model to describe the relationship between the A constant and both AL and K.
A=119.94 0.11AL 0.077K+ − (1)
In the linear model, an AL of 24 mm and K of 43.7 mm yield an optimized A constant of 119.22; and an AL of 27 mm and K of 43.7 m yield an A constant of 119.55.
In contrast, the quadratic model incorporates a quadratic AL term to allow for curvature to improve the fit.
( )
2A=150.84 2.32AL 0. 049 AL− + −0. 096K (2)
In the quadratic model, an AL of 24 mm and K of 43.7 mm yield an optimized A constant of 119.19; and an AL of 27 mm and K of 43.7 mm yield an A constant of 119.73.
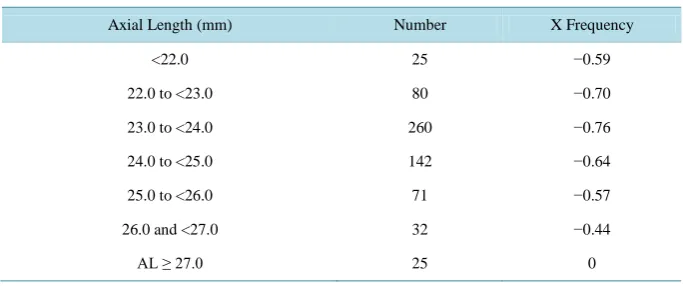
Finally, the categorical model employs seven AL subgroups as categorical variables (in 1 mm increments from less than 22 mm to greater than 27 mm) with an AL correction factor X that adjusts the A constant for each AL subgroup (Table 2). The AL factor X variable is a significant predictor of the A constant (p < 0.001)
A=123.93 ALfactorX 0.091K+ − (3)
In the categorical model, an AL of 24 mm and K of 43.7 mm and an AL factor of −0.64 result in an optimized A constant of 119.31 mm; and an AL of 27 mm and K of 43.7 mm and an AL factor of 0 result in an A constant of 119.95. For the same eye with AL 24 mm and K of 43.7 mm, all three regression models produce similar op-timized A’s that differ from the manufacturer’s A. For eyes with the same AL, a steeper cornea would yield a smaller A value, and vice versa. For example, for eyes with AL of 24 mm and mean K of 42.0 and 47.0 mm, the categorical model yields an A of 119.47 and 119.01, respectively. In summary, both AL and K influence the A constant, which increases with increasing AL and decreasing K. In other words, a larger A is needed for longer eyes with flatter corneas.
3.2. Validating the Models
We used a data set of 45 eyes to evaluate the accuracy of the predicted postoperative refraction with the opti-mized A constants. With A constants derived from our three models, the ULIB website1, and the manufacturer, the absolute value of the ME ranged from 0.00 to 1.25 D. The absolute value of the ME decreased from 0.50 D when using the manufacturer’s A to 0.25 D when using optimized As from any of the three models. Furthermore, Figure 2 shows that the optimized A constants decreased the percentage of eyes with positive mean errors, or hyperopia. Using the manufacturer’s A constant, 22.2% of the eyes in the validation data set have hyperopic ME
111
Figure 1. Axial lengths vs. precise A constants (Ap) for each eye. Ap increases with AL,
especially with AL > 26 mm. A least squares polynomial regression of the plot illustrates that the relationship between the Ap and AL is non-linear (R
2
[image:4.595.150.478.324.490.2]= 0.25).
Figure 2. Histogram of mean errors (ME) calculated using A constants from the three models, the manufacturer (118.7), and the User Group for Laser Interference Biometry (ULIB) website (119.0). ME is the difference between the spherical equivalent of the achieved postoperative refraction and the predicted postoperative refraction using optimized and manufacturer’s A constants. Optimized A constants from the models decreased the positive refractive or hyperopic errors, as predicted using the manufacturer’s A.
Table 2. Correction factor X for the seven AL subgroups of the categorical model.
Axial Length (mm) Number X Frequency
<22.0 25 −0.59
22.0 to <23.0 80 −0.70
23.0 to <24.0 260 −0.76
24.0 to <25.0 142 −0.64
25.0 to <26.0 71 −0.57
26.0 and <27.0 32 −0.44
[image:4.595.142.484.581.724.2]112
greater than +0.5 D. Using optimized A constants, none of the eyes from the three optimization models had hyperopic MEs greater than +0.5 D.
3.3. Validating
Cataract surgery is a refractive procedure, and suboptimal refractive outcomes may temper patient satisfaction [13]. This study found a statistically significant correlation between AL, K, and the optimized A constant within the SRK/T formula. A single A constant is not optimal for all eyes with different AL and K values. We showed that a larger optimized A constant is needed for eyes with longer AL and flatter corneas. Optimized A in turn reduced the postoperative error and hyperopic outcomes compared to using the manufacturer’s A. This is similar to the findings from previous studies that larger A constants may be needed to reduce hyperopic refractive errors [9].
Eom and colleagues examined the relationship between K, AL and predicted refractive error in 637 patients and found that the A constants decreased as K increased, consistent with our results. However, they concluded AL did not have a significant effect on postoperative error [9]. Our method differed, and we specifically eva-luated the effect of AL on the optimized A constants, not on refractive errors. We showed that using optimized A constants in turn improved the postoperative refractive error. Our finding that both AL and K are important is consistent with the study by Wang and colleagues, who reported that inaccurate estimation of AL contributes to postoperative refractive error in long eyes >25 mm [14]. They found that optimized AL, sometimes smaller than the measured AL, reduced hyperopic outcomes in long eyes [14].
Clinicians may use the authors’ A constants as a point of reference for each AL subgroup in the IOLMaster. A prior study found that optimizing IOL constants for the IOLMaster substantially improved refractive outcomes, far exceeding any additional benefit of personalizing IOL constants for individual surgeons [2]. Although all three regression models substantially improved the predicted refractive errors, the categorical model may be most easily programmed into the IOLMaster by creating AL groups. The optimized A constants in the categori-cal model were similar to As from the quadratic or linear models, and the A constant at high AL differs from the ULIB website’s A constant of 119.0. While the standard interface of the IOLMaster assumes that one will use a single A constant for each IOL, the categorical model creates different As for groups of eyes with different AL, so longer eyes would warrant a larger A than shorter eyes. Once clinicians have amassed a critical number of eyes, they may use a set of A constants specific to their practices. Achieving targeted refractive outcomes is dif-ficult in long eyes, which tend toward postoperative hyperopia [15]-[21]. When AL was measured with ultra-sound, postoperative refractive errors were attributed to the inaccurate estimation of AL [14] [16] [18] [22]. Af-ter the introduction of more accurate laser inAf-terferometry measurements, however, the formula-dependent IOL power calculation is believed to contribute most to the error [22] [23]. All three regression models substantially improved the predicted refractive errors. It is not difficult to calculate an A constant for an individual eye with the quadratic model, but the categorical model may be most easily programmed into the IOLMaster by creating AL groups.
Low myopia after surgery may work as a substitute for accommodation and make patients more spectacle- in-dependent [24] [25]. The manufacturer’s A constant tends to produce more hyperopic errors than an optimized A constant [2], and hyperopia is a particularly undesirable outcome [2]. While other causes of postoperative hyperopia include posteriorly angulated IOLs from capsular fibrosis or late capsular bag distension syndrome [26]-[28], our study suggests that the optimized A constants may also reduce postoperative hyperopia.
The range of acceptable error depends on the clinical significance of the refractive error. With a large data base of 8108 eyes, Aristodemou et al. analyzed the benefits of IOL constant optimization based on refractive outcomes using manufacturers’ and optimized IOL constants for the Hoffer Q, Holladay 1, and SRK/T formulas. They found that an A constant error exceeding 0.15 produced up to a 2.0% reduction in the percentage of eyes within ±0.50 D deviation from target refraction with the SRK/T formula [2]. Using the categorical model, an eye with an axial length of 24.08 mm and K of 43.68 mm has an optimized A constant of 119.32 mm, which is 0.62 greater than the manufacturer’s recommended value of 118.7 mm and far exceeds this A constant error limit of 0.15. While the IOLMaster optimizes the A constant using data from 10 or more eyes, as many as 257 eyes may be required to optimize an IOL constant with an error margin of 0.10 [2]. Furthermore, the IOLMaster only ge-nerates one A constant for all eyes, while our regression models generate optimized A constants personalized for each eye.
113
Hoffer Q, Holladay 1, and SRK/T formulas in 8108 eyes. They found that while all three tend to work equally well for medium length eyes, the Hoffer Q performed best in eyes with AL less than 22 mm and the SRK/T in eyes with AL > 27 mm [29]. In a separate study using the same database, Aristodemou also found that optimiz-ing the IOL constant improved the predictability of refraction outcomes more than the choice of third-generation IOL formulas [2]. Nevertheless, for short eyes, the clinician may consider using or comparing the results with the Hoffer Q. This study suggests that surgeons may improve the refractive outcomes using SRK/T formula across AL ranges by considering each eye’s AL and K measurements.
Acknowledgements
We would like to thank Stephen DeVience, PhD, for his support.
References
[1] Retzlaff, J.A., Sanders, D.R. and Kraff, M.C. (1990) Development of the SRK/T Intraocular Lens Implant Power Cal-culation Formula. Journal of Cataract & Refractive Surgery, 16, 333-340.
http://dx.doi.org/10.1016/S0886-3350(13)80705-5
[2] Aristodemou, P., Knox Cartwright, N.E., Sparrow, J.M. and Johnston, R.L. (2011b) Intraocular Lens Formula Constant Optimization and Partial Coherence Interferometry Biometry: Refractive Outcomes in 8108 Eyes after Cataract Surgery.
Journal of Cataract & Refractive Surgery, 37, 50-62. http://dx.doi.org/10.1016/j.jcrs.2010.07.037
[3] Ladas, J.G. and Stark, W.J. (2011) Improving Cataract Surgery Refractive Outcomes. Ophthalmology, 118, 1699-1700. http://dx.doi.org10.1016/j.ophtha.2011.05.038
[4] Merriam, J.C., Zheng, L., Merriam, J.E., Zaider, M. and Lindström, B. (2003) The Effect of Incisions for Cataract on Corneal Curvature. Ophthalmology, 110, 1807-1813. http://dx.doi.org10.1016/S0161-6420(03)00537-2
[5] Olsen, T., Løgstrup, N., Olesen, H. and Corydon, L. (1993) Using the Surgical Result in the First Eye to Calculate Intraocular Lens Power for the Second Eye. Journal of Cataract & Refractive Surgery, 19, 36-39.
[6] Olsen, T. (2011) Use of Fellow Eye Data in the Calculation of Intraocular Lens Power for the Second Eye. Ophthal-mology, 118, 1710-1715. http://dx.doi.org/10.1016/j.ophtha.2011.04.030
[7] Covert, D.J., Henry, C.R. and Koenig, S.B. (2010) Intraocular Lens Power Selection in the Second Eye of Patients Un-dergoing Bilateral, Sequential Cataract Extraction. Ophthalmology, 117, 49-54.
http://dx.doi.org/10.1016/j.ophtha.2009.06.020
[8] Sheard, R.M., Smith, G.T. and Cooke, D.L. (2010) Improving the Prediction Accuracy of the SRK/T Formula: The T2 Formula. Journal of Cataract & Refractive Surgery, 36, 1829-1834. http://dx.doi.org/10.1016/j.jcrs.2010.05.031
[9] Eom, Y., Kang, S.Y., Song, J.S. and Kim, H.M. (2013) Use of Corneal Power-Specific Constants to Improve the Accu-racy of the SRK/T Formula. Ophthalmology, 120, 477-481. http://dx.doi.org/10.1016/j.ophtha.2012.09.008
[10] Hoffer, K.J. (1993) The Hoffer Q Formula: A Comparison of Theoretic and Regression Formulas. Journal of Cataract & Refractive Surgery, 19, 700-712. http://dx.doi.org/10.1016/S0886-3350(13)80338-0
[11] Holladay, J.T. (1997) Standardizing Constants for Ultrasonic Biometry, Keratometry, and Intraocular Lens Power Cal- culations. Journal of Cataract & Refractive Surgery, 23, 1356-1370.
http://dx.doi.org/10.1016/S0886-3350(97)80115-0
[12] Petermeier, K., Gekeler, F., Messias, A., Spitzer, M.S., Haigis, W., and Szurman, P. (2009) Intraocular Lens Power Calculation and Optimized Constants for Highly Myopic Eyes. Journal of Cataract and Refractive Surgery, 35, 1575- 1581. http://dx.doi.org/10.1016/j.jcrs.2009.04.028
[13] MacLaren, R.E., Natkunarajah, M., Riaz, Y., Bourne, R.R., Restori, M. and Allan, B.D. (2007) Biometry and Formula Accuracy with Intraocular Lenses Used for Cataract Surgery in Extreme Hyperopia. American Journal of Ophthalmol-ogy, 143, 920-931. http://dx.doi.org/10.1016/j.ajo.2007.02.043
[14] Wang, L., Shirayama, M., Ma, X.J., Kohnen, T. and Koch, D.D. (2011) Optimizing Intraocular Lens Power Calcula- tions in Eyes with Axial Lengths above 25.0 mm. Journal of Cataract & Refractive Surgery, 37, 2018-2027.
http://dx.doi.org/10.1016/j.jcrs.2011.05.042
[15] Fechner, P.U., Kania, J. and Kienzle, S. (1988) The Value of a Zero Power Intraocular Lens. Journal of Cataract & Refractive Surgery, 14, 436-440. http://dx.doi.org/10.1016/S0886-3350(88)80155-X
[16] Kora, Y., Koike, M., Suzuki, Y., Inatomi, M., Fukado, Y. and Ozawa, T. (1991) Errors in IOL Power Calculations for Axial High Myopia. Ophthalmic Surgery, 22, 78-81.
114 http://dx.doi.org/10.1016/S0886-3350(96)80035-6
[18] Zaldivar, R., Shultz, M.C., Davidorf, J.M. and Holladay, J.T. (2000) Intraocular Lens Power Calculations in Patients with Extreme Myopia. Journal of Cataract and Refractive Surgery, 26, 668-674.
http://dx.doi.org/10.1016/S0886-3350(00)00367-9
[19] Tsang, C.S., Chong, G.S., Yiu, E.P. and Ho, C.K. (2003). Intraocular Lens Power Calculation Formulas in Chinese Eyes with High Axial Myopia. Journal of Cataract & Refractive Surgery, 29, 1358-1364.
http://dx.doi.org/10.1016/S0886-3350(02)01976-4
[20] MacLaren, R.E., Sagoo, M.S., Restori, M. and Allan, B.D. (2005) Biometry Accuracy Using Zero- and Negative-Pow- ered Intraocular Lenses. Journal of Cataract & Refractive Surgery, 31, 280-290.
http://dx.doi.org/10.1016/j.jcrs.2004.04.054
[21] Pomberg, M.L. and Miller, K.M. (2005) Preliminary Efficacy and Safety of Zero Diopter Lens Implantation in Highly Myopic Eyes. American Journal of Ophthalmology, 139, 914-915. http://dx.doi.org/10.1016/j.ajo.2004.11.031
[22] Olsen, T. (2012) Intraocular Lens Power Calculation Errors in Long Eyes. Journal of Cataract & Refractive Surgery,
38, 733-734. http://dx.doi.org/10.1016/j.jcrs.2012.02.003
[23] Norrby, S. (2008) Sources of Error in Intraocular Lens Power Calculation. Journal of Cataract & Refractive Surgery,
34, 368-376. http://dx.doi.org/10.1016/j.jcrs.2007.10.031
[24] Elder, M.J., Murphy, C. and Sanderson, G.F. (1996) Apparent Accommodation and Depth of Field in Pseudophakia.
Journal of Cataract & Refractive Surgery, 22, 615-619. http://dx.doi.org/10.1016/S0886-3350(96)80020-4
[25] Datiles, M.B. and Gancayco, T. (1990) Low Myopia with Low Astigmatic Correction Gives Cataract Surgery Patients Good Depth of Focus. Ophthalmology, 97, 922-926. http://dx.doi.org/10.1016/S0161-6420(90)32480-6
[26] Nishi, O., Nishi, K. and Takahashi, E. (1998) Capsular Bag Distention Syndrome Noted 5 Years after Intraocular Lens Implantation. American Journal of Ophthalmology, 125, 545-547. http://dx.doi.org/10.1016/S0002-9394(99)80195-0
[27] Wendrix, G. and Zeyen, T. (2006) Late-Onset Capsular Bag Distention Syndrome after Cataract Surgery: 2 Case-Re- ports.Bulletin of the Belgian Society of Ophthalmology, 30, 67-69.
[28] Davison, J.A. (1993) Capsule Contraction Syndrome. Journal of Cataract & Refractive Surgery, 19, 582-589. http://dx.doi.org/10.1016/S0886-3350(13)80004-1