Optimal Location and Rating of Thyristor Controlled
Series Capacitor for Enhancement of Voltage Stability
using Fast Voltage Stability Index (FVSI) Approach
M. Senthil Kumar
Sona College of Technology, Salem,
Tamilnadu, India
P. Renuga
Thiagarajar College of Engineering, Madurai,
Tamilnadu, India
K.Maharaja
Sona College of Technology, Salem,
Tamilnadu, India
ABSTRACT
In an electric power system network, the continuous demand has caused it to be heavily loaded leading to voltage instability. This phenomenon has also led to voltage profile depreciation below the acceptable secure limit. The significance and use of Flexible AC Transmission System devices and capacitor placement is in order to alleviate the voltage profile decay problem. This paper presents an application of Bacterial Foraging algorithm in optimizing the rating of Thyristor Controlled Series Capacitor for voltage profile improvement, minimization of losses and voltage stability enhancement. Voltage stability level of the system is defined based on the Fast Voltage Stability Index (FVSI) approach. The IEEE 14 bus system is used as a test system in order to demonstrate the height of applicability and efficiency of the proposed system. The test result shows that the location of TCSC improves the voltage profile of the system and also minimizes the transmission line losses.
Keywords
Bacterial Foraging (BF) Algorithm, Fast Voltage Stability Index (FVSI), Flexible AC Transmission System (FACTS), Multi-Objective function, Thyristor Controlled Series Capacitor (TCSC).
1.
INTRODUCTION
Most large power system blackouts, which occurred worldwide over the last twenty years, are caused by heavily stressed system with large amount of real and reactive power demand and low voltage condition. When the voltages at the system buses are low, the losses will also be increased. This study is devoted to develop a technique for improving the voltage and minimizing the losses and hence eliminate voltage instability in a power system [1]. Static Var Compensator (SVC), Thyristor Controlled Phase Shifting Transformer (TCPST) and Thyristor Controlled Series Capacitor (TCSC) etc., can maintain voltage profile in the power systems and, therefore, can control the active power through a transmission line [11].
Many advantages in power system operation and planning can be immediately realized by regulating the power flows and simultaneously supporting the bus voltages. Such advantages include the minimization of system losses, elimination of line overloads and low voltage profiles. F.G.Bagriyanik et al [4] proposed a technique for power loss minimization based on Genetic Algorithm using TCSC. R.Benabid et.al [5] proposed an application of NSPSO for solving the optimal location and size of SVC and TCSC that can help for voltage stability enhancement. This paper proposes a method for finding the
optimal rating of Thyristor Controlled Series Capacitor (TCSC) using Bacterial Foraging algorithm in order to minimize the loss, voltage profile improvement and voltage stability enhancement. The voltage stability assessment is analyzed using Fast Voltage Stability Index (FVSI) approach. FVSI gives a scalar number to each line of the system. This index ranges from zero (no load system) to one (voltage collapse). Thus critical line will be the line with the highest FVSI value and the load bus connected in the line will be vulnerable bus in the system [14]-[15]. This paper uses minimization of FVSI of the system as one of the objectives of the optimization problem.
The Bacterial Foraging algorithm is a computational intelligence based technique that is not largely affected by the size and nonlinearity of the problem. The bacterial foraging algorithm can converge to the optimal solution in many problems where most analytical methods fail to converge. A load flow program written in MATLAB using bacterial foraging technique was used to compute power flow. The test results show that the location and sizing of the TCSC identified by the proposed technique improves voltage level of the system and also minimize the transmission losses. For practical and economic considerations, the number of TCSC units is limited to one [13]. Here TCSC is connected in between buses 5 and 6 (line 18) in IEEE 14- bus system.
This paper is organized as follows: Model of TCSC is given in section 2. Problem Formulation is given in section 3. Bacterial Foraging algorithm for proposed method is given in section 4. Results and discussion are given in section 5, the conclusion is drawn in section 6.
2.
MODEL OF THYRISTOR
CONTROLLED SERIES CAPACITOR
(TCSC)
Thyristor Controlled Series Capacitor (TCSC) is a series compensation component which consists of capacitor bank shunted by Thyristor Controlled Reactor (TCR). The basic idea behind power flow control with TCSC is to decrease or increase the overall effective impedance of the transmission line, by adding a capacitive or inductive reactance correspondingly. The TCSC is modeled as a variable impedance, where the equivalent reactance of the line Xij is
defined as
XijXlineXTCSC (1)
where, Xlineis the transmission line reactance, and XTCSC is
The level of the applied compensation of the TCSC usually varies between 20% inductive reactance and 80% capacitive reactance [5].
3.
PROBLEM FORMULATION
The objective function of this paper is to find the optimal location and rating of TCSC which minimizes the line losses, voltage deviation and FVSI. This is mathematically stated as [8] - [9], [12], [14]:
Minimize
F=[f1,f2,f3] (2)
The first term f1 represents real power loss as [8], [12]
l loss Nl
k
ij j i j i
k V V VV P
g
f
) cos 2
( 2 2
1
(3)
The second term f2 represents the total voltage deviation (VD)
of all load buses from desired value of 1 p.u.
2 1
2
( )
PQ
N
k
k
k Vref
V VD
f
(4)
The last term f3 is the Fast Voltage Stability Index (FVSI) of
the line ij and is given by [14]-[15]
ij 2 i
j 2
ij 3
X
V
Q
4Z
=
FVSI
=
f
(5)Z = Line impedance
Xij = Line reactance
Qj = reactive power at the receiving end
Vi = sending end voltage
The minimization problem is subject to the following equality and inequality Constraints:
Load Flow Constraints:
Ng j
B ij
ij ij ij j i
i V V G B i N
P
1
1 ,... 2 , 1 , 0 ) sin cos
( (6)
i j( ijsin ij ijcos ij) 0, 1,2,... PQ 1
i V V G B i N
Q (7)
(ii) Voltage Constraints:
Vi ViVi ;iNB max min
(8)
(iii) Reactive Power Generation Limit:
Qgi QgiQgi ;iNg
max min
(9)
(iv) Reactive Power Generation Limit of capacitor banks:
Qci QciQci ;iNc max min
(10)
4.
BACTERIAL FORAGING
ALGORITHM FOR THE PROPOSED
METHOD
Foraging theory is based on the assumption that animals search for nutrients which maximizes their energy intake (E) per unit time (T) spent for foraging [6]. The E.coli bacterium is probably the best understood micro organism.The bacterial foraging optimization (BFO) algorithm mimics how bacteria forage over a landscape of nutrients to perform parallel nongradient optimization. The Mutation in E.coli occurs at a rate of about 10-7 per gene, per generation and can affect its physiological aspects. The E.coli bacterium has the control system that enables it to search for food and avoid noxious
substance. To find the minimum of J
,Rp where there is no measurements or analytical description of the gradient
J . is the control variable (line reactance) ant it is a position of a bacterium and J
represents the combined effects of attractants and repellents from the environment, for example J
<0, J
=0 and J
>0 representing that the bacterium at location
is nutrient-rich, neutral and noxious environments respectively.Let j be the index for the chemotactic step, k be the index for the reproduction step and l be the index of the elimination-dispersal event.
LetP
j,k,l
i
j,k,l
i1,2,....S
(13) The equation (13) represents the position of each member in the population of the S bacteria, at the jth chemotactic step,𝐾𝑡ℎ reproduction step and 𝑖𝑡ℎelimination-dispersal event. Let
𝑁𝑐be the length of the life time of the bacteria as measured by the number of chemotactic steps taken during their life. Let
iC >0, i =1,2,….S denotes a basic chemotactic step size, that is used to define the lengths of steps during runs. The control parameters of bacterial foraging algorithm are given in the Table 1.
Table 1. Control Parameters of the Bacterial Foraging
Algorithm [6]
S.No Parameters Values
1 Number of bacteria ,S 50
2 Maximum number of steps, Ns 4
3 Number of chemotactic steps,Nc 100
4 Number of reproduction steps,Nre 4
5 Number of elimination-disperse steps, Ned 2
6 Probability, 𝑃𝑒𝑑 0.25
7 Size of the step, C(i) 0.1
5.
RESULTS AND DISCUSSIONS
control variables for the test system. The initial real power loss is 13.5100 MW for the Normal case (i.e. light load). For critical case, the initial real power loss is 60.2100 MW (Table IV).
Case 1: results of optimal power flow without TCSC and with one TCSC for the base case (i.e. light load).
Case 2: results of optimal power flow without TCSC and with one TCSC for the critical case (i.e. heavy load-whose loads and initial power generations are twice as those of case 1).
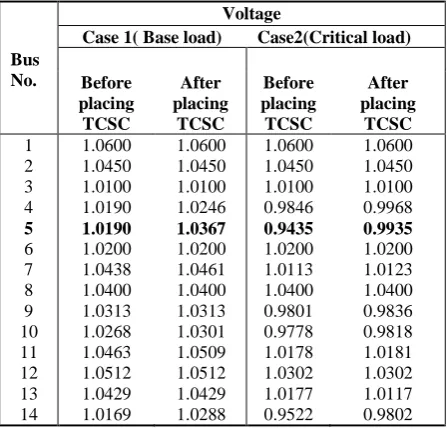
The aim of case-2 is minimized losses with optimal placement of TCSC in weakest line. For practical and economic considerations, the number of TCSC units is limited to one [13]. Based on highest FVSI values of test system, line18 will be considered as critical. The impedance of line with TCSC (0.2440p.u and 0.2230 p.u) is connected in line 18 (between buses 5 and 6) to perform the test for the normal and critical cases. On placing line TCSC (between buses 5 and 6) FVSI value is decreased from 0.4377 to 0.4260(for normal case) and it is decreased from 0.9210 to 0.4973 (for critical case) (refer table 3). For critical case, the system voltages get reduced below the minimum limit. The voltage of the load bus (bus 5) connected in line 18 during critical load is 0.9435 (below the minimum value of 0.9500) (see Figure.3.).
Table 2. Control Variables for IEEE 14-Bus System
Test case Variables Minimum (p.u)
Maximum (p.u)
14 bus system
Voltage 0.95 1.10
Tap setting 0.90 1.10
[image:3.595.315.546.70.279.2]XTCSC -0.8Xline 0.2Xline
Table 3.Real Power Loss for Normal and Critical Case (p.u)
Line Losses
Case 1 (Normal load) Case 2 (Critical load)
Before placing TCSC After placing TCSC Before placing TCSC After placing TCSC
[image:3.595.317.541.315.530.2]0.1351 0. 1328 0.6021 0. 5846
Table 4. FVSI Values of Each Line of IEEE 14-Bus System
Line No
FVSI values
Case 1( Base load) Case2(Critical load) Before placing TCSC After placing TCSC Before placing TCSC After placing TCSC 1 2 3 4 5 6 7 8 9 10 11 12 13 14 15 16 17 18 19 20 0.0475 0.0143 0.0060 0.0292 0.0118 0.0305 0.0029 0.0164 0.0188 0.0355 0.0149 0.0314 0.0159 0.0980 0.0290 0.0000 0.3605 0.4377 0.1829 0.0698 0.0475 0.0143 0.0060 0.0292 0.0118 0.0305 0.0029 0.0164 0.0188 0.0355 0.0149 0.0314 0.0159 0.0980 0.0290 0.0000 0.3605 0.4260 0.1829 0.0698 0.3096 0.0285 0.5604 0.0584 0.0236 0.0609 0.0060 0.0329 0.0377 0.0711 0.0312 0.0659 0.0333 0.2000 0.0598 0.0000 0.7502 0.9210 0.3348 0.1443 0.3096 0.0285 0.5604 0.0584 0.0236 0.0609 0.0060 0.0329 0.0377 0.0711 0.0312 0.0659 0.0333 0.2000 0.0598 0.0000 0.7502 0.4973 0.3348 0.1443
Table 5. Voltage Magnitudes of the IEEE 14-bus System
Bus No.
Voltage
Case 1( Base load) Case2(Critical load)
Before placing TCSC After placing TCSC Before placing TCSC After placing TCSC 1 2 3 4 5 6 7 8 9 10 11 12 13 14 1.0600 1.0450 1.0100 1.0190 1.0190 1.0200 1.0438 1.0400 1.0313 1.0268 1.0463 1.0512 1.0429 1.0169 1.0600 1.0450 1.0100 1.0246 1.0367 1.0200 1.0461 1.0400 1.0313 1.0301 1.0509 1.0512 1.0429 1.0288 1.0600 1.0450 1.0100 0.9846 0.9435 1.0200 1.0113 1.0400 0.9801 0.9778 1.0178 1.0302 1.0177 0.9522 1.0600 1.0450 1.0100 0.9968 0.9935 1.0200 1.0123 1.0400 0.9836 0.9818 1.0181 1.0302 1.0117 0.9802
[image:3.595.45.289.455.584.2]Table 6. Real Power Loss and Computational Time
Figure 1: Line Number Vs FVSI values of IEEE 14-bus
[image:4.595.325.539.310.459.2]System without TCSC
Figure 2: Line Number Vs FVSI values of IEEE 14-bus
Figure 3: Bus Number Vs Voltage Magnitudes of IEEE 14 bus System with TCSC
Figure 4: Bus Number Vs Voltage Magnitudes of IEEE 14 bus System with TCSC
When the TCSC is placed in line 18, the voltage gets improved to 0.9935 (see Figure. 4.). Also, on placing of TCSC between buses 5 and 6, the line losses get decreased from 60.2100 MW to 58.4600 MW for the critical case. With regard to IEEE 14-bus system, BF obtains 1.52% loss reduction compared to GA value reported [4] for the same test system and 1.97% loss reduction compared to NSPSO value reported[5]for the same test system. This shows the effectiveness of the proposed approach in minimizing the transmission line losses and voltage profile improvement simultaneously.
6.
CONCLUSIONS
This paper made an attempt to find the optimal location and rating of TCSC for minimizing the losses, Fast Voltage Stability Index (FVSI) and voltage profile improvement, which are taken as objective functions using bacterial foraging optimization algorithm. Results are presented for IEEE 14-bus test reliability system. The test results show that the bacterial foraging technique has the ability to improve voltage profile along with minimization of transmission losses in the system.
0 2 4 6 8 10 12 14 16 18 20 0
0.2 0.4 0.6 0.8 1 1.2 1.4
Line Number
F
V
S
I
v
a
lu
e
Normal case Critical case
0 2 4 6 8 10 12 14 16 18 20 0
0.1 0.2 0.3 0.4 0.5 0.6 0.7 0.8
Line Number
F
V
S
I
v
a
lu
e
Normal case Critical case
1 2 3 4 5 6 7 8 9 10 11 12 13 14 0.9
0.92 0.94 0.96 0.98 1 1.02 1.04 1.06 1.08 1.1
Bus Number
V
o
lt
a
g
e
M
a
g
n
it
u
d
e
(p
.u
.)
VOLTAGE MAGNITUDES FOR IEEE 14-BUS SYSTEM WITHOUT FACTS
BASE CASE CRITICAL CASE
0 2 4 6 8 10 12 14 0.98
0.99 1 1.01 1.02 1.03 1.04 1.05 1.06 1.07
Bus Number
V
ol
ta
ge
M
ag
ni
tu
de
s(
p.
u)
Normal case Critical case
Algorithm Particulars Case-1 Case-2
GA Minimum
Loss (MW)
13.400 -
NSPSO Minimum Loss(MW)
13.460 -
BF Algorithm
Minimum Loss(MW)
13.280 58.460
Comp. Time (Sec)
[image:4.595.66.266.472.667.2]7.
REFERENCES
[1] IEEE Publications,: Voltage Stability Analysis of Power Systems: Concepts, Analytical Tools and Industry Experience, IEEE Working Group on Voltage Stability, 1990.
[2] C.H. Liang, C.Y.Chung, K.P. Wong, X.Z.Duan, C.T.Tse, Study of Differential Evolution for Optimal Reactive Power Dispatch, IET, Gen. Trans. Distribu. 1(2007), pp 253-260.
[3] H.Yoshida, K.Kawata, Y.Fukuyama, S.Takayama, Y.Nakinishi: A Particle Swarm Optimization for Reactive Power and Voltage Control Considering Voltage Security Assessment, IEEE Transactions on Power Systems, 15(2000) pp 1232-1239.
[4] F.G.Bagriyanik, Z.E.Aygen and M.Bagriyanik: Power Loss Minimization using Fuzzy Multi-Objective Formulation and Genetic Algorithm, IEEE Bolonga Power Tech Conference, June 23-26, Bolonga, Italy 2003.
[5] R.Benabid, M.Boudour M.A Abido,: Optimal Location and Setting of SVC and TCSC devices using Non- Dominated Sorting Practicle Swarm Optimization, Journal of Electrical Power System Research,2009 pp 1668- 1677.
[6] Kevin M Passino,: Biomimicry of Bacterial Foraging for Distributed Optimization and Control, IEEE Control Systems Magazine, June 2002.
[7] M.Gitizadeh, M.Kalantar,: A Novel Approach for Optimum Allocation of FACTS Devices using Multi -Objective Function, Journal of Energy Conversion and Management, 2009, pp 682-690.
[8] M.Senthil Kumar, Dr.P.Renuga, D.Prasad,:A Bacterial Foraging Based Multi-Objective Reactive Power
Planning, International Journal of Applied Engineering Research, NewDelhi Vol 4, No 8, 2009 pp 1413-1422
[9] Antonino Augugliaro, Luigi Dusonchet, Salvatore favuzza And Eleonora Riva Sanseverino,: Voltage Regulation and Power Losses Minimization in Automated Distribution Networks by an Evolutionary Multi objective Approach, IEEE Transactions on Power Systems, vol 19 no.3 Aug 2004 pp 1516-152
[10]P.K.Modi, S.P.Singh, J.D.Sharma,: Fuzzy Neural Network Based Voltage Stability Evaluation of Power Systems with SVC, Journal of Applied Soft Computing, 2008 pp 657- 665.
[11]Garng. M.Huang, Nirmal Kumar C Nair,: Incorporating TCSC into the Voltage Stability Constrained OPF Formulation, IEEE Power Engineering Society Summer Meeting, Vol no 3, 2002, pp 1547-1552.
[12]M.Senthil Kumar, Dr.P.Renuga,: Bacterial Foraging Algorithm based Enhancement of Voltage Profile and Minimization of Losses using TCSC, International Journal of Computer Applications Vol 74, No 2, September 2010 pp 21-27.
[13]Garng. M.Huang, Nirmal Kumar C Nair, Incorporating TCSC into the Voltage Stability Constrained OPF Formulation, IEEE Power Engineering Society Summer Meeting Vol no 3 2002, pp 1547-1552.
[14]Ismail Musirin and Titik Khawa Abdul Rahman,: Novel Fast Voltage Stability Index for voltage stability analysis in power system transmission, Student conference on Research and development proceedings, 2002, Shah Alam, Malaysia.