The Effect of Surface Conditions on Diffusion and
Permeability of Acetone through uPVC
Drahosh Vesely
1,*, Ming Zhu
1,21Department of Materials, Oxford University, Parks Road, Oxford OX1 3PH, UK 2Skshu Paints Joint-Stock Ltd.Co., 518#Li Yuan, North Str. Pu Tian, Fu Jian, China, 35110
*Corresponding Author:[email protected]
Copyright © 2014 Horizon Research Publishing All rights reserved.
Abstract
Understanding diffusion and permeability processes in organic materials is important for applications to structural components, protective coatings or packaging. In this work some basic behaviour of solvent diffusion into and through a polymer are studied using acetone and un-plasticized polyvinyl chloride at room temperature as model materials. Special cell for gravimetric measurements is used to provide data on diffusion and permeability rates through samples of different thicknesses. It is shown that the rates of mass transport are slowing down with thickness for diffusion and also for permeability, as expected. However permeability mass transport is slower than mass delivered to the outer surface by diffusion. This is explained and experimentally verified by insufficient saturation of the surface layer, as the solvent evaporates before a full saturation is reached. When the outer surface layer is pre-saturated with solvent, permeability will increase several times. When evaporation is restricted (e.g. closed cavity) the liquid solvent will accumulate, filling up the cavity. Concentration profiles, measured by infrared microscopy, confirm this observation. It is suggested that the experimental data can be explained by using chemical potential and chemical reaction kinetics.Keywords
Permeability, Diffusion, uPVC, Acetone, FTIR Microscopy1. Introduction
Permeability of liquids through polymers is increasingly important with steady increase in polymer applications. Unlike metals or glasses, polymers can be more easily penetrated by liquids or vapours. It is therefore important to understand the parameters controlling the mass transport through polymers.
There are many theories of diffusion currently being used. The oldest is based on heat conductivity (Fourier 1822 [1]). This theory was adapted for diffusion of salts in solutions and through cell membranes by Fick (1855 [2]) and since
then has been widely applied even to diffusion of liquids into a solid polymer matrix. It has been shown many times (e.g. [3]),that for homogeneous materials (and therefore constant increase in resistance to flow with the sample thickness) the diffusion distance must be dependent on square root of time and that only concentration profiles can determine the diffusion mechanism. However concentration profiles are difficult to measure and therefore mostly calculated by using suitable theories. Nevertheless some attempts to experimentally analyze concentration profiles have been made. It has been observed by light microscopy in 1946 (Hartley [4] and Robinson [5]) that there is a sharp diffusion front, followed by a near constant concentration. This has been confirmed later by many other techniques, e.g. light microscopy of stained penetrants (Thomas and Windle [6-7]), electron microscopy with X-ray analysis (Parker and Vesely [8]), infrared spectroscopy on cut samples (Vesely and Zhang [9]), Rutherford back scattering (Zhou et al. [10]) and magnetic resonance imaging (Dutheillet et al. [11]).
To explain these observations using Fick’s approach, a variable diffusion coefficient would have to be used (see e.g. Crank [12]). Alternatively, some new models have been suggested, e.g. Case II, which explains the measured concentration profiles better, but requires a constant diffusion rate, resulting in high permeability, independent of sample thickness. None of the current mechanisms correlates fully with measured diffusion and permeability data.
The observations that the diffusion theories should explain are the diffusion rates and concentration profiles, their dependence on temperature, chemical and structural composition, and application to permeability. Diffusion is a dynamic process and therefore in-situ methods are the most valuable, particularly when data have been corrected for resolution, sample thickness, probe size, solvent evaporation, polymer relaxation and elapsed time. Unfortunately these corrections are not always taken into account.
system [13] an attempt has been made to correlate the rate of diffusion and permeability, showing a significant dependence on sample thickness and polymer microstructure. In this work another system is investigated (un-plasticized polyvinyl chloride (uPVC)/acetone. Diffusion and permeability are again measured by gravimetry at room temperature, but using a cell with an improved seal. This provides data on diffusion and permeability rates, as well as solubility levels. However the transition between diffusion and permeability is not as steep as for PMMA/methanol, which is also confirmed by infrared microscopy on thin samples. Of particular interest is the shape of concentration profiles when the diffusion front reaches the outer surface (onset of permeability). To our knowledge this important aspect of permeability has not yet been investigated.
2. Experimental
[image:2.595.314.552.267.361.2]The polymer used (uPVC) was purchased from Goodfellow, and HPLC grade acetone from Aldrich. It has been shown in our previous paper [13] that polymers supplied as sheets of different thickness have slightly different densities and significantly different diffusion rates. Details of polymer additives and processing methods are unfortunately not provided by the suppliers. For this reason the same sheet (4.38 mm thick) was used for all measurements and the thickness was reduced by grinding one surface to the required thickness. Some physical parameters are provided by Goodfellow (density 1.4 g/cm3, refractive index 1.54, elongation at break 60%, dielectric constant 2.7-3.1, etc.).
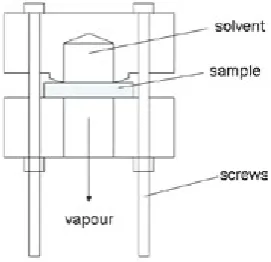
Figure 1. Schematic drawing of the permeability cell. The cell was placed on a balance and the weight losses were recorded at time intervals.
A schematic drawing of a cell for gravimetric measurements of diffusion and permeability rates is shown in Figure 1.
The seal was made by a 3o wedge, which provided a better seal than the rubber ‘o’ ring. For measurements of diffusion and permeability, the cell was inverted, filled with acetone and a uPVC sample was attached. The cell was inverted back, (so that the penetrant came into contact with the sample) and placed on a balance. The changes in weight were recorded at selected intervals (usually 1 minute) using a computer. The
main drawback is the inaccuracy in determining the surface area, as the sample can buckle and diffusion can bypass the seal. These effects can however be taken into account but changes in polymer microstructure (additives, thermal history, orientation, stresses) are more difficult to evaluate.
For Fourier Transform Infrared (FTIR) microscopy measurements of concentration profiles, thin samples were prepared by melting a small amount of polymer between glass cover slips (see Figures 2 and 3). This provided films of
uniform thickness (about 20 μm thick). Rectangular samples
with a rectangular hole (‘frame’ like samples) were cut from a pre-moulded thin film and re-melted between glass cover slips (closed cell), (Figure 2). Straight edges, parallel with
the 10x400 μm infrared probe, were needed for spatial
[image:2.595.313.550.399.487.2]resolution.
Figure 2. Schematic drawing of a closed cell to measure diffusion and permeability concentration profiles with no extraction.
Figure 3. Schematic drawing of an open cell. The solvent diffusing through the sample into a cavity evaporates and vapour escapes. FTIR microscopy reveals the concentration profile during diffusion and during permeability.
In order to allow the penetrant to escape from the centre of the ‘frame’ like sample , a hole about 1mm in diameter was drilled through the glass using a diamond cutter (open cell) (Figure 3). The absorption of IR light by glass is substantial for the lower part of the infrared spectrum, but the region at 2000-4000 cm-1 has low absorption and can therefore be utilized. The acetone peak at 3380-3433 cm-1 (carbonyl overtone) was used on its own, as the C-H peaks of uPVC and acetone partially overlap. Potassium bromide (KBr) discs have much lower absorption but are too brittle.
An FTIR microscope with adjustable apertures (Perkin Elmer) was used. This technique provides spectra from a series of parallel, rectangular, non-overlapping regions of the
sample as determined by the selected 10x400 μm aperture
and therefore the concentration profile could be measured. It is essential that the sample edge is within 10 microns
aperture along its whole length (400 μm). In order to obtain
[image:2.595.116.252.474.605.2]and therefore spectral peaks with a high wave number (short wave length) are preferred. Peaks at around 3400 cm-1 have a wave length of about 2.9 μm and thus an aperture of 10 μm
can be used with minimum loss of spatial resolution. In the current work non-overlapping probes were used: aperture 10
or 50 μm apart. The resolution was tested by scanning an
edge of PS film. Only a very small uncertainty within the aperture size could be detected. On the other hand the peak at 600 cm-1 used by others (e.g. Hsu et al. [16]) has a wave
length of 16.6 μm and aperture of 25 μm will substantially
reduce the spatial resolution, due to diffraction effects. Corrections of results for resolution are therefore required.
The FTIR spectra of uPVC/acetone show increased background absorption from scattering at the edge interface. This makes the analysis of sharp boundaries more difficult as the moving probe (50μm steps) cannot avoid the boundaries.
Nevertheless, there are some features which can be used with confidence.
The major inaccuracy in the interpretation of spectra is to establish the base line, from which the peak height is measured. The spectral peaks were therefore integrated within 3380-3433 cm-1 and include the background. The measurements of absolute values of concentrations have thus not been possible. Particular difficulties were experienced at the polymer-solvent interface and at the sharp diffusion front where the light was scattered, distorting the base line. The accurate solubility levels can be determined by other techniques, such as gravimetric measurements.
The scanning time for a spectrum is about 30 seconds and thus for 20 spectra, 10 minutes is needed. The time can be shortened by using fewer scans per spectrum; however we found that due to the random nature of light absorption at least 60 scans per spectrum are necessary for a reasonable and reproducible average.
For permeability, when the diffusion front reaches the outer surface and is thus stationary, no time dependent corrections were needed. Also the scatter of data was reduced by calculating an average of 5 measurements.
3. Results and Discussion
3.1. Diffusion and Permeability Rates
The gravimetric measurements of mass loss from a cell are in Figure 4. It can be concluded from the graphs that losses of acetone through the seals, before the diffusion front reaches the outer surface, are negligible (horizontal line indicates no losses). The graphs also indicate a sharp concentration change at the diffusion front and a constant concentration at the saturation level (as dictated by phase diagrams). The decreasing slope of the measured graphs with increasing sample thickness shows clearly the thickness dependence of permeability rate.
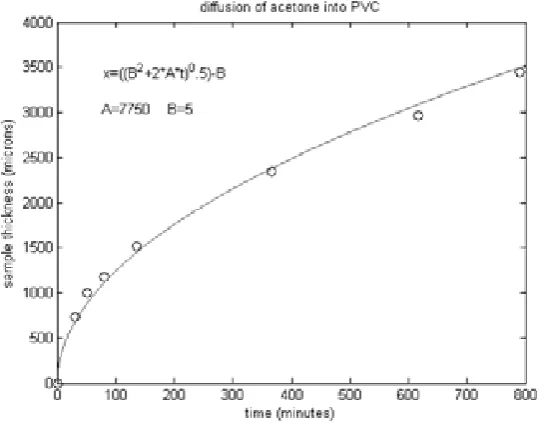
The onset of permeability represents the diffusion time needed for penetration through a sample of a given thickness. Analysis of these data (see Fig.5) shows clearly that the diffusion distance is dependent on the square root of time. The initial diffusion rate must be finite (represented by a constant BD). This might be a logical assumption and it is essential for good fit to the experimental data. From this dependence (Figure 5) the diffusion constant A and the constant BD limiting the initial diffusion rate to finite value, can be calculated using the best fit to the equation (1):
xD=((BD 2 +2AtD)0.5 –BD) (1) The equation (1) has been derived ( [3,14,15]) from equation (2) for the rate of diffusion:
vD = A/(xD + BD) (2) Constant A for the diffusion rate has the same dimension
Figure 4. Permeability data from a cell (see Figure 1) for seven samples of different thicknesses. The onset of permeability corresponds to the diffusion time for a particular sample thickness indicated here and also in Table 1.
Figure 5. Diffusion distance per diffusion time data from permeability cell, fitted with equation (1), using constants A=7750 (μm2/min) and B
D=5 (μm).
Experimental data (Figure (5) and Table (1)) show that diffusion of acetone in uPVC is nearly 40x faster compared to diffusion of methanol in PMMA [13]. It has a much broader transition from unsaturated to fully saturated polymer (about 0.1 mm). For PMMA/methanol the transition from diffusion to permeability is much faster (within the measuring steps of 1 minute) suggesting a very narrow diffusion front([13]). Also, in uPVC/acetone the permeation curves (mass loss measurements) are not straight lines (contrary to PMMA/methanol), but show slightly increasing permeability rate with time. This means that the polymer structure at the exit surface layer is slowly saturating (relative to the diffusion rate). This makes evaluation of diffusion and permeability rates less accurate. Measured data
are used to calculate the diffusion parameters for the best fit to equation (1) and are summarized in Table (1). Figure 5. shows the dependence of xD on tD. The fitting parameters are
A= 7750 μm2/min, BD= 5 μm. This will enable us to calculate the diffusion rate vD and thus the mass transported by diffusion MD using equation (3):
[image:4.595.169.442.338.551.2]behind the diffusion front, as has been observed by many authors [3-11] and also in this work. The sample swelling is unidirectional, as the swelling zone is restricted by the surrounding polymer volume which is not exposed to the solvent. For a free sample, the linear fraction of swelling was measured for all three dimensions as 0.45, 0.38 and 0.40 respectively, showing the anisotropy of the sample.
Table 1. Diffusion and permeability rates through samples of different thickness.
The data are compared with mass lost by permeability (permeability slope PS). It is apparent that more mass could be delivered to the outer surface layer by diffusion than is lost by evaporation. This is a different behaviour to PMMA/methanol, and can be interpreted by a slower swelling rate compared to the rate of evaporation from the surface layer. Because of the faster diffusion, there is less time for uPVC to saturate. The surface layer therefore is not fully saturated as there is not enough solvent available. This can be confirmed by the following experiment: The permeability cell can be temporarily inverted and a small amount of acetone placed on the outer surface of the sample. Weighing will show clearly when the acetone on the sample surface evaporates fully. The cell is then inverted again and permeability measured. The results show a substantial increase in permeability, confirming the incomplete saturation of the surface layer when the diffusion front reaches the outer surface.
3.2. Concentration Profiles
Concentration measurements require quantitative analytical techniques with high spatial resolution. There are not many techniques available (see e.g. review [3]) and for that reason there are still speculations about concentration profiles during diffusion. In this work an attempt is made to use FTIR microscopy to reveal some basic features of the concentration profiles during diffusion and permeability.
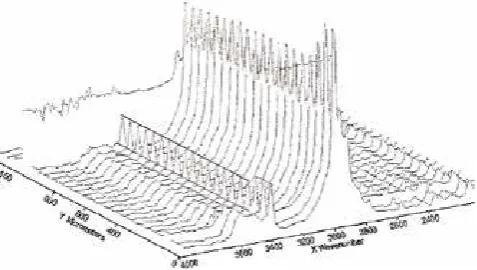
Figure (6) shows FTIR spectra at 50 μm intervals through
the swollen diffusion region. It can be seen that the acetone peaks are of the same heights, indicating constant concentration behind the diffusion front. A line has been drawn through the peaks for easy orientation. The diffusion
front is less than 100 μm wide and therefore only one
spectrum could be taken within the transition region. Unfortunately, light scattering at the sharp diffusion front significantly increases the base line, which hides the spectra
[image:5.595.313.548.343.535.2]for the region not yet penetrated by the solvents.
Figure 6. FTIR spectra at 50 μm intervals, from the initial surface to the diffusion front. An aperture of area 10x400 μm has been selected. A line is
drawn through the acetone peaks at 3420 cm-1 for easy orientation. A
constant concentration behind the diffusion front is evident.
The peaks for individual spectra were integrated within the limits of 3380-3433 cm-1 and are plotted in Figure (7) for two different cases: closed and opened cells.
Figure 7. FTIR integrated acetone peaks for a closed cell (o) and opened cell (+). The closed cell clearly shows the accumulation of acetone in the
cavity (50 μm steps). Data from an opened cell are also shown in Figure 8 at
greater resolution (10 μm steps) and on a scale from 1000 to 1160 μm. The
solid line through the data has been calculated using equation (5).
The absolute values of concentrations cannot be obtained with this technique, but from independent volume and weight measurements we know that uPVC will increase in volume 2 times and weight 1.6 times. It can be concluded that within the accuracy of the experiment the volume of acetone absorbed is equal to the volume of swelling.
ρ=1.6/2=0.8 (density of acetone is 0.79). For a detailed analysis of the diffusion front, spectra at 10 μm intervals had
reached (5 hours). The data scatter has been reduced by averaging over 5 readings taken at intervals of one hour. The solid line is calculated using the model of Molecular Sorption [3, 14, 15]. This result again confirms that the surface layer is not completely saturated, because all the solvent delivered to the surface by diffusion will evaporate. An equilibrium is thus reached between diffusion rate and evaporation rate
[image:6.595.64.289.186.361.2]
Figure 8. Data for an opened cell are plotted from Figure 7 on a finer scale (1000-1160 microns). Only the diffusion front is plotted and fitted with equation (5) for Molecular Sorption model using values A=7750 μm2 min-1,
BD=5 μm and K=0.248 min-1. Uncertainty of 10 μm in location of the outer
surface is dependent on selected steps and aperture size (resolution).
The data for concentration profiles have been fitted well assuming the chemical kinetics equation [3]
C(t)/Co = exp(-Kt) (4) This equation can be modified to describe the concentration decrease (1-) and progress of the diffusion front from left to right (tD –t), where tD is the starting time at C=0. The equation can be further modified by replacing time for a distance dependence using the equation (1):
C(x)/Co=1-exp((-K/2A)((xD2-x2)+2BD(xD-x))) (5) Where xD is the diffusion distance at a particular time tD, and x (or t) are the coordinates of the concentration profile.
The constants A (μm2/min), BD (μm), C/Co and K(min-1) can be evaluated from the experimental data, using the best fit calculation. Constant A is calculated from the rate of diffusion [3]. Constant BD controls the initial diffusion rate and can be calculated from the time dependent diffusion distance. Constant Co is the equilibrium concentration corresponding to the phase diagram and can be accurately measured by gravimetry at sample saturation (Bernardo and Vesely [19-22]). Constant K describes the sorption rate and can be evaluated from the shape of the diffusion front. (This constant of chemical kinetics K is different from k=2A/BD2, which was introduced previously (Vesely [15]) for a quick evaluation of BD and A). K/2A controls the shape of the diffusion front. All constants are dependent on temperature and on the chemical nature of molecules. Currently these
constants cannot be predicted theoretically, although some serious attempts have been made, particularly for Co (see e.g. [23, 24] and other books on chemical thermodynamics).
The diffusion front is broader for uPVC/acetone than for PMMA/methanol [6, 7, 13]. This will influence the state of the exit layer, as the penetrant evaporates before it can saturate the surface layer. For a broader front there is more polymer volume to be saturated. The presence of partially swollen surface layer can be shown by gravimetric measurements of permeability. The measured values for permeability rate through the 4.38 mm thick sheet of uPVC was 0.003 g/h. However, when exit surface was temporarily exposed to acetone, permeability increased to 0.006 g/h. This clearly indicates the importance of surface swelling and its dependence on the supply of penetrant.
The degree of swelling is related to plasticization of the polymer matrix and can be measured e.g. by hardness testing. A pyramidal indent with a load of 400 g was used. The side exposed to solvent had a much larger diagonal of the indent than the side open to air, again clearly indicating different mechanical properties of the inner and the outer surface and therefore incomplete swelling when the diffusion front reaches the outer surface.
3.3. Diffusion into Cavities
The evaporation of penetrant from the outer surface can be limited by a low evaporation rate (e.g. by using a penetrant with a low vapour pressure or by increasing the vapour pressure in a closed space - cavity). Figure (2) shows a cavity formed by cover slips on ‘ring’ or ‘frame’ shaped samples. The FTIR measurements of acetone concentration in a cavity (Figure 7 ‘o’) show accumulation of pure acetone inside the cavity.
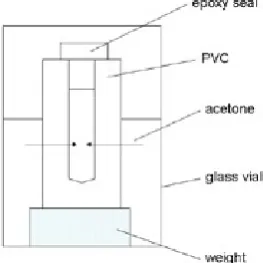
This effect can also be demonstrated on a more macroscopic scale: Figure (9) shows a closed uPVC tube 3mm in diameter with a drilled hole 1.58 mm in diameter. The top of the cell has been sealed with epoxy. When the cell is partially immersed in acetone, the penetrant will diffuse through the uPVC wall and accumulate in the cavity. The level of acetone inside the tube is 4 mm higher than the level of surrounding acetone due to capillary elevation (Figure10).
[image:6.595.365.497.585.717.2]
Figure 10. Photo of the closed uPVC tube after acetone diffused through the tube wall. Increased acetone level due to capillary elevation is apparent. This is a clear evidence of mass transport from a low (in the polymer) to a high (in the cavity) concentration.
Similar behaviour has been reported previouslyfor hexane in polystyrene (Morrissey and Vesely [25]) and acetic acid in epoxy (Dutheillet et al. [11]). Figure (7) shows the concentration measurements using FTIR microscopy for a closed and for an opened cell. It is obvious from this graph that pure solvent accumulates in the cavity. Also a constant concentration level behind the diffusion front (as dictated by phase diagrams) is apparent.
The explanation of this behaviour is logical from the point of view of chemical potential, as equilibrium is achieved when chemical potential of a saturated polymer is equal to chemical potential of pure solvent.
μ solvent = μ solvent in polymer = μ solvent (6)
[image:7.595.79.280.79.239.2]3.4. De-sorption
Figure 11. De-sorption of acetone from uPVC. Experimental data (o) are fitted with a double exponential function showing fast and slow de-sorption.
uPVC sheet 4.38 mm thick and size 16x30 mm was immersed in acetone for the time needed for full saturation
(20 hours needed to reach saturation plateau, which was extended to 36 hours). On removal, weight and dimensional changes with time were recorded. Figure (11) shows the weight losses with time.
The data can be fitted with two exponential functions, one describing the initial fast losses and the second the slow losses. It has been observed that preferential evaporation from the surface results in formation of a surface layer (shrinkage). The fast evaporation of acetone will deplete the surface layer and this will reduce the surface swelling and thus the de-sorption rate. Diffusion of the penetrant to the surface is therefore reduced. There is some uncertainty at the beginning, as the time between evaporation of acetone adsorbed onto the surface and absorbed into the surface layer cannot be clearly defined, but the best fit to the data indicate that about 3% of total solvent is adsorbed at the surface. Also, the graph does not terminate at zero but at a finite value of about 10%, which can be interpreted as equilibrium concentration at room temperature. There are therefore four stages of de-sorption: evaporation from the surface (adsorbed acetone), fast evaporation from the surface layer, slow evaporation of solvent diffusing through the skin and finally residual solvent at equilibrium with the matrix and outside environment. This can be described using a double exponential function:
w/wo = 0.52*exp(-0.007*t)+0.35*exp(-0.05*t)+0.1 (7) De-sorption is considered by some to be the reverse of the diffusion process. However, the state of the surface layer is very sensitive to the rate of de-sorption and the swollen structure does not return to the original with the loss of solvent. These effects have been well studied e.g. on drying wood and ceramic bodies. The dependence of de-sorption on extraction rate makes the permeability measurements using carrier gas difficult.
It has been reported previously (Vesely and Zhang [9]) that some additives can be removed from the polymer by a solvent. The same was observed here: when the sample was removed from the solvent and the remaining solvent, in which the polymer sample was immersed, was evaporated, some solid residue remained. These are most likely additives and low molecular weight polymer fractions of uPVC. Detailed analysis of the residue has not been possible.
4. Conclusions
[image:7.595.60.293.480.693.2]to interpret the data with a model of Molecular Sorption. Similar concentration profiles were reported on other systems controlled by phase diagrams, showing a sharp diffusion front and a constant concentration in the saturated region, e.g. polymers [3-11], metals (e.g. Espritu and Amorsolo [26] or Onishi and Fujibuchi [27]), ceramics and chemical reactions (e.g. oxidation)).
The concentration profile at the diffusion front for uPVC/acetone, as measured by FTIR microscopy, is broader than for PMMA/methanol system. This indicates that the diffusion rate is faster compared to the sorption rate. The consequences are that when the diffusion front reaches the outer surface, solvent starts to evaporate and full saturation of the surface layer cannot be achieved, slowing down the permeability rate. This conclusion is well supported by experiments. The high sensitivity of diffusion and permeability rates on molecular structure (e.g. degree of swelling) makes meaningful, quantitative and reproducible evaluation of permeability data difficult, as the concentration of solvent at the exit surface is critically dependent on the solvent extraction rate.
On the other hand, when the solvent is not extracted, (e.g. diffusion into a closed cavity) it can accumulate, filling up the cavity, as shown again in this work. This is in accord with chemical potential, as chemical potential in solvent saturated polymer is equal to pure solvent (solubility is limited as dictated by phase diagrams).
It is shown that de-sorption is not a reverse of the sorption process, but is controlled by solvent extraction rate (like permeability) and therefore by the state of the polymer matrix at the surface.
Extraction of additives and low molecular weight polymer fragments by the solvent, together with residual solvent, permanently changes the polymer matrix, i.e. the polymer after exposure to solvent cannot return back to its original state even at full de-sorption.
This work clearly indicates that theories developed for diffusion of heat, gasses, solubility of salts or fully miscible liquids must be used with caution for systems following phase diagrams.
REFERENCES
[1] J.B. Fourier, Théorie analytique de la chaleur. 1822, English translation New York. Dover Publishers, 1955
[2] A.Fick, On liquid diffusion, Philosophical Magazine, Ser.4; 10:63(1855) 30-39
[3] D.Vesely, Diffusion of liquids in polymers, International Materials Reviews, 53(5)(2008) 299-315
[4] G.S.Hartley, Diffusion and swelling of high polymers, Part I, Trans. Farad. Soc. 42b(1946) 6-11
[5] C.Robinson, Diffusion and swelling of high polymers Part II, Trans.Farad.Soc. 45(1946)12-17
[6] N.L.Thomas, A.H. Windle, A deformation model for Casae II
diffusion, Polymer 21 (1980)613-619
[7] N.L.Thomas, A.H. Windle, A theory of Case II diffusion, Polymer 23(1982) 529-541
[8] A.Parker, D.Vesely, Temperature and time dependence of diffusion of PCL into PVC, J.Polymer Science B 24(1986)1869-1878
[9] D.Vesely, S.J.Zhang, Diffusion and migration of DOP in PVC, 3rd Int. Conf. on Diff. in Polymers, PRI York (1991)2/1-2/4
[10] Q.Y. Zhou, A.S.Argon, R.E. Cohen, Enhanced Case II diffusion of diluents into glassy polymers undergoing plastic flow, Polymer 42(2001) 613-621
[11] Y.Dutheillet, M.Mantle, D.Vesely, L.Gladden, Diffusion of water-acetic acid mixture in epoxy, J.Polymer Science B 37(1999) 3328-3336
[12] J.Crank, The Mathematics of Diffusion, Oxford Science Publications, 1993
[13] M.Zhu, D. Vesely, The effect of polymer swelling and resistance to flow on solvent diffusion and prermeability, European Polymer Journal 43(2007) 4503-4515
[14] D.Vesely, The rate of solvent diffusion in amorphous polymers, Macromol.Symposia 138 (1999)215-223 [15] D.Vesely, Molesular sorption mechanism of sovent diffusion
in polymers, Polymer 42(2001)4417-4422
[16] F.C.Hsu, D.Lin-Vien, R.N.French, Probing the concentration profiles of additives in polymers by IR microscopy: The diffusion of cytasorb UV 531 in polypropylene, Applied Spectroscopy 46(1992)225
[17] C.M.Hansen, The significance of the surface condition in solutions to the diffusion equation explaining ‘anomalous’ sigmoidal Case II and super Case II absorption behaviour, European Polymer Journal 46(2010) 651-662
[18] J.H.Petropoulos, M.Sanopoulou, K.G.Papadokostaki, Physically insightful modelling of non-Fickian kinetic regimes encountered in fundamental studies of isothermal sorption of swelling agent in polymeric media, European Polymer Journal 47(2011) 2053-2062
[19] G.Bernardo, D.Vesely, Equilibrium solubility of alcohols in polystyrene attained by controlled diffusion, European Polymer Journal 43(2007) 938-948
[20] G.Bernardo, D.Vesely, Solubility of carboxylic acids in a matrix of uncross-linked polystyrene, European Polymer Journal 43(2007) 4983-4994
[21] G.Bernardo, D.Vesely, Solubility of alkanes in polystyrene matrix, J.Applied Polymer Science 104(2008) 2393-2398 [22] G.Bernardo, D.Vesely, Anomalous swelling of a polystyrene
matrix in organic solvents, J. Applied Polymer Science 115(2010) 2402-2408
[23] P.J. Flory, Principles of polymer chemistry, Cornell University Press, Ithaca, 1953
[24] P-G.deGennes, Scalling Concepts in Polymer Physics, Cornell University Press, Ithaca, 1979
rates of small molecules through polymers, Polymer 41(2000) 1865-1872
[26] R.D.V.Espiritu, A.V.Amorsolo, SEM-EDX analysis of intermetalic phases in a Cu-Zn-Sn shape memory alloy,
Microscopy and Analysis 24(2010) 15-16