Journal of Chemical and Pharmaceutical Research, 2013, 5(12):1083-1088
Research Article
CODEN(USA) : JCPRC5
ISSN : 0975-7384
The research on petrochemistry components mapping with ASTER data
Ming Tao*
1,2, Zhang Wenshan
3and Peng Guangxiong
31
College of Civil Engineering & Architecture, China Three Gorges University, Daxue Street, Xiling
District, Yichang City, Hubei Province, China
2
National Field Observation and Research Station of Landslides in Three Gorges of Yangtze River, China
Three Gorges University, Daxue Street, Xiling District, Yichang City, Hubei Province, China
3
Central South University, Lu Shan Nan Street, Yuelu District, Changsha City, Hunan Province, China
_____________________________________________________________________________________________
ABSTRACT
ASTER Data have high spectral resolution and can be used to quickly mapping on a variety of mineral alteration .The pertrochemistry components in an area in Ethiopia were chosen as experimental targets. Eight types of mineral alteration were extracted using method of PCA and band ratio from ASTER data. Each type of mineral alteration was divided into three levels. Finally the petrochemistry components maps were finished. They provid guidance for further geological prospecting work .
Key words: Alteration extraction, Petrochemistry components, ASTER
_____________________________________________________________________________________________
INTRODUCTION
Anomaly alteration information can be extracted from TM data successfully by using the principal component analysis(PCA) technique and Crosta rule[1].But the spectral resolution of TM is limited. Their three types of bands in TM including visible and near-infrared (VNIR) and shortwave infrared (SWIR) bands. This means that only iron-oxide and hydroxyl anomaly alteration information can be extracted. The higher spectral resolution remote sensing data are needed in petrochemistry components mapping.
Table1. Bands characteristics of ASTER sensor
Group Band Spectral range(µm) Resolution
VNIR
1 0.52-0.60
15 2 0.63-0.69
3N 0.78-0.86 3B 0.78-0.86
SWIR
4 1.60-1.70
30 5 2.145-2.185
6 2.185-2.225 7 2.235-2.285 8 2.295-2.365 9 2.36-2.43
TIR
10 8.125-8.475
90 11 8.475-8.825
12 8.925-9.275 13 10.25-10.95 14 10.95-11.65
groups of bands in ASTER sensor including VNIR,SWIR and thermal infrared radiation (TIR). The bands characteristics are presented in Table1.
According to early studies, A. P. Crosta extracted alunite, illite, kaolinite+smectite and kaolinite using ASTER imagery and principal component analysis[3]. Lv Fengjun and his collaborators rebulit alteration mineralization spectral curves on ASTER remote sensing data based on representative alteration minerals reflectivity data in USGS
standard spectral database. They extracted Al-OH, Mg-OH and CO3
from ASTER data[4]. Aleks Kalinowski and Simon Oliver provided Commonly used ASTER band ratios and band combinations[5].
Since the 1990 s, ASTER data have been used in a variety of types of mineral exploration including epithermal gold deposits, laterite nickel deposits, copper polymetallic deposits etc[6-9].
We chose an area as the experimental area in Ethiopia. Ethiopia is a country located in the northeast of Africa with rich metallic mineral resources. The terrain in experimental area is varied and ups and downs with sparse vegetation. It is very suitable for remote sensing data acquisition, processing and interpretation. There is good metallogenic geological conditions in experimental and many outcrops were discovered in the previous geological work. So it is an ideal experimental area.
EXPERIMENTAL SECTION
The area of experimental area is about 1400 square kilometers. Iron-oxide, Al-OH, Mg-OH, alunite, illite, kaolinite,
sericite and silicawere chosen as the research targets. Alteration information of Iron-oxide, Al-OH, Mg-OH,
alunite, illite, kaolinite, sericite were extracted by PCA and silica was band ratio[3-5]. ASTER data processing and mapping used software of ENVI4.5.
The experiment was divided into four steps. The first step was to get the experimental ASTER data covering experimental area. The second step was data pre-processing. Next step was alteration extraction. The extraction methods are PCA and band ratio. The forth step was anomaly alteration information classification. Anomaly alteration information were divided into three levels by thresolding technique[10].The last step was petrochemistry components mapping. The flow diagram is presented in Figure 1.
Figure 1: Flow Diagram of Experiment
ASTER data acquisition and data pre-processing
Anomaly alteration extraction by PCA
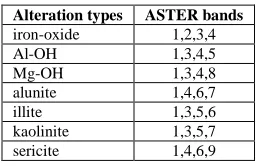
[image:3.595.242.373.134.217.2]Iron-oxide, Al-OH, Mg-OH, alunite, illite, kaolinite, sericite alteration were extracted by PCA. The alteration types and the ASTER bands used to extract information are presented in Table 2.
Table 2. Alteration and types and ASTER bands
Alteration types ASTER bands
iron-oxide 1,2,3,4 Al-OH 1,3,4,5 Mg-OH 1,3,4,8 alunite 1,4,6,7 illite 1,3,5,6 kaolinite 1,3,5,7 sericite 1,4,6,9
The PCA eigenvector loadings of each alteration type are presented in Table 3 to Table 9.
Table 3. Iron-oxide alteration extraction PCA eigenvector loadings table
Band1 Band2 Band3 Band4
PC1 0.411070 0.234331 0.682904 0.556554 PC2 0.909540 -0.051631 -0.342181 -0.230183 PC3 0.017295 -0.747423 -0.254029 0.613620 PC4 0.058820 -0.619502 0.593316 -0.510621
Table 4. Al-OH alteration extraction PCA eigenvector loadings table
Band1 Band3 Band4 Band5
PC1 0.249355 0.506134 0.650358 0.508611 PC2 0.404259 0.714915 -0.375443 -0.429551 PC3 0.709877 -0.321250 -0.399731 0.482792 PC4 -0.520069 0.359893 -0.525635 0.568958
Table 5. Mg-OH alteration extraction PCA eigenvector loadings table
Band1 Band3 Band4 Band8
PC1 0.246155 0.494725 0.632544 0.542718 PC2 0.393880 0.733879 -0.392559 -0.390099 PC3 0.555804 -0.261528 -0.520568 0.593038 PC4 0.689455 -0.385060 0.418084 -0.448983
Table 6. Alunite alteration extraction PCA eigenvector loadings table
Band1 Band3 Band5 Band7
PC1 0.274481 0.536185 0.546467 0.581842 PC2 0.350150 0.717080 -0.431337 -0.420880 PC3 -0.883512 0.442536 0.116286 -0.100235 PC4 0.146501 -0.049642 0.708379 -0.688675
Table 7. Illite alteration extraction PCA eigenvector loadings table
Band1 Band3 Band5 Band6
PC1 0.265353 0.525221 0.539622 0.602112 PC2 0.355049 0.726400 -0.399440 -0.432124 PC3 0.896176 -0.443265 -0.017996 0.007840 PC4 -0.019920 0.001680 -0.740900 0.671318
Table 8. Kaolinite alteration extraction PCA eigenvector loadings table
Band1 Band4 Band6 Band7
Table 9. Sericite alteration extraction PCA eigenvector loadings table
Band1 Band4 Band6 Band9
PC1 0.231634 0.645294 0.574129 0.447568 PC2 0.951574 -0.266625 -0.137156 0.067877 PC3 -0.165741 -0.707087 0.471986 0.499787 PC4 -0.115686 0.111963 -0.654823 0.738436
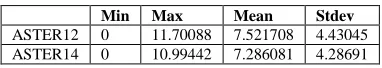
Silica alteration were extracted by band ratio. The bands statistical table presented in Table 10.
Table 10.Silica alteration extraction bands statistical table
Min Max Mean Stdev
ASTER12 0 11.70088 7.521708 4.43045 ASTER14 0 10.99442 7.286081 4.28691
Information classification and petrochemistry components mapping
Anomaly alteration information was divided into three levels by the multiple of standard deviation of principal
component image. Anomaly alteration principal component image standard deviation α was selected as classification
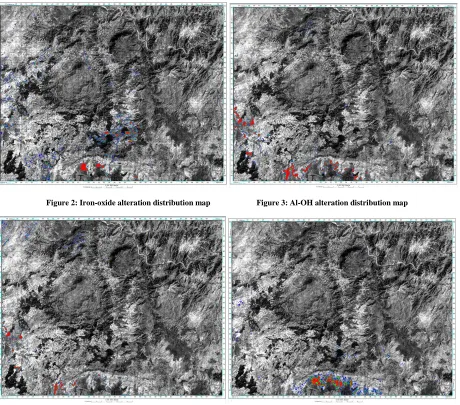
index. Three levels are 2α, 2.5α and 3α. Different colors re[resent different levels in petrochemistry components map.
Red represented high level. Green represented medium level. Blue represented low level.
RESULTS AND DISCUSSION
Analysis of alteration PCA eigenvector loadings
In Iron-oxide alteration extraction PCA eigenvector loadings table, the sign of band1 and band3 are positive and they are opposite to band2 and band4 in PC4. According to Crosta rule, the Iron-oxide anomaly alteration principal component is PC4 and the bright pixels present the Iron-oxide Iron-oxide alteration.
In Al-OH alteration extraction PCA eigenvector loadings table, the sign of band4 is negative and is opposite to band5 in PC4. The alteration principal component is PC4 and the dark pixels present Al-OH anomaly alteration.
In Mg-OH alteration extraction PCA eigenvector loadings table, the sign of band4 is positive and is opposite to band8 in PC4. The alteration principal component is PC4 and the bright pixels present Mg-OH anomaly alteration.
In alunite alteration extraction PCA eigenvector loadings table, the sign of band5 is positive and is opposite to band7 in PC4. The alteration principal component is PC4 and the bright dark present alunite anomaly alteration.
In illite alteration extraction PCA eigenvector loadings table, the sign of band5 is negative and is opposite to band6 in PC4. The alteration principal component is PC4 and the bright dark present illite anomaly alteration.
In kaolinite alteration extraction PCA eigenvector loadings table, the sign of band6 is negative and is opposite to band7 in PC4. The alteration principal component is PC4 and the bright present kaolinite anomaly alteration.
In sericite alteration extraction PCA eigenvector loadings table, the sign of band6 is negative and is opposite to band9 in PC4. The alteration principal component is PC4 and the bright present sericite anomaly alteration.
Petrochemistry components mapping results
Figure 2: Iron-oxide alteration distribution map Figure 3: Al-OH alteration distribution map
Figure 4: Mg-OH alteration distribution map Figure 5: Al-OH alunite distribution map
Figure 8: Sericite alteration distribution map Figure 9: Silica alunite distribution map
CONCLUSION
ASTER data have higher spectral resolution then TM data and can identify more minerals. Eight types of alteration including iron-oxide, Al-OH, Mg-OH, alunite, illite, kaolinite, sericite and silica alteration were easily extracted because of abundant spectral information in ASTER data. PCA and band ratio are convenient and feasible methods to extracted alteration. ASTER data and these extraction methods provide us simple and fast petrochemistry components mapping technique. It is very meaningful for geological prospecting work in large area.
In addition, considering bands and band ratios do not indicate the occurrence of a mineral with absolute certainty or with any idea of quantity, the ground work is still indispensable.
REFERENCES
[1]W P Loughlint. Photogrammetric Engineering & Remote Sensing.1991,57, 1163–1169. CROSTA A P;MOORE
J MCM.Proceedings of the 9th Thematic Conference on Remote Sensing for Exploration Geology, Calgary (Ann
Arbor, MI: Environmental Research Institute of Michigan),1985,1173–1187.
[2]Yan Shouxun;Zhang Bing;Zhao Yongchao;Remote Sensing Techniques and Application, 2004, 19 ( 1 ): 52-63.
[3]Crosta A P;DucartD F; Carlos Roberto;De Souza Filho.Reviews in Economic Geology, 2009, 16: 97-108.
[4]Crosta A P;Souza Filho C R;Azevedo F.International Journal of Remote Sensing, 2003, 24: 4233-4240.
[5]Seoane JC S;Castro N A;Osako L S.Reviews in Economic Geology, 2009, 16,109-122.
[6]Ma Jianwen.Journal of Remote Sensing,1997,3,22-26.
[7]Zhang Yujun;Yang Jianmin;Chen Bi.National Resource Remote Sensing,2002,4,30-36.
[8]Dai Jingjing;Qu Xiaoming;Xin Hongbo. Geological bulletin of China.2010,29(5),752-759.