__________________________________________________
ISSN No: 0975-7384
J. Chem. Pharm. Res., 2010, 2(2):350-356
350
Development and validation of UV- Spectroscopic method for
estimation of Voglibose in bulk and tablets
N. Mallikarjuna Rao*1, J. Bagyalakshmi1 and T. K. Ravi1
1
Department of Pharmaceutical Analysis, Sri Ramakrishna Institute of Paramedical Sciences, New Siddapudur, Coimbatore, India
______________________________________________________________________________
Abstract
Simple, rapid, sensitive and accurate UV- Spectrophotometric methods have been developed for estimation of Voglibose in pharmaceutical formulation. Since Voglibose only absorbs UV in the low wavelength region, it cannot be detected with high sensitivity. So special detection methods are necessary for analysis of Voglibose.Voglibose shown effective results for various analytical instruments only in the combination of Taurine and Sodium periodate. Drug solution was derivatized using Taurine and Sodium periodate in water and methanol. Drug exhibited distinct
λmax in methanol at 282nm. Linearity was observed in the concentration range 10-80 µg/ml. (r2 =
0.997). Amounts of drug estimated from tablet formulation were in good agreement with label claim. The method was validated statistically and by recovery studies. The proposed methods are economical and sensitive for the estimation of voglibose in bulk and tablet dosage forms.
Key words: Voglibose, UV- Spectrophotometry, oral antidiabetic agent, derivatization,
estimation, validation.
______________________________________________________________________________
Introduction
Voglibose 3,4-Dideoxy-4-[2-hydroxy-1-(hydroxyl methyl) ethyl]amino-2-c-(hydroxymethyl)-D-epiinositol, has attracted considerable interests due to its wide range of therapeutic and
pharmacological properties, including its excellent inhibitory activity against α-glucosidase and
351
gastrointestinal tract of humans. The drug delays glucose absorption and thus, reduces the post-prandial blood glucose peaks [1-3]. Voglibose obtained from organic synthesis processes is similar to structurally related carbohydrates found naturally [4, 5] and has the empirical formula
C10H21NO7. Since most carbohydrates lack chromophore and/or flurophore groups, their analysis
by liquid chromatography (LC) often requires derivatization procedures [6]. Since Voglibose
only absorbs UV in the low wavelength region, it cannot be detected with high sensitivity. So special detection methods are necessary for analysis of voglibose. Voglibose shown effective results for various analytical instruments only in the combination of Taurine and Sodium periodate [7]. Drug solution was derivatized using Taurine and Sodium periodate in water and
methanol. Drug exhibited distinct λmax in methanol.
Chemical structure of Voglibose
Analysis is an important component in the formulation development of any drug molecule. A suitable and validated method has to be available for the analysis of drug(s) in the bulk, in drug delivery systems, from release dissolution studies and in biological samples. If a suitable method, for specific need, is not available then it becomes essential to develop a simple, sensitive, accurate, precise, reproducible method for the estimation of drug samples. No Spectrophotometric method for estimation of voglibose in bulk and formulations. Our main concern is development and validation of UV spectrophotometric method as per ICH guidelines. Thus the present study was undertaken to develop and validate a simple, sensitive, accurate, precise and reproducible UV method for voglibose [8].
Materials and Methods
Instrument used were JASCO V-630 double beam UV/Visible Spectrophotometer with matched pair of quartz cell (1.0cm path) was employed for absorption measurements [9-20]. Voglibose pure drug was obtained from Ranbaxy Research Laboratories as gift sample and was used without further purification. All chemicals and reagents used were of analytical grade. Voglibose tablets were purchased from market.
Preparation of standard stock solution
Standard drug solution of Voglibose was prepared by dissolving 10mg Voglibose in 100 ml of methanol to get a concentration of 100 µg/ml. The solution was derivatized with Taurine and Sodium periodate.
OH
OH
N HO
HO HO
OH
352
Selection of solvent
Absorbance of the drug was higher and drug exhibited distinct λmax in methanol and hence
methanol was selected as solvent for further studies.
Selection of wavelength
[image:3.595.92.504.493.688.2]The 10 µ g/ml of standard solution (derivatized) was scanned between 200-400 nm and found that the peak at 282 nm showed maximum absorption.
Figure 1: Selection of wavelength
Preperation of calibration curve
Calibration curve was prepared at λmax 282 nm using JASCO UV- Visible Spectrophotometer.
For this stock solution of 100 µ g/ml was prepared. Serial dilution of Voglibose stock solution
were prepared and scanned in the range range of 200-400 nm. Absorbance was taken at λmax 282
nm against blank. The calibration curve was plotted.
353
Preparation of sample solution
The proposed method was applied to analyte commercially available Voglibose tablet. Thirty tablets, each containing 0.2 mg of Voglibose were weighed and average weight was calculated. Quantity equivalent to 5 mg of Voglibose was weighed, transferred to a 100 ml volumetric flask, extracted and made upto volume with methanol and filtered through whatmann filter paper # 41. From this solution, suitable aliquots were prepared, then these dilutions were derivatized and scanned in UV region and absoprbances were noted at 282 nm and concentration was determined by linear regression equation.
Results and discussion
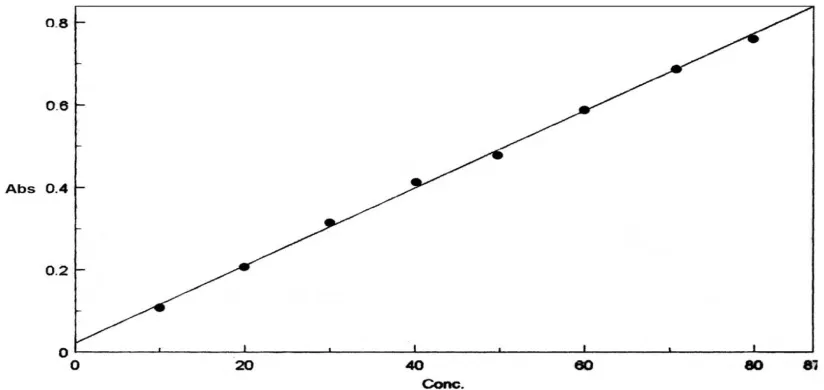
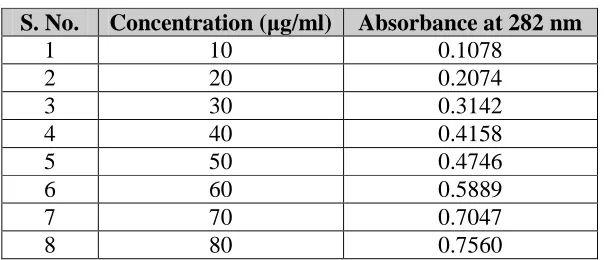
Linearity
The linearity of the response of the drug was verified at 2 to 100 µ g/ml concentrations, but linearity was found to be between 10 -80 µ g/ml concentrations. The calibration graphs were obtained by plotting the absorbances versus the concentration data and were treated by linear regression analysis. The equation of the calibration curve for Voglibose obtained Y = 0.0094x + 0.0226, the calibration curve was found to be linear in the aforementioned concentrations. The
[image:4.595.148.450.384.514.2]correlation coefficient (r2) of determination was 0.9976. (Table 1, 2)
Table 1: Linearity of Voglibose
S. No. Concentration (µg/ml) Absorbance at 282 nm
1 10 0.1078
2 20 0.2074
3 30 0.3142
4 40 0.4158
5 50 0.4746
6 60 0.5889
7 70 0.7047
8 80 0.7560
Table 2: Optical and Regression Characteristics, Precision and Accuracy of the proposed method for Voglibose [21-23]
Parameter voglibose
Absorption maxima 282 nm
Linearity Range (µg/ml) 10-80
Standard regression equation Y = 0.0094x + 0.0226
Correlation Coefficient 0.997
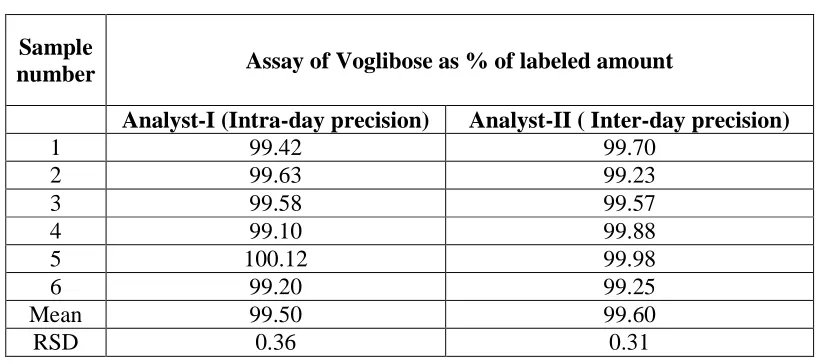
Precision
354
[image:5.595.93.502.166.348.2]laboratory. The relative standard deviation (RSD) and assay values obtained by two analysts were 0.28, 99.67 and 0.26, 99.68 respectively. (Table 3)
Table No.3- Determination of Precision
Sample
number Assay of Voglibose as % of labeled amount
Analyst-I (Intra-day precision) Analyst-II ( Inter-day precision)
1 99.42 99.70
2 99.63 99.23
3 99.58 99.57
4 99.10 99.88
5 100.12 99.98
6 99.20 99.25
Mean 99.50 99.60
RSD 0.36 0.31
Accuracy (Recovery test)[24]
[image:5.595.71.532.600.645.2]Accuracy of the method was studied by recovery experiments. The recovery experiments were performed by adding known amounts of the drug in the placebo. The recovery was performed at two levels, 50 and 100% of Voglibose standard concentration . The recovery samples were prepared in before mentioned procedure. Three samples were prepared for each recovery level. The solutions were then analyzed, and the percentage recoveries were calculated from the calibration curve. The recovery values for Voglibose ranged from 99.7 to 101.5%. The result of analysis the recovery studies presented in table-4&5.
Table 4: Recovery Studies
Level %Recovery %RSD*
50% 99.7 0.2534
100% 101.5 0.3050
* RSD of six observations
Table 5: Analysis of formulation
Drug Amount(mg/ tablet) % label claim %RSD* Labeled Found
Voglibose 0.2 0.194 97 0.1843
* RSD of six observations
355
The proposed method for estimation of Voglibose in pharmaceutical formulation was found to be simple, accurate, economical and rapid. The interference of interfering component was neglected
by selecting the proper λmax for the component of interest.
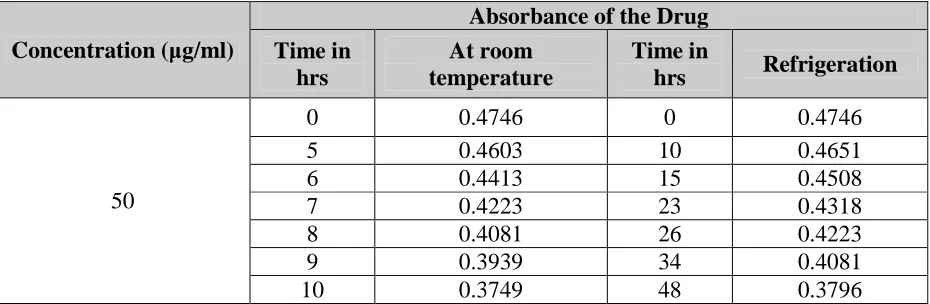
Effect of time on stability of absorbance
[image:6.595.67.532.253.405.2]The stability of the solution was checked by measuring the absorbance at regular intervals of time. It was observed that the absorbance remain stable for 10 hrs at room temperature and 48 hrs at refrigeration. The result of stability studies presented in table-6.
Table 6: Stability Studies
Concentration (µg/ml)
Absorbance of the Drug Time in
hrs
At room temperature
Time in
hrs Refrigeration
50
0 0.4746 0 0.4746
5 0.4603 10 0.4651
6 0.4413 15 0.4508
7 0.4223 23 0.4318
8 0.4081 26 0.4223
9 0.3939 34 0.4081
10 0.3749 48 0.3796
Conclusion
The results conformed the reproducibility, precision and accuracy of the method. The marketed formulations were analyzed by the proposed method and were found that there was no interference with the exicipents incorporated in the tablet formulation as seen from recovery studies. The method described can be used for the estimation of tablet formulations due to simplicity in preparation and cost effective. The results obtained all in close declaration and found to be satisfactory. The method can be adopted for the conformation of Voglibose in bulk as well as for its formulation.
Acknowledgement
I am thankful to Dr. Mahesh D. Burande, Bilcare Research Academy and Mr. Vinod Arora, Vice President, R&D, Ranbaxy for providing samples of drug.
References
[1] Y. Yamasaki, N. Katakami, R. Hayaishi-Okano, M. Matsuhisa, Y. Kajimoto, K. Kosugi, M.
Hori, Diabetes Res. Clin. Pract. 67(2005) 204-210.
[2] K. Watanabe, H. Uchino, C. Ohmura, Y. Tanaka, T. Onuma, R. Kawamori, J. Diabetes
356
[3] A. Vichayanrat, S.Ploybutr, M. Tunlakit, P. Watanakejorn, Diabetes Res. Clin. Pract. 55
(2002) 99-103.
[4] H. Zhang, C.R. Sun, O. Ishurd, Y.J. Pan, L.S. Ding, Carbohydr. Res. 339 (2004) 2027-2030.
[5] X. Chen, Y. Zheng, Y.Shen, Curr. Med. Chem. 13 (2006) 109-116.
[6] I. Rethfeld, G. Blaschke, J. Chromatogr. B 700 (1997) 249-253.
[7] Takehiko Kato, Toshio Kinoshita; Bunseki Kagaku, 35, 869-874 (1996).
[8] Validation of analytical procedures: Methodology (Q2B) Harmonized Tripartite Guidelines.
[9] Sharma. B.K, Instrumental method of chemical analysis, 18th edition, Krishna prakashan
media (P) Ltd., Meerut, 1999, Pp. No. 39-139.
[10]Vogel’s text book of Quantitative chemical analysis, 5th edition, ELBS Longman, London,
1997, Pp. No. 661-672.
[11]Williard, et al., Instrumental methods of Analysis, 6th edition, Pp. No. 77-83.
[12]Analytical Chemistry, Theory and Practice, By U.N.Dash, Pg. No. 42.
[13]Instrumental methods of chemical analysis, By. B.K. Sharma, Pg. No. 74.
[14]Instrumental methods of analysis, 6th edition, By Willard Merritt Dean Settle, Pg. No. 94.
[15]Principles of instrumental analysis, 5th edition, By. Skoog, Holler, Nilman, Pg. No. 144.
[16]Instrumental methods of chemical analysis, By. Chatwal and Anand, Pg. No. 144.
[17]Pharmaceutical drug analysis, 2nd edition, By Ashutosh Kar, Pg. No. 293.
[18]The quantitative analysis of drugs, 3rd edition, By Harold. F. Walton and Jorge Reyes, Pg.
No. 160.
[19]Spectrometric identification of organic compounds, 5th edition, By R.M. Silver Strin, G.
Clayton Bassler, Terence. C.Morill, Pg. No. 289.
[20]Insrumental methods of chemical analysis, By. Gurudeep R. Chatwal, Shem K. Anand, Pg.
No. 2.105.
[21]Quality assurance of pharmaceuticals Vol; 2, Pg.No.16, Berry I.R. and Nash pharmaceutical
process validation-II, Marcel Decker Inc. New York.
[22]Alfonso Genera in Remington’s pharmaceutical series, 18th edition, Mack publishing
company, 1990, Pg. No. 648.
[23]P.D. Seth, Qualitative analysis of drugs and formulations, 4th edition, 1996, Pp. No. 1-19.