ISSN: 1992-8645 www.jatit.org E-ISSN: 1817-3195
502
APPLICATION OF THE BAYES RULE FOR ENHANCING
THE PERFORMANCE OF THE BAGGING ENSEMBLE TO
DETECT ABNORMAL MOVEMENTS ONBOARD AN
AIRCRAFT
1ALI H. ALI
1
Department of Electronic and Communications Engineering, University of Kufa, PO. Box 21, Najaf, Iraq 54001
Email:[email protected]
ABSTRACT
This paper presents a novel approach to the detection of abnormal passangers’ movements onboard an aircraft. Firstly, it uses the simple indicators of the total passengers’ movements along the aisle and in their seats as classification features. Secondly, five machine learning classifiers are studied, namely: decision trees, SVM with Gaussian kernel, bagging ensemble, boosting ensemble and RUSBoost ensemble classifiers. The ROC curve, the confusion matrices and the McNemar tests are shown and conducted. Finally, we propose a method of enhancing the performance of the bagging ensemble using Bayes rule. The bagging ensemble are found to have a classification accuracy of about 65% which was increased by the application of the Bayes rule method to about 89.2%. The performance results of each method is reported and discussed.
Keywords: Machine Learning; Ensemble Classifiers; Aviation Safety; Bayes Rule; Decision Support
System
1.INTRODUCTION
The main theme of this research paper is the implementation of systems that can profile passengers on board. It has been argued that better decisions could be made once the main cues of a situation can be gathered so as to increase the situational awareness of decision-makers about the current state of passengers on-board. This research is part of a bigger research framework that aims at designing real-time threat analysis systems for profiling situations on-board aircraft from both safety and security points of view. More information can be found in [1-6].
The wakeup calls cried by many catastrophic aircraft incidents and terrorist attacks have resulted in many revisions to aviation safety and security procedures. However, most of these procedures were only limited to better training, cockpit door reinforcement and deployments of sky marshals. On the other hand, the European Commission (EC) has proposed a project to prevent on-board threats and ensure safe journey from the moment passengers enter the airport right until they reach their destinations. The project started in 2004 and was codenamed SAFEE (Security of Aircraft in the
Future European Environment)1. Various other projects and frameworks were proposed, for instant, the SVETLANA project2. The main theme of these projects were to develop onboard threat detection and management decision support systems by analyzing flight data and/or deploying sensors onboard to collect key cues about the current situations. Consequently, active response actions can be defined for a given threat level to ensure the smooth continuity of flight and reduce disruption. Since appropriate actions are the result of good comprehension of the key elements that if put together would precisely portray a given situation, it is essential that the right cues are collected from onboard using arrays of sensors, or smart nodes [7], processed efficiently and then summarized in a way as to increase the situational awareness of decision makers.
This paper is concerned with analyzing and classifying human behaviors onboard an aircraft. It assumes that smart sensors are deployed around the passengers’ cabin and that they are capable of summarizing passengers’ movements numerically
1 See SAFEE: Security of Aircraft in the Future European
Environment, (accessed 11/12/2015)
http://ec.europa.eu/research/transport/projects/items/safee_en. htm
2 See SVETLANA, (accessed 11/12/2015)
ISSN: 1992-8645 www.jatit.org E-ISSN: 1817-3195
503 into background movements in their seats and aisle movements. More details about this procedure are described in [1]. Since only ordinary cameras are required to quantify passenger movement patterns into numerical values, the total cost of deploying such sensors are kept to a minimum. In fact, many modern aircrafts already contain CCTV cameras installed around the passengers’ cabin, among other places, resulting in further reduction to installing and operating cost. The essential task of this research effort is: giving the numerical values of the progress of passengers’ background and aisle movements throughout the flight time, what threat score should be associated with the current development of events? The paper will start with a short literature review, following by brief theory discussion of the key machine learning algorithms, and then results are shown and discussed.
2. CROWD BEHAVIOR ANALYSES IN THE
LITERATURE
Machine learning literature is full with numerous approaches and methodologies for dealing with the problem of human behavior modeling, analysis, and recognition. Approaches ranges from expert-rules based, control theory, to classification-based like Support Vector Machine (SVM) and k-Nearest Neighbors (kNN) based. However, little has been done on the analysis of human behavior on-board an aircraft. Human behaviors have been greatly researched in open-areas like parks and airports but, to the best of the authors’ knowledge, not that much on the closed and confined places like an aircraft where movement is greatly limited to relative movements in seats and aisle movements. In this section, approaches to the problem of crowed behavior analysis will be presented from the most generic to the most specific to the area of aviation safety.
Isoda et al. have used the C4.5 algorithm to generate a decision tree that could distinguish the spatiotemporal context of human behavior interacting in a house into appropriate descriptive states. The states were prepared using priori-defined task models [8]. Although it would be of value to investigate the performance of such approach in the aviation safety context because houses are, to an extent, confined places like an aircraft, the C4.5 algorithm lacks boosting which is a method of combining different classifiers together to improve performance and is less memory and CPU efficient than the C5.0 [9, 10]. C4.5 and C5.0 have often been considered solved problem [9] and
left in favor of most recent advances algorithms in machine learning such as CART, random trees and random forests [11-13].
Another approach is to use Hidden Markov Models (HMMs) and Coupled HMMs [14-16] to analyze human behavior recorded by a video feed over an extended amount of time [17]. On the other hand, agent-based approach has been utilized to simulate human decision-making in virtual crowds [18] which is an expert based solution as opposed to the machine learning approaches discussed so far. The approach of [17] has been extended by incorporating levels of Kalman filters sequenced by a dynamic HMM [19]. This approach has been used to recognize and predict drivers’ behaviors over the extent of several seconds. Transfer learning has been used to update a classification model incase new activities have emerged from indoor video surveillance cameras [20]. Weighted block similarity methods have been used to analyze crowd movements in open areas and criteria have been set to detect anomalous behaviors such as running, wall-climbing and falling [21].
All of the approaches discussed so far have focused on recognizing normal human interactions, social activities and/or abnormal agent behavior within a crowd. These methods in both the application and motivation are significantly far from the main objectives of this research paper where only minimum attention has been given. For instant, neuro-fuzzy networks were devised to model passenger behaviors onboard an aircraft [1]. The issue with this approach was that neural networks required huge amount of training sets of data, it lacked generality because human movements are often random to a significant extent, and their CPU and memory requirements are often a concern [22].
ISSN: 1992-8645 www.jatit.org E-ISSN: 1817-3195
504
3.ASSUMPTIONS AND METHODS
The training and testing data used in this research have been acquired using the methods described in [1]. Passengers’ movements were synthetically generated using the Monte Carlo method to incorporate both the deterministic and random components of typical agents acting in response to abnormal events in their environments. Passengers’ movements were categorized into background movements describing movements in the passengers’ seats and to aisle movements denoting movements along the aircraft aisles. Movements are collectively quantified into a scale of (0) to (100) with (0) representing no movements at all and (100) expressing a very high amount of movements. The reason for that is to simplify the interfacing circuitry with a CCTV camera of an aircraft and thereafter, converting it to a scalar of how much relative changes there are between recorded frames. Data were sampled every 5 seconds out of a trip time of 1 hour and 40 minutes. The flight profile has been classified into five states: boarding, taking-off, cruising, landing and stopping. Abnormal passenger movements were randomly injected along the flight time and assumed to have duration of either 60, 300, or 600 seconds. The maximum amounts of abnormalities have been limited to 1σ, 3σ and 6σ, where σ is the standard deviation. Finally, a vector of classification labels has been created which labels the parts where abnormalities were introduced as (1) and (0) otherwise. Figure 1 and 2 shows typical passengers background and aisle movements without the introduction of anomalies.
Although passengers’ activities may seem random at once, they do follow some pattern that correlates with the current flight profile. For example, the movement in the aisle would be
significantly greater during boarding than taking-off. One would also expect the background movement to increase during serving of food and the aisle movement to decrease during the same period. However, the random component of such activities would result in the failure of typical solutions by expert system approach because randomness is too complex to be expressed in if-then rules.
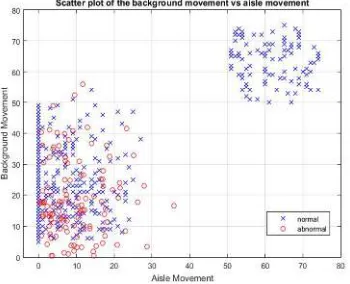
[image:3.612.315.518.397.501.2]Therefore, it is of the essence to seek out a machine learning approach where algorithms can be used to search for structures within large amount of training data. For that end, abnormalities were added to the data samples shown in figure 1 and 2 and labelled abnormal. Figure 3 shows a scatter plot of such abnormal samples with maximum amplitude of 3σ and duration of 600 seconds. Notice the overlapping of the normal samples, marked with cross sign, and abnormal samples, marked with circle sign. Since the normal and abnormal samples aren’t spatially separable by a mere line, typical clustering algorithm would result in a poor performance unless more features are added or by kernel transformation, or other data processing techniques.
Fig. 4. Scatter Plot Of The Background Vs Aisle Movements. Abnormal Samples Are Marked With A
[image:3.612.92.302.525.636.2]Circle Sign. Fig. 1 Amount Of Passenger Movements In Their Seats
[image:3.612.328.503.532.674.2](Background Movements).
ISSN: 1992-8645 www.jatit.org E-ISSN: 1817-3195
[image:4.612.324.514.71.230.2]505
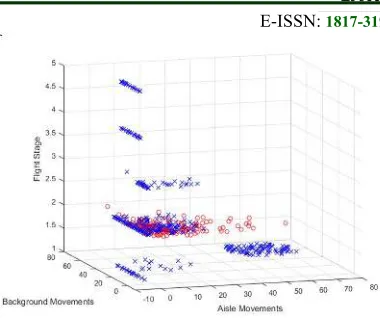
Fig. 5. 3D Scatter Plot Of A Typical Aisle Movement, Background Movement And Flight Stage. Normal Samples Are Shown With Crosses Where Abnormal
Samples Are Drawn With Circles.
A third feature that could be added is the current flight stage (profile). For that end, each flight phase is coded into a numeric of values from 1 to 5. The result of such addition is show in figure 4.
Figure 4 shows that the abnormalities in passenger behavior were recorded during the cruising stage of the flight time. Since the flight stage does not change during the abnormality duration, it wouldn’t result in a significant increase of information to help classify passengers’ behaviors more easily. Nonetheless, it could help with the development of a stage-specific structure that identifies typical behaviors of passengers.
4. BACKGROUND THEORY OF MACHINE
LEARNING
In this section, we will introduce the basic theory behind some of the most popular, and applicable, supervised machine learning algorithms. It will provide common notations for further discussion throughout this research paper. The reader is encouraged to follow the list of references in this section for more details.
Machine learning is the science of learning from data [23]. It uses datasets, often a large amount of, to look for patterns, construct structures or estimate parameters that can model a complex system where expert-based modelling is tedious or time consuming [24]. Supervised machine learning is a subfield of machine learning that search for algorithm that can learn to classify new instances from a large dataset of classification examples [25]. Some of the widely used techniques in this field includes: decision trees, SVMs, ANN, kNN [25] and ensemble classifiers [26]. There are innumerous algorithms and techniques in the field of machine learning. The suitability of an algorithm for a given classification problem is judged based on some performance measures such as the Area Under Curve (AUC), the Root-Mean-Square-Deviation RMSD, confusion matrix...etc. [27]. One procedure to find a suitable classification algorithm is to pre-train as many classification algorithms as practical and then nominate the most promising ones for further tuning. The research described in this paper has gone through that route and therefore we will only introduce some key details about the most promising machine learning algorithms applicable to problem of this study. These are decision trees, SVM, and ensemble classifiers.
A. Decision Trees
Decision trees are types of logical classification algorithms that work by sorting classification instances based on feature values [25]. Each feature is represented with a node which could have multiple branches each with a subset of values that the node feature can assume. Decision trees are attractive because of their comprehensible classification capabilities and ease of use [28]. The three most common algorithms in the decision trees classification techniques are ID3 [29], C4.5 [30] and random forests [31]. Random forest is probably the most accurate predictor of the bunch although it is an ensemble of bagged decision trees trained on various subsets of the training data [32].
The decision tree learner used in this research works by first splitting the training data on a feature that optimizes Gini’s diversity index measure and repeats the process recursively while adding the selected features as children of the previous nodes. More information about the implementation of the decision tree algorithm can be found in [33].
B. Support Vector Machines
ISSN: 1992-8645 www.jatit.org E-ISSN: 1817-3195
506 The standard formulation of SVM is defined as follows: given training dataset like D where:
D and x ∈ T, F , y ∈ 1, 1x ; y where i 1,2,3 … n (1)
The SVM method can be expressed by:
ω x ω!" 1, ∀x ∈ T
ω x ω!$ 1, ∀x ∈ F (2)
Where ω is called the weights vector and ω! the bias [25]. If the data is linearly separable then the optimum separation hyperplane can be found by minimizing ψ&ω where ψ&ω is given by:
ψ&ω 12 |ω|(
),)+ ,* (3)
The selection of the right kernel to transform non-linearly separable data is of the essence because the kernel defines the transformation of the instance to be classified. One way to determine, and also a drawback of SVMs, is to test some potential kernels and benchmark their performance measures. Although many kernels are discussed in the literature, for instance [36], our preliminary test showed the Gaussian kernel to be the most promising transformation method for the research problem of this paper. The mathematical details of the Gaussian kernel can be found in [37].
C. Ensemble Classifiers
Ensemble classifiers or learners work by combining learners which are weak on their own nevertheless become very powerful when combined together. There are many ways to combine individual learners together to create an ensemble learner. For example, the individual learner, called a bag, can be trained on a random subset of the training data with replacement and then the output of each bag could be combined together by taking the mean or majority vote. Such technique is called bagging [38]. Alternatively, each bag is tested on the whole training set and the instances where the bag has misclassified are giving more weights in the training of the next bag and so on. This method is called AdaBoosting [39]. Some algorithms accounts for unbalanced, or skewed, datasets by oversampling the sparse class or undersampling the excessive class. One example of such algorithm is the Random Under Sampling Boosting Ensemble learner more commonly known as RUSBoost [40].
Some research studies have showed that bagging
performs better in the presence of classification noise than Adaboost [41]. When the data is imbalanced, bagging outperforms RUSBoost however, RUSBoost would perform better when the noise level is low [42].
For the research effort of this paper, we are going to compare the performance measures of five classifications algorithms that have shown good classification potential during our preliminary tests. These are: Decision Trees, SVM with Gaussian kernel, Bagging Ensemble, Boosting Ensemble and RUSBoost Ensemble.
5.RESULTS
The main purpose of this research effort has been to classify the behavior of aircraft passengers into normal or abnormal using machine learning. Passengers’ behaviors have been measured by aggregating their movements into two metrics: aisle movements and background movements. Hence, there are three features available for machine learning classifiers to learn from: the two mentioned movements and the current flight stage. Our preliminary tests have shown potential for decision trees, SVM with Gaussian kernel, bagging ensemble, boosting ensemble and RUSBoost ensemble classifiers. MATLAB was used to carry out the calculations throughout this research. In this section, we will report the performance of the chosen classifiers.
ISSN: 1992-8645 www.jatit.org E-ISSN: 1817-3195
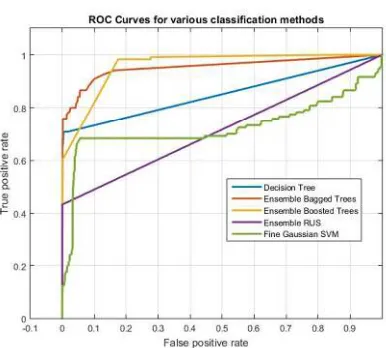
[image:6.612.93.286.110.284.2]507 measures of the five classifiers.
Fig. 6. ROC Of The Five Classifiers Chosen In This Research
Table 1. Area Under Curve (AUC) Of The Five Classifiers In This Study
Unfortunately, ROC and AUC may give us wrong intuition as to which classifier to choose for the problem of this research because it assumes that the cost of misclassifying the abnormal class and the normal class is the same [44] which is clearly not the case. The penalty of classifying abnormal behavior as normal may result in a catastrophic security breach. Therefore, we must look for an alternative measure to either solidify our choices made so far or try another classifier.
One easy way to assess the algorithm power in classifying each class is to construct the confusion matrix of the classifier. Table 2 shows the confusion matrices of the decision trees, SVM with Gaussian kernel, bagging ensemble, boosting ensemble and RUSBoost ensemble classifiers. The confusion matrix would help us assess the prediction value for each class, specifically the true class which represents the instances of anormal passengers’ movements. This is shown in table 2 as the positive prediction value of the model. The positive predication value of the model is the portion of number of true positives out of the total number of the true, i.e. abnormal movement, class. Bagging ensemble and decision tree classifier have the highest positive predication value of 0.633 and
0.658 respectively. In order to evaluate whether the difference between the more complex model, i.e. bagging ensemble, is statistically better than the simpler model, i.e. decision tree, we can use the McNemar mid-p and asymptotic tests.
Let nij be the number of pairs that both models classify correctly and incorrectly. Hence nii is the number of samples that was classified the same way by the two models and nij, where i≠j, is the number of instances that has been classified differently. In addition, the classification rate for the Bagging Ensemble is defined by:
ρ. /(0 // (( (4)
and for the decision tree:
ρ1 /0( // (( (5)
then, we can compare the accuracy of the two models using the following test:
23: ρ. ρ1
20: ρ. 5 ρ1
(6)
Using these basic definitions the asymptotic McNemar test statistics and rejection regions for significance level (α) is given by [45]:
t7 &/0( /(0
(
/0( /(0 (7)
If 1 8(9&:, ; < = where 8(9&:, ; is the >?( cumulative distribution function evaluated at x, then reject H0. Whereas the Mid-p McNemar test statistics and rejection regions for significance-level (α) is given by [45]:
t@ min &&/0(, /(0
If 8.BCDt@ 1; /0( /(0 1,0.5H
0.5I.BCDt@; /0( /(0, 0.5H < =/2, then reject H0.
(8)
where 8.BC&K; /, L and I.BC&K; /, L are the binomial cumulative distribution function and the probability distribution function respectively with sample size n and success probability p evaluated at x. The results of applying the Asymptotic and Mid-p McNemar tests to bagging ensemble and decision tree classifiers are shown in table 3.
Classifier Decision
Trees
Bagging Ensemble
Boosting Ensemble
RUSBoost Ensemble
Gaussian SVM
ISSN: 1992-8645 www.jatit.org E-ISSN: 1817-3195
508
Table 2. Confusion Matrices Of The Five Classification Algorithms Used In The Study
Bagging Ensemble Target
Decision Tree Target
Positive Negative Positive Negative
Model
Positive 76 44
Positive
Predictive
Value
0.633
Model
Positive 79 41
Positive
Predictive
Value
0.658
Negative 1 1080
Negative
Predictive
Value
0.999 Negative 2 1079
Negative
Predictive
Value
0.998
Sensitivity Specificity
Accuracy 0.963
Sensitivity Specificity
Accuracy 0.964
0.987 0.961 0.975 0.963
Boosting
Ensemble
Target
RUSBoost
Ensemble
Target
Positive Negative Positive Negative
Model
Positive 52 68
Positive
Predictive
Value
0.433
Model
Positive 52 68
Positive
Predictive
Value
0.433
Negative 0 1081
Negative
Predictive
Value
1.000 Negative 0 1081
Negative
Predictive
Value
1.000
Sensitivity Specificity Accuracy 0.943
Sensitivity Specificity
Accuracy 0.943
1.000 0.941 1.000 0.941
Gaussian SVM Target
Positive Negative
Model
Positive 59 61
Positive
Predictive
Value
0.492
Negative 36 1045
Negative
Predictive
Value
0.967
Sensitivity Specificity
Accuracy 0.919
ISSN: 1992-8645 www.jatit.org E-ISSN: 1817-3195
509
Table 3. The Mcnemar Test Results
Asymptotic Mid-p
Reject null hypothesis? yes yes
p-value 1.2164×10-08 5.3842×10⁻¹⁰
Classification loss 0.026644 0.026644
Both the asymptotic and Mid-P test results suggest rejecting the null hypothesis that the more complex model, i.e. the bagging ensemble, is statistically as accurate as the simpler model, i.e. the decision tree. This result favors the bagging ensemble over decision tree classifier. The p-value represents the probability that a random test measurement is as extreme as the observed value under the assumption that the null hypothesis is true. The fact that its value is close to zero suggests strong evidence to reject the null hypothesis. In conclusion, the bagging ensemble classification algorithm proved better than the other classifiers. The positive predictive rate has been found to be 0.633 and we proved, using McNemar tests, that it performs better than its closest alternative. However, an accuracy of about 63% is not interesting giving the fact that a random classifier would have an average accuracy of 50%. We will discuss a simple method of increasing the prediction accuracy of the bagging ensemble in the next section.
6. IMPROVING PERFORMANCE USING
BAYESIAN PREDICTOR
Bayes Rule is a one simple way to improve the performance of the bagging ensemble in classifying passengers’ movements. The output of the ensemble classifier is used as a posterior probability to update the belief of how much abnormal a current movement is. The non-normalized posterior probability of an instant like (s) belonging to class (k) is the product of the prior probability and the multivariate normal density with mean µk and standard deviation σk. Hence, the multivariate density function can be written as [46]:
M&K|N 1 √2P|QB|(R
ST0(&UTVW XYWZ[&UTVW\ (9)
where |QB| is the determinant of QB and QBT0 is the inverse matrix. If P(i) represents the prior probability of class (i), then the posterior
probability of observation (x) belonging to class (i) is [46]:
M&N|K M&K|N M&NM&K
M&K ] MDK^N_H MDN_H
_
(10)
[image:8.612.310.527.250.420.2]Applying equation 10 to the bagging ensemble results summarized in table 2, we obtain the improved confusion matrix result shown in table 4.
Table 4. Confusion Matrix Of The Bagging Ensemble When Bayes Rule Is Applied
Bagging Ensemble with Bayes Rule
Target
Positive Negative
Model
Positive 117 3
Positive Predictive
Value
0.975
Negative 127 954
Negative Predictive
Value
0.883
Sensitivity Specificity
Accuracy 0.892
0.480 0.997
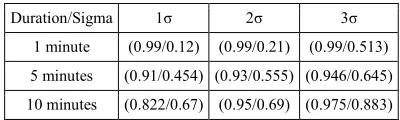
[image:8.612.317.517.628.688.2]Table 4 shows how the positive predictive value has been enhanced from about 63% up to about 97.5%. However, this enhancement has come with the cost of decreasing the negative predictive value to about 88%. Since the cost of misclassifying abnormal movement as normal may result in fatal incidents while the cost of the other way around is only inconvenience, the reduction of the negative predictive value can be considered an accepted loss. Finally, table 5 summarizes the percentage of (PPV/NPV) for 1 to 10 minutes of abnormal activity of value 1σ to 3σ.
Table 5. The Percentage Of (PPV/NPV) For Different Periods Of Abnormal Movements Of One To Three
Standard Diviations
Duration/Sigma 1σ 2σ 3σ
1 minute (0.99/0.12) (0.99/0.21) (0.99/0.513)
5 minutes (0.91/0.454) (0.93/0.555) (0.946/0.645)
10 minutes (0.822/0.67) (0.95/0.69) (0.975/0.883)
ISSN: 1992-8645 www.jatit.org E-ISSN: 1817-3195
510 does not deviate much from the norm. The classifier was successful in detecting abnormal movements up to 0.99 percent accuracy but at the cost of great amount of false negatives. Nonetheless, the most important figure is that of the 3σ because 0.99 percent of the normal values of movements are expected lie within three times the standard deviation value. At 3σ the PPV is as high as 97.5% while the NPV is 88.3%. These figures prove the feasibility of the classifier and its modification in detecting abnormal passenger movements onboard an aircraft.
7.CONCLUSION
The main objective of this paper has been to prove the feasibility of using the relative amount of movement to distinguish normal from abnormal situations onboard a commercial aircraft. We have utilized very simple indictors of passengers’ behaviors consisting of the total amount of movements in the aisles of the aircraft and the total amount of movements in their seats. These indicators can easily be acquired using current technology and they require no special interface circuitry other that CCTV cameras, thereby, simplifying the deployment process.
We used machine learning classifiers to classify the indicators values into two classes: normal and abnormal. Only five classifiers are studied and compared after they have shown some potential classification accuracy during our preliminary tests. These classifiers are: decision trees, SVM with Gaussian kernel, bagging ensemble, boosting ensemble and RUSBoost ensemble classifiers. We proved that the bagging ensemble has the highest performance factors of the lot; however its performance was not high enough. We have proposed using the average score of the individual learner as a belief measure and Bayes rule to come up with a normality confidence figure. This figure showed an accuracy of up to 89.2%.
This research effort has paved the road to the implementation of non-obtrusive airplane passengers’ profilers because it does not require the installation of extra equipment and/or complex algorithms that convert camera feed into abstracts of meaningful human behavior but rather the simple raw amount of movement as recorded by CCTV cameras readily available on-board the aircraft itself. We improved the performance of the standard machine learning classifiers by the addition of the Bayes rule and proved the feasibility
of the algorithm by increasing the PPV from 63% to 97.5%.
REFERENCES
[1] A. H. Ali and A. Tarter, "Developing neuro-fuzzy hybrid networks to aid predicting abnormal behaviours of passengers and equipments inside an airplane," in Proceedings of SPIE, Intelligent Sensing, Situation Management, Impact Assessment, and Cyber-Sensing, Orlando, USA, 2009, pp. 73520G-73520G-10.
[2] A. H. Ali, "Utilizing BADA (Base of Aircraft Data) as an On-Board Navigation Decision Support System in Commercial Aircrafts,"
Intelligent Transportation Systems Magazine, IEEE, vol. 3, pp. 20-25, 2011.
[3] A. H. Ali, G. Markarian, A. Tarter, and R. Kölle, "Feasibility Demonstration of Diagnostic Decision Tree for Validating Aircraft Navigation System Accuracy," Journal of Aircraft, vol. 47, pp. 2096-2102, 2010/11/01 2010.
[4] A. H. Ali, G. Markarian, A. Tarter, and R. Kölle, "Smart on-board diagnostic decision trees for quantitative aviation equipment and safety procedures validation," in Proceedings of SPIE, Cyber Security, Situation Management, and Impact Assessment II; and Visual Analytics for Homeland Defense and Security II, Oorlando, USA, 2010, pp. 77090K-77090K-11.
[5] R. Koelle, G. Markarian, and D. Kolev, "GAMMA-Filling the security management void of SESAR and NextGen," in Integrated Communications, Navigation and Surveillance Conference (ICNS), 2014, 2014, pp. H3-1-H3-9. [6] R. Koelle and W. Strijland, "Semantic driven security assurance for system engineering in SESAR/NextGen," in Integrated Communications, Navigation and Surveillance Conference (ICNS), 2013, 2013, pp. 1-12. [7] R. Kölle and A. Tarter, "Combining and
displaying results from aeronautical Smart Nodes," in Proceedings of SPIE, Intelligent Computing: Theory and Applications VI, Orlando, USA, 2008, pp. 696107-696107-10. [8] Y. Isoda, S. Kurakake, and H. Nakano,
"Ubiquitous sensors based human behavior modeling and recognition using a spatio-temporal representation of user states," in
ISSN: 1992-8645 www.jatit.org E-ISSN: 1817-3195
511 [9] X. Wu, V. Kumar, J. Ross Quinlan, J. Ghosh, Q.
Yang, H. Motoda, et al., "Top 10 algorithms in data mining," Knowledge and Information Systems, vol. 14, pp. 1-37, 2008/01/01 2008. [10] T. Bujlow, T. Riaz, and J. M. Pedersen, "A
method for classification of network traffic based on C5.0 Machine Learning Algorithm," in
Computing, Networking and Communications (ICNC), 2012 International Conference on, 2012, pp. 237-241.
[11] M. N. Anyanwu and S. G. Shiva, "Comparative analysis of serial decision tree classification algorithms," International Journal of Computer Science and Security, vol. 3, pp. 230-240, 2009.
[12] M. Ristin, M. Guillaumin, J. Gall, and L. Van Gool, "Incremental learning of random forests for large-scale image classification," 2015. [13] H. Sahin and A. Subasi, "Classification of the
cardiotocogram data for anticipation of fetal risks using machine learning techniques,"
Applied Soft Computing, vol. 33, pp. 231-238, 2015.
[14] S. Zhong and J. Ghosh, "A new formulation of coupled hidden Markov models," Department of Electrical and Computer Engineering, The University of Texas at Austin, 2001.
[15] M. Brand, N. Oliver, and A. Pentland, "Coupled hidden Markov models for complex action recognition," in Computer Vision and Pattern Recognition, 1997. Proceedings., 1997 IEEE Computer Society Conference on, 1997, pp. 994-999.
[16] S. Han, M. Zhang, P. Li, and J. Yao, "SVM-HMM Based Human Behavior Recognition," in
Human Centered Computing, ed: Springer, 2015, pp. 93-103.
[17] N. M. Oliver, B. Rosario, and A. P. Pentland, "A Bayesian computer vision system for modeling human interactions," Pattern Analysis and Machine Intelligence, IEEE Transactions on, vol. 22, pp. 831-843, 2000.
[18] L. Luo, S. Zhou, W. Cai, M. Y. H. Low, F. Tian, Y. Wang, et al., "Agent-based human behavior modeling for crowd simulation,"
Computer Animation and Virtual Worlds, vol. 19, pp. 271-281, 2008.
[19] A. Pentland and A. Liu, "Modeling and prediction of human behavior," Neural computation, vol. 11, pp. 229-242, 1999. [20] F. Nater, T. Tommasi, H. Grabner, L. Van
Gool, and B. Caputo, "Transferring activities: Updating human behavior analysis," in
Computer Vision Workshops (ICCV
Workshops), 2011 IEEE International Conference on, 2011, pp. 1737-1744.
[21] H. Chen-Chiung and H. Shu-Shuo, "A Simple and Fast Surveillance System for Human Tracking and Behavior Analysis," in Signal-Image Technologies and Internet-Based System, 2007. SITIS '07. Third International IEEE Conference on, 2007, pp. 812-818.
[22] A. H. Ali, "Design and implementation of advanced Bayesian networks with comparative probability," PhD, School of Computing & Communications, University of Lancaster, Lancaster, 2012.
[23] C. M. Bishop, Pattern recognition and machine learning: springer, 2006.
[24] J. G. Carbonell, R. S. Michalski, and T. M. Mitchell, "An overview of machine learning," in
Machine learning, ed: Springer, 1983, pp. 3-23. [25] S. B. Kotsiantis, I. Zaharakis, and P. Pintelas,
"Supervised machine learning: A review of classification techniques," ed, 2007.
[26] R. Meir and G. Rätsch, "An introduction to boosting and leveraging," in Advanced lectures on machine learning, ed: Springer, 2003, pp. 118-183.
[27] N. Japkowicz and M. Shah, Evaluating learning algorithms: a classification perspective: Cambridge University Press, 2011. [28] Y. Kodratoff and R. S. Michalski, Machine
learning: an artificial intelligence approach
vol. 3: Morgan Kaufmann, 2014.
[29] D. H. Fisher and J. C. Schlimmer, "Concept simplification and prediction accuracy," in
Proceedings of the Fifth International Conference on Machine Learning, 2014, pp. 22-28.
[30] J. R. Quinlan, C4. 5: programs for machine learning: Elsevier, 2014.
[31] L. Breiman, "Random forests," Machine learning, vol. 45, pp. 5-32, 2001.
[32] S. Sathyadevan and R. R. Nair, "Comparative Analysis of Decision Tree Algorithms: ID3, C4. 5 and Random Forest," in Computational Intelligence in Data Mining-Volume 1, ed: Springer, 2015, pp. 549-562.
[33] D. Coppersmith, S. J. Hong, and J. R. Hosking, "Partitioning nominal attributes in decision trees," Data Mining and Knowledge Discovery, vol. 3, pp. 197-217, 1999.
ISSN: 1992-8645 www.jatit.org E-ISSN: 1817-3195
512 [35] Y. Ma and G. Guo, Support vector machines
applications: Springer, 2014.
[36] B. Schölkopf and A. J. Smola, Learning with kernels: Support vector machines, regularization, optimization, and beyond: MIT press, 2002.
[37] M. Varewyck and J.-P. Martens, "A practical approach to model selection for support vector machines with a Gaussian kernel," Systems, Man, and Cybernetics, Part B: Cybernetics, IEEE Transactions on, vol. 41, pp. 330-340, 2011.
[38] L. Breiman, "Bagging predictors," Machine learning, vol. 24, pp. 123-140, 1996.
[39] R. E. Schapire, "The boosting approach to machine learning: An overview," in Nonlinear estimation and classification, ed: Springer, 2003, pp. 149-171.
[40] C. Seiffert, T. M. Khoshgoftaar, J. Van Hulse, and A. Napolitano, "RUSBoost: Improving classification performance when training data is skewed," in Pattern Recognition, 2008. ICPR 2008. 19th International Conference on, 2008, pp. 1-4.
[41] T. G. Dietterich, "An experimental comparison of three methods for constructing ensembles of decision trees: Bagging, boosting, and randomization," Machine learning, vol. 40, pp. 139-157, 2000.
[42] T. M. Khoshgoftaar, J. Van Hulse, and A. Napolitano, "Comparing boosting and bagging techniques with noisy and imbalanced data,"
Systems, Man and Cybernetics, Part A: Systems and Humans, IEEE Transactions on, vol. 41, pp. 552-568, 2011.
[43] W. J. Krzanowski and D. J. Hand, ROC curves for continuous data: CRC Press, 2009.
[44] D. J. Hand, "Measuring classifier performance: a coherent alternative to the area under the ROC curve," Machine learning, vol. 77, pp. 103-123, 2009.
[45] A. Agresti and M. Kateri, Categorical data analysis: Springer, 2011.