247
LDT: LOG DECISION TREE TO CLINICAL DATA
CLASSIFICATION
1T. SUREKHA, 2Dr. R. SIVA RAMA PRASAD
1Associate Professor, JNTUK, Department of CSE, India
2Research Director, Acharya Nagarjuna University, India
E-mail: 1[email protected], 2[email protected]
ABSTRACT
The massive recording of the continuous data in the real-time imposes huge burden in analyzing the medical data as it takes huge time for execution and may cause errors due to the data uncertainty and the inability to interpret the highly significant features. As a result, the data is classified according to the rules and the efficiency of the data classification relies on the data feature selection. To address this issue, the paper introduces a new algorithm for the optimal selection of the features that uses a novel parameter for optimally determining the features. The proposed Log Decision Tree (LDT) uses the novel parameter termed as the Log-entropy to retrieve the mutually significant feature from the data such that the future data classification depends on the LDT classification model for determining the disease/condition of the patients, which leads to the easy diagnosis. The Log-entropy function uses the entropy and the weights of the features for computing the importance of the features and based on the selected features, the LDT model is developed. The experimentation proves that the proposed LDT attained a greater value of accuracy, specificity, and sensitivity of 83.7386%, 77.6160%, and 86.4407% respectively.
Keywords:Log-entropy, decision tree, medical data classification, Entropy, feature selection.
1. INTRODUCTION
Clinical data mining is an interesting research area that is a process of extracting the substantial
and indispensable information from the
comprehensive collection of the medical data, which infers the future patterns and possibilities through facilitating the users to enable the knowledge-driven and knowledgeable decisions [12]. The Electronic Health Records (EHRs) hold a tremendous record of the hidden information that is to be explored for enabling the better health care of the patients through uncompromising decisions [14]. The knowledge extraction from the medical records performs the excellent task of establishing disease-specific concept dictionaries that are utilized for the multiple applications mainly, in the recognition of the disease cohorts and in the establishment of the diagnostic models [13] [2]. The diagnostic models enable the physician to determine the root cause of the symptoms through the knowledge and experience acquired by them and hence, enables the effective diagnosis of the disease [15]. However, manual decision is time-consuming and expensive as the root cause of a problem is framed as rules for which an expert is required to interpret the rules in order to identify
the root issue [6]. Thus, the need for an automatic classification method exists to classify the data records based on the feature attributes and provide a better solution for the fast clinical decisions [4].
248 continuous data conveying that the traditional methods of data classification are not applicable on real-time classification [13].
In the existing literature, there are a number of the classification strategies, namely the decision tree classifiers [18], Bayesian classifiers [17], neural networks [19], and case-based reasoning [20]. Among all the available classification methods, the decision trees are used as an effective method of classification in the data mining and the machine learning approaches because of their simplicity, interpretation, computational efficiency, and their tendency to generate understandable classification rules [21] [16]. The decision trees represent the rules underlying data wherein the nodes denote the test on the individual feature and the branch indicate the result of the test with each node denoting the class label leading to easy human
interpretation and facilitates the effective
knowledgeable decisions [5]. Due to their explicit nature, they enable the better understanding about the model and the decision trees presented in the traditional methods are ID3 [24], C4.5 [25], QUEST [22], and GATree [23] that concentrated on the maximization of the classification accuracy and reducing the classification error but the cost of constructing the trees stood a hectic challenge of the tradition decision tree methods [16].
The paper proposes a new algorithm for performing data classification mainly, with the aim of reducing the burden of handling the complex data with a tremendous amount of the valuable information. The importance of the knowledge discovery is to extract the highly important and essential data from the data mass such the extracted knowledge enables the physician to take effective decision in diagnosing the disease through the classified results of the data. The main role is that the physician matches the data of the patient with the already available results to determine the root cause of the problem. The proposed method uses the log-entropy function to determine the best feature and the classification is performed based on the log-entropy function. The proposed LDT is based on the log-entropy calculation of the features for the selection of the features that it enables the optimal selection and optimal splitting precedes the optimal selection of the best feature so as to develop the decision tree.
The contribution of the paper is presented below: LDT algorithm: The main contribution of the paper is the LDT algorithm that is the newly designed algorithm for developing the decision tree.
The parameter used for developing the tree is the Log-entropy that selects the best feature based on the highest value of the log-entropy and the split value based on the log information gain. The optimum split value is essential for developing the perfect decision tree.
The paper is organized as: Section 1 discusses the background and gives a brief introduction to the paper, section 2 presents a motivation of the paper presenting the existing methods of big data classification along with their drawbacks. In section 3, the proposed method of the clinical data classification using the LDT is presented with the algorithmic steps and section 4 presents the results and discussion of the proposed method that highlights the superior performance of the proposed method. Finally, section 5 concludes the paper. 2. MOTIVATION
In this section, let us see the motivation behind the work through the overview of the existing data classification methods that highlights the detailed challenges of the work.
2.1 Related Works
The existing methods of the medical data classification are detailed in the related work section for organizing the various recent approaches and strategies and for detailing their impacts. Narander Kumarn and Sabita Khatri [1] proposed a J48 classifier based on the decision tree for classifying the clinical data for which the specific data attributes are generated. The data attributes are the result of the genetic programming. The data attributes generated using the genetic programming increases the classification accuracy of the method and reduced the error of the classification. The main advantage is that this method reduces the data space and increases the chance of the future predictions. The shortcoming is that the method reduces the power of the performance as the attribute selection is based on the original data.
Liqin Wang et al. [2] proposed a
249 Gorzałczany and Filip Rudzi´nski [3]. The automatic classification system was inspired by the fuzzy rule based classification systems (FRBCSs) and the multi-objective evolutionary optimization algorithms (MOEOAs) that possessed the tendency to generate the number of solutions in a single iteration, which is based on various accuracy levels. Moreover, a complexity-related interpretability measure was employed that solved the semantics-related interpretability issue through the effective fuzzy partitions of attribute domains. The method was advantageous as they offer improved readability, modularity, and it is easy-to-grasp. However, this method cannot be applied for the interpretable medical decision support systems.
Ximeng Liu et al. [4] proposed an alternate
classification method based on Naive Bayes that was mainly developed for preserving the privacy of the patient-centric clinical decision support system and the major role of the method is regarding the secure diagnosis. The method held the tendency to handle the big medical data to train the classifier based on the naive bayes and the classifier provided the classified results for the disease diagnosis with data security as the system is fully encrypted. The shortcoming is regarding the user-friendly environment as it is service provider's asset. Marcin
Czajkowski et al. [5] proposed a method called the
multi-test decision tree (MTDT) for investigating the medical data and to enable the better understanding of the inferring models and decisions. The method enhanced the stability of the classification but the complexity exists in the classification method. Moreover, the incorrect size of the split subsets prevailed that tend to increase the height of the tree. Manjeevan Seera and Chee Peng Lim [6] proposed a intelligent classification system that employed the hybrid model comprising of the Fuzzy Min-Max neural network, the Classification and Regression Tree, and the Random Forest model. The FMM-CART-RF model possessed the ability to learn incrementally from data samples and provide the classification with good accuracy. The main advantage was that the knowledge gained in the previous instances are stored and ensured the stable knowledge while solved the complex learning tasks but the robustness of the method was really poor. Ahmad Taher Azar and Shereen M. El-Metwally [7] presented a decision support tool using the single decision tree (SDT), boosted decision tree (BDT) and decision tree forest (DTF) that serve as an effective method for categorizing the data. Moreover, the earlier discovery of the breast cancer was done enabling the survival period of the patient
but the overall accuracy is found to be less.
Chin-Yuan Fan et al. [8] developed a hybrid
classification model using the case-based data clustering method and a fuzzy decision tree that enabled the detection of the root cause of the disease. The method improved the decision-making process of the doctors but the number of fuzzy terms of the individual feature degrades the
generated rules. Vitaly Schetinin et al. [9] used the
Bayesian decision trees for the classification of the clinical data, which enabled the easy interpretation of the ensemble model and the major advantage is that the method extracted new knowledge of the predictor but they are insensible to the interpretability of deciding the optimal processes. 2.2 Challenges
The challenges of the work are depicted in this section:
Most of the classification methods consumes
more time for classification, which is not applicable for the real-world prediction that should be completed in the short period. Moreover, identification of the misclassified results and the cost of the classification is the major drawback of the exiting classification methods as addressed in [16].
The constraint used for improving the
performance of the classifiers is regarding the simplicity of the decision trees but the trees become complex and impossible to interpret as the trees do not satisfy the constraint [5].
The stored medical data consumed more space
and the important data is hidden within them and without an effective classification method, the data seems to be meaningless and hence, a classification method for transforming the stored data into the most meaningful data is required [4].
The manual process of classifying the medical
data is time-consuming and may cause human errors [15].
The presence of the medical data is described
as inherent heterogeneity, incompleteness, unbalanced and high dimensional nature [14] that most of the existing methods failed to address.
The classifiers other than the decision trees
250
Fuzzy-based decision trees suffer from the
problem that when the number of fuzzy terms of the individual feature is greater, it degrades the generated number of rules [8].
3. A NOVEL LDT ALGORITHM BASED ON THE LOG-ENTROPY
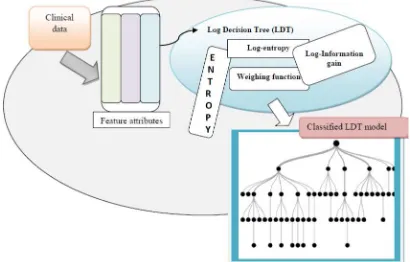
[image:4.612.92.297.511.642.2]Data classification is the need of the current information era mainly, in the field of the medical data mining as most of the existing methods relied on performing the classification with good accuracy and free from errors. The existing methods requires human expert for interpreting the classification rules and therefore, it required much time and lead to misclassification. Due to the misclassification, it is required by the physician to verify the classification results. Due to all these reasons, the paper proposes a new classification strategy based on the feature attributes. The effective classification is enabled based on the selection of the feature attributes and in this paper, the feature selection is carried out using the entropy and the correlation factor. The log-entropy of the attributes is calculated and the decision tree is constructed such that the node represents the test attribute and the branches are the results of the classification. The proposed classification method LDT performs the classification for which initially, the log-entropy of the features are determined for the selection of the best feature and the feature attribute with the maximum value of the log-entropy symbolizes the best feature. Then, the split criterion is performed through the optimal split selection using the log information gain and the tree structure is developed for the entire medical data.
Figure 1. Block diagram of the proposed LDT algorithm for the classification of the medical data
3.1 Imputing the Input Medical Data
The input to the LDT is the medical data that enables the simpler analysis and the efficient knowledge discovery. The medical data is split into subsets as the process of analyzing the medical record as it appears may leads to complexity. In other words, the root node is selected that signifies the highly important feature and the selection is managed by the Log-entropy function. Once the root node is selected, the sub-nodes or the leaf nodes are presented based on the optimal split point selection. Let us consider the medical data, which is
represented as, Dk.
g
k D D D
D 1, 2,..., (1)
where,
g
is the total number of records presentin the medical data. The dimension of the medical data is represented as
pq
. The medical data is presented to the LDT model for generating the appropriate classification through the sufficient data feature selection. The features present on the medical data are given by,
h x
M f f f f
f 1, 2,..., ,... (2)
where, fMis the data attributes of the medical
data and
x
is the total number of attributes presentin the medical data. The attributes may be of type numeric and text including the age, height, and so on. The model generated using the LDT is mainly used for the future reference in classifying the fore-coming data that eases the classification and reduces the time.
3.2 New Definitions
In this section, the newly devised terms are introduced with the brief explanation and presents their importance in performing the classification. 3.2.1 Log Entropy
The log entropy is computed using the logarithmic value of the entropy function [10], which is the product of the entropy of the features and the weights of the feature attributes. The log-entropy of the feature is computed using the following formula,
fn w
fhL (3)
where,
h
f w
log 1
1
2 (4)
Th f U
T T
h P P
f log
1
(5)
where, fh is the feature vector, U
fh is thenumber of unique features in the feature fh. Lis
251 the feature fh ,U
fh is the unique values of thefeature, PTis the probability distribution function of
the features. The weighing function is denoted as
wand
fh is the entropy of the feature attribute.3.2.2 Log Information Gain
The log information gain is essential to determine the information gain of the unique features using the log-entropy and the conditional log-entropy. The log-entropy and the conditional log-entropy are obtained by the integration of the logarithmic term instead of the exponential term, which is the modification of the holo-entropy and the conditional holo-entropy [10]. The importance of the information gain is about the optimal selection of the splitting criterion that picks the optimal splits points from the unique features. Let us consider the information gain is denoted as
fh fj
LIG , and the log-entropy and the
conditional log-entropy are denoted as ,CL
fh , fj
.The log information gain of the feature is determined based on the following formula.
fh fj
L fh CL
fh fj
LIG , , (6)
where, L
fh denotes the log-entropy of the hthfeature and CL
fh , fj
refers to the conditionallog-entropy of the features for which the unique value of the features are interpreted. The probability of
the hth feature present in the medical data is
denoted as, Ph.
h j
h f U
h h j
h f P L f f
f
CL , ,
0
(7)
fh fj
Wl
fh fj
L , . , (8)
h
l f
W
log 1
1
2 (9)
f f
P
f h f h
fh hfj h
h f U
h
j h j
h
, log . , ,
1
(10)
l
W denotes the weights of the features based on
the log-entropy and
fh, fj
denotes the entropy ofthe unique value of the best features. L
fh, fj
denotes the log-entropy of the unique values of the features and the log-entropy of the unique feature depends on the weights of the feature and the entropy of the features.
3.3 The novel LDT algorithm for the clinical data classification
In this section, the discussion of the steps involved in classifying the data using the LDT model is presented. The proposed LDT is the
modification of the HDT presented in [10]. The decision trees are the effective tool in classifying the big data sets because of their simplest computation methods. The classification is carried out using the simple rules that does not need any computation. In general, there are four steps involved in the classification process that includes the feature selection, splitting criterion, stopping criterion, and labeling. The term LDT refers to the Log decision tree that uses the combination of the entropy and the total correlation along with the weight of the features for the selection of the best feature. The total correlation factor determines the relationship between the features of the data and the global disorders of the data, which is determined using the entropy function. Additionally, in order to differentiate the data depending on the label, the probability distribution of the individual feature is determined that is essential for evaluating the log-entropy. At first, the root node is determined and the attributes are arranged based on the log-entropy that forms the branches. Once the best feature is identified, the split criterion is applied, which stands as an optimal split and the optimal split are based on the log entropy information gain.
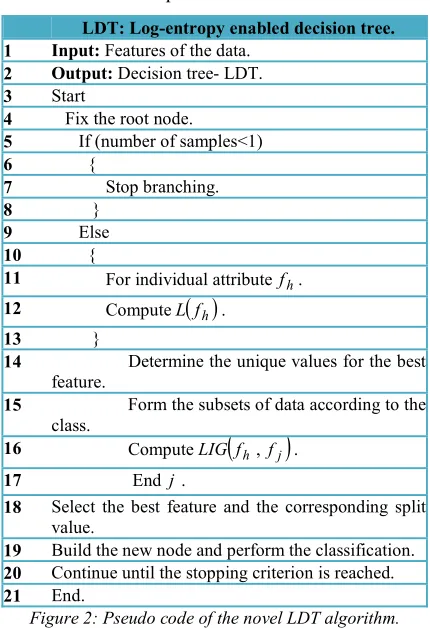
3.3.1 Steps of the proposed LDT algorithm The procedural steps of the proposed LDT are presented below:
Step 1: Feature selection: The feature selection is the basic step engaged in developing the LDT and the feature selection is carried out using the log-entropy. The log-entropy of all the features is determined and the feature that possesses the higher value of the log-entropy is selected as the best feature. The concept of log-entropy is applied to all the feature attributes in the data and the best feature is selected based on the highest value of the log-entropy. The log entropy of the features is determined based on equation (4).
252 with the application of the splitting rule. The process is repeated until the stopping criterion is reached in building the branches of the decision tree.
Step 3: Stopping criterion: The leaf node determines the stopping criterion and when all the data is distributed in the nodes that denotes the termination of the data classification.
Step 4: Leaf node labels based on the class of the data: The label to the node is made based on the class of the maximum number of data. The class of the data is selected based on the class that is common for maximum number of the data present in the classification process.
LDT: Log-entropy enabled decision tree. 1 Input: Features of the data.
2 Output: Decision tree- LDT.
3 Start
4 Fix the root node.
5 If (number of samples<1)
6 {
7 Stop branching.
8 }
9 Else
10 {
11 For individual attributefh.
12 ComputeL
fh .13 }
14 Determine the unique values for the best feature.
15 Form the subsets of data according to the class.
16 ComputeLIG
fh , fj
.17 End j.
18 Select the best feature and the corresponding split value.
19 Build the new node and perform the classification.
20 Continue until the stopping criterion is reached.
[image:6.612.87.302.265.579.2]21 End.
Figure 2: Pseudo code of the novel LDT algorithm.
Figure 2 shows the pseudo code for the proposed LDT algorithm that aims at the optimal classification of the medical data based on the features. The medical data classification is based on the log-entropy of the attributes present in the data that aligns the root nodes based on their log-entropies. The data classification model developed is used for the future reference model for classifying the medical data that reduces the time and provides perfect diagnosis to the patient based on the symptoms.
4. RESULTS AND DISCUSSION
In this section, the results and discussion is presented to prove the importance of the proposed LDT when compared with the existing methods and the superiority is proved based on the performance metrics, namely sensitivity, specificity, and accuracy.
4.1 Experimental setup
The experimentation is carried out using three medical datasets such as, Cleveland, Switzerland and Breast Cancer data available in the UCI
machine learning repository [11]. The
experimentation is performed in Windows 8, 4GB RAM and the implementation is carried out in JAVA programming with map reduce libraries. 4.2 Evaluation metrics
The performance of the proposed LDT classifier will be analyzed using sensitivity, specificity and accuracy.
4.2.1 Sensitivity
Sensitivity is the proportionality existing between the false negative and the true positive.
TP FN y
Sensitivit
1 1
4.2.2 Specificity
Specificity denotes the proportionality between the false positive and the true negative.
TN FP y
Sensitivit
1 1
4.2.3 Accuracy
Accuracy shows the proportionality between the false positives and the true positives.
TP FP Accuracy
1 1
4.3 Methods taken for comparison
The proposed LDT classifier will be compared with the existing algorithms to prove the performance improvement of the proposed algorithm. The methods taken for comparison include: DT, HDT, ANN, and the proposed LDT 4.4 Comparative Analysis
This section displays a deep insight over the comparative analysis of the proposed LDT with the existing algorithms in order to prove the superiority of the proposed method.
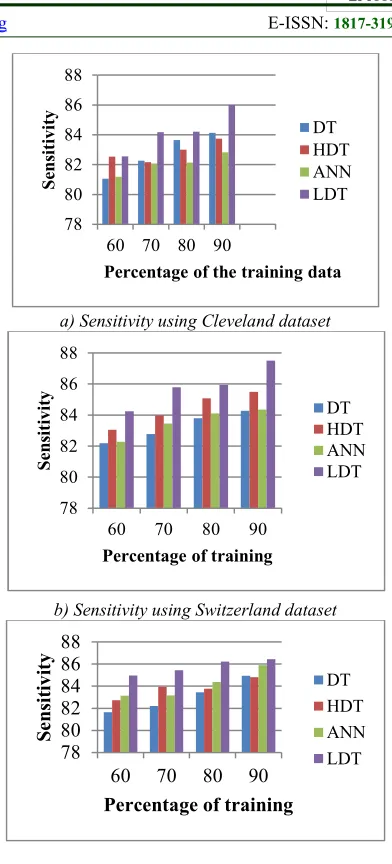
253 Figure 3 shows the comparative analysis of sensitivity based on the three datasets, such as Cleveland dataset, Switzerland dataset, and Breast Cancer dataset. Figure 3 a) shows the analysis of the sensitivity using the Cleveland dataset that provides the clear view of the sensitivity for all the comparative method including the proposed LDT. The sensitivity is analyzed for the various percentages of the training data. When the training percentage is 60, the percentage of sensitivity obtained using the methods DT, HDT, ANN, and LDT are 81.0514, 82.5269, 81.1808, and 82.5432
respectively. Similarly, when the training
percentage is 80, the sensitivity obtained is 83.64%, 83.006%, 82.1262%, and 84.2071 respectively for the methods DT, HDT, ANN, and LDT proving that the sensitivity of the proposed LDT method is superior over the other methods.
Figure 3 b) shows the analysis of the sensitivity using the Switzerland dataset that provides the clear view of the sensitivity for all the comparative method including the proposed LDT. The sensitivity is analyzed for the various percentages of the training data. When the training percentage is 60, the percentage of sensitivity obtained using the methods DT, HDT, ANN, and LDT are
82.1831, 83.0521, 82.2881, and 84.2432
respectively. Similarly, when the training
percentage is 90, the sensitivity obtained is 84.2781%, 85.5025%, 84.3542%, and 87.5149% respectively for the methods DT, HDT, ANN, and LDT proving that the sensitivity of the proposed LDT method is superior over the other methods.
Figure 3 c) shows the analysis of the sensitivity using the Breast cancer dataset that provides the clear view of the sensitivity for all the comparative method including the proposed LDT. The sensitivity is analyzed for the various percentages of the training data. When the training percentage is 70, the percentage of sensitivity obtained using the methods DT, HDT, ANN, and LDT are
83.1996, 83.9377, 83.1596, and 85.4474
respectively. Similarly, when the training
percentage is 90, the sensitivity obtained is 84.9361%, 84.8221%, 85.8965%, and 86.4407% respectively for the methods DT, HDT, ANN, and LDT proving that the sensitivity of the proposed LDT method is superior over the other methods.
a) Sensitivity using Cleveland dataset
b) Sensitivity using Switzerland dataset
c) Accuracy using Cleveland dataset Figure 3. Analysis of Sensitivity using the Cleveland,
Switzerland, and Breast Cancer dataset
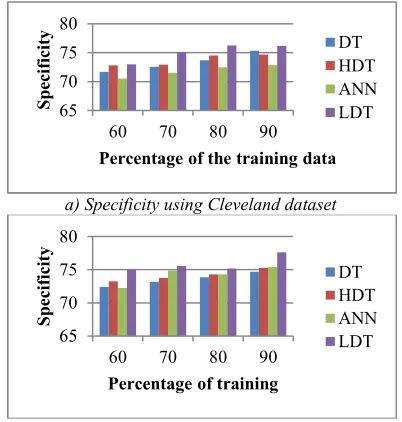
4.4.2 Comparison using Specificity
Figure 4 shows the comparative analysis of specificity based on the three datasets, such as Cleveland dataset, Switzerland dataset, and Breast Cancer dataset. Figure 4 a) shows the analysis of the specificity using the Cleveland dataset that provides the clear view of the specificity for all the comparative method including the proposed LDT. The specificity is analyzed for the various percentages of the training data. When the training percentage is 60, the percentage of specificity obtained using the methods DT, HDT, ANN, and LDT are 71.7003, 72.8024, 70.5165, and 72.9647
respectively. Similarly, when the training
percentage is 90, the specificity obtained is 75.3563%, 74.6806%, 72.8435%, and 76.1681
78 80 82 84 86 88
60 70 80 90
S
en
si
ti
vi
ty
Percentage of the training data
DT HDT ANN LDT
78 80 82 84 86 88
60 70 80 90
S
en
si
ti
vi
ty
Percentage of training
DT HDT ANN LDT
78 80 82 84 86 88
60 70 80 90
Se
ns
it
iv
it
y
[image:7.612.320.516.67.499.2]254 respectively for the methods DT, HDT, ANN, and LDT proving that the specificity of the proposed LDT method is superior over the other methods.
Figure 4 b) shows the analysis of the specificity using the Switzerland dataset that provides the clear view of the specificity for all the comparative method including the proposed LDT. The specificity is analyzed for the various percentages of the training data. When the training percentage is 60, the percentage of specificity obtained using the methods DT, HDT, ANN, and LDT are
72.4040, 73.2521, 72.2102, and 75.0223
respectively. Similarly, when the training
percentage is 90, the specificity obtained is 74.7041%, 75.2635%, 75.4182%, and 77.6160% respectively for the methods DT, HDT, ANN, and LDT proving that the specificity of the proposed LDT method is superior over the other methods.
Figure 4 c) shows the analysis of the specificity using the Breast cancer dataset that provides the clear view of the specificity for all the comparative method including the proposed LDT. The specificity is analyzed for the various percentages of the training data. When the training percentage is 70, the percentage of specificity obtained using the methods DT, HDT, ANN, and LDT are
72.6484, 74.9732, 72.0358, and 74.7642
respectively. Similarly, when the training
percentage is 90, the specificity obtained is 74.9145%, 75.6826%, 74.9238%, and 76.2249% respectively for the methods DT, HDT, ANN, and LDT proving that the specificity of the proposed LDT method is superior over the other methods.
a) Specificity using Cleveland dataset
b) Specificity using Switzerland dataset
[image:8.612.320.522.70.207.2]c) Specificity using Breast cancer dataset Figure 4. Analysis of Specificity using the Cleveland,
Switzerland, and Breast Cancer dataset
4.4.3 Comparison using Accuracy
Figure 5 shows the comparative analysis of accuracy based on the three datasets, such as Cleveland dataset, Switzerland dataset, and Breast Cancer dataset. Figure 4 a) shows the analysis of the accuracy using the Cleveland dataset that provides the clear view of the accuracy for all the comparative method including the proposed LDT. The accuracy is analyzed for the various percentages of the training data. When the training percentage is 60, the percentage of accuracy obtained using the methods DT, HDT, ANN, and LDT are 75.7748, 78.6552, 76.1325, and 77.5907
respectively. Similarly, when the training
percentage is 90, the accuracy obtained is 78.8941%, 80.1012%, 78.2337%, and 80.5467% respectively for the methods DT, HDT, ANN, and LDT proving that the accuracy of the proposed LDT method is superior over the other methods.
Figure 5 b) shows the analysis of the accuracy using the Switzerland dataset that provides the clear view of the accuracy for all the comparative method including the proposed LDT. The accuracy is analyzed for the various percentages of the training data. When the training percentage is 60, the percentage of accuracy obtained using the methods DT, HDT, ANN, and LDT are 78.0957, 78.3422, 77.1498, and 79.8781 respectively. Similarly, when the training percentage is 90, the accuracy obtained is 81.8758%, 81.1618%, 81.2522%, and 83.7386% respectively for the methods DT, HDT, ANN, and LDT proving that the accuracy of the proposed LDT method is superior over the other methods.
Figure 5 c) shows the analysis of the accuracy using the Breast cancer dataset that provides the clear view of the accuracy for all the comparative method including the proposed LDT. The accuracy is analyzed for the various percentages of the training data. When the training percentage is 70, the percentage of accuracy obtained using the 65
70 75 80
60 70 80 90
S
pe
ci
fi
ci
ty
Percentage of the training data
DT HDT ANN LDT
65 70 75 80
60 70 80 90
S
pe
ci
fi
ci
ty
Percentage of training
DT HDT ANN LDT
68 70 72 74 76 78
60 70 80 90
S
pe
ci
fi
ci
ty
Percentage of training
[image:8.612.93.294.497.708.2]255 methods DT, HDT, ANN, and LDT are 77.8653, 80.1743, 77.7172, and 82.2785 respectively. Similarly, when the training percentage is 90, the accuracy obtained is 81.20004%, 80.0290%, 80.9542%, and 82.9046% respectively for the methods DT, HDT, ANN, and LDT proving that the accuracy of the proposed LDT method is superior over the other methods.
a) Accuracy using Cleveland dataset
b) Accuracy using Switzerland dataset
[image:9.612.97.293.202.587.2]c) Accuracy using Breast Cancer dataset Figure 5. Analysis of Accuracy using the Cleveland,
Switzerland, and Breast Cancer dataset
4.5 Discussion of the comparative methods The comparative discussion of the proposed method is provided in this section and the table shows the discussion of the performance metrics. For the analysis, three datasets are utilized and the comparative methods are compared in terms of the metrics, such as accuracy, specificity, and sensitivity. The accuracy values convey that the
proposed LDT possess a greater percentage when compared with DT, HDT, and ANN. BY using the first dataset, the Cleveland dataset, the table highlights the percentages of accuracy, specificity, and sensitivity. The accuracy is 80.6286% for the proposed LDT whereas for the existing DT, HDT, and ANN, the accuracy percentages are 78.8941, 80.1012, and 77.1363 respectively. Similarly, the specificity and the sensitivity analysis are carried out that shows the better performance for the proposed LDT, which attained 76.2773% and 85.9881% respectively. The existing methods DT, HDT, and ANN attained a sensitivity of 84.1289, 83.7367, and 82.8298 percentages respectively that is very low compared with the proposed LDT. Likewise, the specificity of the existing methods DT, HDT, and ANN are 73.6708, 74.6806, and 72.8435 respectively. The comparison using the Switzerland dataset in terms of the performance metrics show the proposed LDT is superior over the other existing methods and the proposed method achieved an accuracy of 83.7386%, sensitivity of 87.5149, and specificity of 77.6160 respectively that is greater than the other existing methods. The breast cancer dataset analyzed to prove the effectiveness of the proposed method yields a greater percentage of accuracy at 82.9046, sensitivity of 86.4407, and specificity of 76.2249 respectively. Thus, the effectiveness of the proposed LDT is proved and clearly highlighted in the comparison table.
Table 1. Comparative discussion based on the performance metrics
Datasets Metrics (%)
Classification Methods
DT HDT ANN Proposed LDT
Cleveland dataset
Accuracy 78.8941 80.1012 77.136380.6286
Sensitivity 84.1289 83.7367 82.829885.9881
Specificity 73.6708 74.6806 72.8435 76.2773
Switzerland dataset
Accuracy 81.8758 81.1618 81.252283.7386
Sensitivity 84.2781 85.5025 84.354287.5149
Specificity 74.7041 75.2635 75.4182 77.6160
Breast Cancer dataset
Accuracy 81.2004 80.8543 80.954282.9046
Sensitivity 84.9361 84.8221 85.896586.4407
Specificity 74.9145 76.0924 74.9238 76.2249
5. CONCLUSION
The paper presents the novel classification model termed as the LDT that employs the log-entropy function to select the best feature. The best feature is the highly significant feature that enables the accurate and the effective classification of the 72
74 76 78 80 82
60 70 80 90
A
cc
ur
ac
y
Percentage of training data
DT HDT ANN LDT
72 74 76 78 80 82 84 86
60 70 80 90
A
cc
ur
ac
y
Percentage of training
DT HDT ANN LDT
72 74 76 78 80 82 84
60 70 80 90
A
cc
ur
ac
y
Percentage of training
[image:9.612.311.522.464.646.2]256 medical data facilitating the faster and efficient generation of the disease vocabulary leading to the sooner diagnosis of the patient. The proposed LDT uses the log-entropy, which is the integration of the weights of the features and the entropy of the features. The LDT develops the classification models that could be inferred for performing the data classification in future based on the disease vocabularies that carry the symptoms and the corresponding diseases. The experimentation of the proposed method is performed to prove the superiority of the proposed method when compared with the existing methods like the DT, HDT, and ANN. The proposed method LDT offers better classification accuracy when compared with the existing methods and the accuracy percentage is 83.7386, sensitivity is 86.4407%, and specificity is 77.6160% respectively. The proposed LDT is highly applicable for extracting the disease specifications from the medical data.
REFERENCES
[1] Narander Kumar and Sabita Khatri, “Optimizing Decision Tree through Attributes Generation Using Genetic Programming for Clinical Data ", Indian Journal of Science and Technology, vol.10, no.22, June 2017.
[2] Liqin Wang, Peter J. Haug, Guilherme Del Fiol, " Using classification models for the generation
of disease-specific medications from
biomedical literature and clinical data repository", Journal of Biomedical Informatics, vol.69, pp.259-266, May 2017.
[3] Marian B.Gorzalczany and FilipRudzinski, " Interpretable and accurate medical data classification – a multi-objective genetic-fuzzy optimization approach", Expert Systems with Applications, vol.71, pp.26-39, 1 April 2017. [4] Ximeng Liu, Rongxing Lu, Jianfeng Ma, Le
Chen, Baodong Qin, "Privacy-Preserving Patient-Centric Clinical Decision Support System on Naïve Bayesian Classification", IEEE Journal of Biomedical and Health Informatics, vol.20, no.2, pp.655 - 668, 2016. [5] Marcin Czajkowskia, Marek Grzesb, and Marek
Kretowskia , "Multi-test decision tree and its application to microarray data classification", Artificial Intelligence in Medicine, vol.61, no.1, pp.35-44, May 2014.
[6] Manjeevan Seera and Chee PengLim, " A hybrid intelligent system for medical data
classification ", Expert Systems with
Applications, vol.41, no.5, pp.2239-2249, April 2014.
[7] Ahmad Taher Azar and Shereen M. El-Metwally, " Decision tree classifiers for
automated medical diagnosis", Neural
Computing and Applications, vol.23, no.7–8, pp.2387–2403, December 2013.
[8] Chin-YuanFana, Pei-ChannChang, Jyun-JieLinb, and J.C.Hsieh, "A hybrid model combining case-based reasoning and fuzzy decision tree for medical data classification", Applied Soft Computing, vol.11, no.1, pp.632-644, January 2011.
[9] Vitaly Schetinin, Jonathan E. Fieldsend, Derek Partridge, Timothy J. Coats, Wojtek J. Krzanowski, Richard M. Everson, Trevor C. Bailey, and Adolfo Hernandez, “ Confident Interpretation of Bayesian Decision Tree Ensembles for Clinical Applications”, IEEE Transactions on Information Technology in Biomedicine, vol. 11, no.3, pp.312 – 319, 2007.
[10] Vijay Mahadeo Mane and D.V. Jadhav, "
Holoentropy enabled-decision tree for
automatic classification of diabetic retinopathy using retinal fundus images", Biomedical Engineering-Biomedical Technology, 2016. [11] UCI machine learning repository dataset -
https://archive.ics.uci.edu/ml/datasets.html. [12] Shomona Gracia Jacob and R. Geetha Ramani,
" Mining of classification patterns in clinical data through data mining algorithms", In Proceedings of the International Conference on Advances in Computing, Communications and Informatics, pp.997-1003, August 2012. [13] Haug PJ, Ferraro JP, Holmen J, Wu X, Mynam
K, Ebert M, Dean N, Jones J., " An ontology driven diagnostic modeling system", Journal of the American Medical Informatics Association, 2013.
[14] Shamsul Huda, John Yearwood, Herbert F. Jelinek, Mohammad Mehedi Hassan, Giancarlo Fortino, and Michael Buckland, "A hybrid feature selection with ensemble classification for imbalanced healthcare data: A case study for brain tumor diagnosis", IEEE Access, Vol. 4, pp. 9145 - 9154, 2017.
[15] Sina Khanmohammadia and Chun-An Choua,
"A Gaussian Mixture Model Based
Discretization Algorithm for Associative Classification of Medical Data", Expert Systems with Applications, vol. 58, pp. 119– 129, 1 October 2016.
257 induction", Information Sciences, vol.354, pp.140-152, 1 August 2016.
[17] J. Han, M. Kamber, J. Pei, D. Mining, Concepts and Techniques, third edition, San Diego, 2011.
[18] D. Liu, S. Fan, “A modified decision tree algorithm based on genetic algorithm for mobile user classification problem”, The Science World Journal, pp.11, 2014.
[19] K. Sethi, A.K. Jain, Artificial Neural Networks and Statistical Pattern Recognition: Old and New Connections, Elsevier, 2014.
[20] McSherry, ‘An algorithm for conversational case-based reasoning in classification tasks”, Lecture Notes Computer Science, pp.289–304, 2014.
[21] A. Arnt, S. Zilberstein, “Learning policies for sequential time and cost sensitive classification ”, In Proceedings of the First International Workshop on Utility-based Data Mining, pp. 39–45, 2005.
[22] W.Y. Loh, Y.S.Shih , “Split selection methods for classification trees“, Statistica Sinica, vol.7, no.4, pp.815–840, 1997.
[23] A. Papagelis, D. Kalles, “GATree: genetically evolved decision trees”, In Proceedings of the Twelfth IEEE International Conference on Tools with Artificial Intelligence (ICTAI’00), pp. 203–206, 2000.
[24] J.R. Quinlan, Induction of decision trees, Machine Learning, vol.1, no.1pp.81–106, 1986.