Public Health Theses School of Public Health
8-11-2015
Postpartum Contraception and Rapid Repeat
Pregnancies in Rural, Low-Income Black Women
with Baseline Risk Factor Comparisons
Karen Li
Follow this and additional works at:https://scholarworks.gsu.edu/iph_theses
This Thesis is brought to you for free and open access by the School of Public Health at ScholarWorks @ Georgia State University. It has been accepted for inclusion in Public Health Theses by an authorized administrator of ScholarWorks @ Georgia State University. For more information, please contact [email protected].
Recommended Citation
Li, Karen, "Postpartum Contraception and Rapid Repeat Pregnancies in Rural, Low-Income Black Women with Baseline Risk Factor Comparisons." Thesis, Georgia State University, 2015.
7-27-2015
Postpartum Contraception and Rapid
Repeat Pregnancies in Rural, Low-Income
Black Women with Baseline Risk Factor
Comparisons
KAREN LI
ABSTRACT
POSTPARTUM CONTRACEPTION AND RAPID REPEAT PREGNANCIES IN RURAL, LOW-INCOME BLACK WOMEN WITH BASELINE RISK FACTOR COMPARISONS
By
KAREN LI
July 27, 2015
INTRODUCTION: The residents in the Low Country region of South Carolina consist of a predominantly low-income, African American population with a history of trauma and
experiences of racism. Chronic conditions, unintended pregnancies, and adverse birth outcomes are prevalent. Many women experience rapid repeat pregnancies (RRP) due to lack of access to choices in contraceptive methods or lack of education on the dangers of RRP and prevention through contraception. Low Country Healthy Start (LCHS) aims to ensure that perinatal women and adolescents in the service area who enrolled received adequate prenatal and postpartum care, educational and counseling services, and contraceptive methods, including a Depo Provera injection at discharge (D1) after their index birth in LCHS. Previous research agree that black women, adolescents, low education, mental health, and past trauma are all associated with RRP, and lack adolescents are less likely to retain a form of contraception that requires maintenance and proper usage.
AIM: To (1) examine the effect of D1 and other variables on time to RRP; and to (2) examine the effect of receiving various forms of contraception and their use over time, including the Depo injection (D2) on time to RRP.
METHODS: Clients included in the analysis either delivered a baby while enrolled in LCHS or had complete data on all necessary variables (n=761). The Cox regression model was fitted to model the effect of receiving different contraceptive methods as well as relevant and statistically significant (α=0.05) risk factors on time to RRP.
For Aim 2, D2 resulted in a lower hazard rate than non-D2 (unadjusted HR = 0.17, 95% CI: 0.09-0.32; adjusted HR = 0.16, 95% CI: 0.08-0.31). Adjusting all variables in Aim 2, including D2, D1 resulted in a statistically insignificant lower HR of 0.88 (p = 0.544, 95% CI: 0.57-1.34). There was no significant interaction between D1and D2 or between D1 and any other
contraceptive type. LARC showed a highly protective but not statistically significant effect against RRP (adjusted HR = 0.05, p = 0.093, 95% CI: 0.002-2.26), but that protective effect decreased multiplicatively by about .25 with each passing month (HR = 1.25, p = 0.029, 95% CI: 1.02-1.53).
POSTPARTUM CONTRACEPTION AND RAPID REPEAT PREGNANCIES IN RURAL, LOW-INCOME BLACK WOMEN WITH BASELINE RISK FACTOR COMPARISONS
by
Karen J. LI
B.A., GEORGIA INSTITUTE OF TECHNOLOGY
A Thesis Submitted to the Graduate Faculty
of Georgia State University in Partial Fulfillment
of the
Requirements for the Degree
MASTER OF PUBLIC HEALTH
ATLANTA, GEORGIA
APPROVAL PAGE
POSTPARTUM CONTRACEPTION AND RAPID REPEAT PREGNANCIES IN RURAL, LOW-INCOME BLACK WOMEN WITH BASELINE RISK FACTOR COMPARISONS
by
Karen J. Li
Approved:
Katherine Masyn
Committee Chair
Huey Chen
Committee Member
July 27, 2015
Acknowledgments
I would like to thank my committee members Dr. Katherine Masyn and Dr. Huey Chen for all of their invaluable guidance and support through the process of completing my thesis. I also extend my gratitude to the faculty and administration in the School of Public Health faculty and Georgia State University.
I would like to acknowledge special thanks to Dr. Huey Chen, the Department of Public Health at Mercer University, and Low Country Healthy Start for providing the materials and data that made this thesis possible. The opportunities that they have provided to me add immensely to my experience and toward my future career.
Author’s Statement Page
In presenting this thesis as a partial fulfillment of the requirements for an advanced degree from Georgia State University, I agree that the Library of the University shall make it available for inspection and circulation in accordance with its regulations governing materials of this type. I agree that permission to quote from, to copy from, or to publish this thesis may be granted by the author or, in his/her absence, by the professor under whose direction it was written, or in his/her absence, by the Associate Dean, School of Public Health. Such quoting, copying, or publishing must be solely for scholarly purposes and will not involve potential financial gain. It is understood that any copying from or publication of this dissertation which involves potential financial gain will not be allowed without written permission of the author.
Karen Li
Table of Contents
List of Tables ... 8
List of Figures ... 9
Introduction ... 10
1.1 Background ... 10
1.2 Purpose ... 11
Literature Review... 12
2.1 Characteristics That Lead to Short Inter-pregnancy Intervals (IPI) ... 13
2.2 Postpartum Contraceptive Methods ... 15
2.3 Postpartum Contraception Use and Rapid Repeat Pregnancies ... 17
2.4 Interventions against RRP ... 19
2.5 Summary ... 20
Methods... 21
3.1 Study Population ... 21
3.2 Low Country Healthy Start Program Strategy and Data Collection ... 21
3.3 Measures... 23
3.4 Analysis ... 27
Results ... 29
5.1 Descriptive Statistics ... 29
5.2 Model Building and Diagnostics ... 33
5.3 Model Interpretation ... 43
Discussion and Conclusion ... 48
6.1 Depo Injection at Discharge and Depo Injections over Time ... 48
6.2 Long-Acting Reversible Contraceptives ... 49
6.3 Maintenance and Barrier Contraceptive Methods ... 50
6.4 Psychosocial Factors of RRP ... 50
6.5 Age as a Predictor of Rapid Repeat Pregnancy... 51
6.6 Conclusion ... 51
List of Tables
Table 1: Descriptive Statistics for Demographic Variables ... 31
Table 2: Descriptive Statistics for Pregnancy-Related Variables ... 32
Table 3: Difference in K-M Estimated Survival Rates for the Study Population ... 34
Table 4: Cox Proportional Hazards Model Fitting for Aim 1 ... 41
Table 5: Cox Proportional Hazards Model Fitting for Aim 2 ... 42
Table 6: Survival Rates over Time for Aim 1 Adjusted Model ... 45
List of Figures
Figure 1: Kaplan-Meier Survival Curves for Depo Injection at Discharge, Final Sample ... 34
Figure 2: Hazard Function for Depo at Discharge, Unadjusted, Final Sample ... 35
Figure 3: Martingale Residuals for Postpartum Depression Score (left) and Age (right) ... 37
Figure 4: Schoenfeld Residuals for Depo Injection at Discharge (left) and Unplanned Index Pregnancy (right) ... 37
Figure 5: Difference in Sample Log Cumulative Hazard Functions, Final Sample ... 38
Figure 6: Cumulative Hazard Plot for Depo injection at discharge in Aim 1 ... 38
Figure 7: Cumulative Hazard Plot for Depo Injections over Time in Aim 2 ... 40
Introduction
1.1 Background
Rapid repeat pregnancies (RRP), defined by medical and social science journals as
subsequent pregnancies in which the time period from birth of the index child to next conception,
or the inter-pregnancy interval (IPI), are either less than 24 months (Barnet et al., 2009;
Crittenden et al., 2009; Damle et al., 2015; L Patchen et al., 2009; L Patchen et al., 2009; Raneri
& Wiemann, 2007), 18 months (Gemmill & Lindberg, 2013; Gillmore et al., 1997; Waggoner et
al., 2012), 12 months (Bennett et al., 2006; Templeman et al., 2000; Tocce et al., 2012), or
sometimes 6 months (Patchen & Lanzi, 2013). They are a major public health issue, especially
for populations that have a high rate of poverty, low education, chronic conditions, and
adolescent pregnancy. Adolescent pregnancy presents an enormous responsibility that the girl
and her family cannot afford, disrupts her educational path, and pulls her even deeper into a life
in poverty. Lack of knowledge or access to effective prevention methods and other personal
obstacles or influences perpetuate perceptions and behaviors, putting girls and women at higher
risk of a shorter IPI (Bennett et al., 2006; Crittenden et al., 2009; Gemmill & Lindberg, 2013;
Gillmore et al., 1997; R. Gold et al., 2004; James-Hawkins & Sennott, 2015; L Patchen et al.,
2009; Patchen & Lanzi, 2013; Raneri & Wiemann, 2007). After delivery, for example, a woman
who resumes intercourse, while neither breastfeeding nor using an effective method of
contraception, is at risk of pregnancy within three weeks regardless of next menses (Sober &
Schreiber, 2014; Tepper et al., 2011).
The Low Country region of South Carolina consists of a predominantly black,
low-income, rural population. The inhabitants face a lifetime of economic hardships, psychological
four counties in Low Country: Allendale, Bamberg, Hampton, and Orangeburg. Financial
barriers to health care hinder the ability for women to obtain effective contraception and
knowledge of, leading to negative outcomes of great magnitude, both direct and indirect, for both
infant and maternal health. Other issues that are prevalent in the population, such as adolescent
pregnancy, easily exacerbate the conditions.
1.2 Purpose
In 2007, the Low Country Healthy Start program (LCHS) was implemented as an effort
to improve all aspects of perinatal and family health, including family planning and pregnancy
spacing, for women (clients) who enroll in the program. Several benchmarks are set at the
federal level with target figures. For example, Healthy Start aims to promote quality by reducing
the proportion of Healthy Start pregnancies conceived within 18 months of a previous birth to
30%. Services include counseling about effective contraceptive choices in the prenatal and
postpartum period. LCHS collaborates with doctors and midwives to offer the Depo Provera
injection to each client upon discharge from the hospital after giving birth. Client navigators
(CNs) coach clients individually to ask for the Depo injection if not offered. In 2012, 59.4% of
enrolled women left the hospital after delivery with an effective contraceptive method, up from
43.9% in 2003. Even with the extensive measures that the program takes, at least 40% were not
offered, declined, or did not ask for the Depo injection. Such cases require comprehensive
casework to assess these clients for influential factors such as intent of pregnancy, intent to
breastfeed, perceptions of contraceptive methods and of carrying a baby, and behavioral and
social influences. Overcoming current challenges requires thorough coordination and
Barriers still exist that prevent adequate knowledge about the inter-pregnancy period
from being disseminated effectively in regions such as Low Country. For a population that is
prone to RRP in the midst of perpetual economic hardship, LCHS must ascertain the factors that
lead to RRP in order to help women with family planning, including effective contraceptive use,
to achieve longer IPIs. This study has two primary aims: (1) to evaluate the effect of receiving
the Depo injection at discharge on time to subsequent pregnancy, accounting for other risk
factors and potential confounders, and (2) to investigate the effect of receiving Depo injections
over time on time to RRP, relative to using other contraceptive methods over time. We believe
that receiving the Depo injection at discharge will be a protective factor against shorter IPIs.
Secondly, we believe that receiving Depo injections over time or receiving a long-acting
reversible contraceptive (LARC) during the postpartum period will also protect against shorter
IPIs. Separate analyses will be done to accomplish Aim 1 and Aim 2.
Literature Review
The literature that was selected in relevance to this study presents past research on
predictors of short IPIs among at-risk and marginalized women. First, we discuss both
demographic factors and pregnancy-related factors that have been shown to lead RRPs, including
African American race and adolescence. Pregnancy-related factors include characteristics such
as mental health, intention of pregnancy, and behavioral tendencies. Next, we present evidence
of factors that influence the choice of a postpartum contraceptive method. Whether or not a
woman should use postpartum contraception and which one heavily depends on both health risks
and the woman’s behavior and lifestyle postpartum (i.e. breastfeeding, resuming sexual
intercourse). Furthermore, whether or not a woman actually takes the contraceptive method and
discusses how different methods of contraceptives actually affect IPIs in the presence of
characteristics of women similar to the Low Country population.
2.1 Characteristics That Lead to Short Inter-pregnancy Intervals (IPI)
Gemmill and Lindberg (2013) conducted a cross-sectional study on a nationally
representative sample (n = 2,253) of self-reported subsequent pregnancies in the US. They found
that 35% of the pregnancies were conceived within 18 months of a previous birth. Black women,
15-19 year old adolescents, and women reporting an unintended pregnancy were significantly
more likely to experience a RRP. Use of contraceptive method was not included in the study, but
women who had a Medicaid delivery were more likely to report the pregnancy as unintended.
The CDC Morbidity and Mortality Weekly Report (MMWR) stated that, out of over
367,000 adolescent (15-19 years old) births from 16 Pregnancy Risk Assessment Monitoring
System (PRAMS) sites across the US (15 states and New York City) from 2007-2010, almost
20% were repeat births (Gavin et al., 2013). This report similarly found that black adolescents
are more likely than white adolescents and Hispanic adolescents to experience a rapid repeat
pregnancy (Gavin et al., 2013; Gemmill & Lindberg, 2013).
Crittenden et al. (2009) looked at self-reported mental health factors, behavioral factors,
and past experiences that led to RRP (< 24 months) in a sample of mostly black adolescents (n =
354). Baseline reports of later age at menarche and a greater likelihood of physical aggression
were associated with RRP. James-Hawkins and Sennot (2015) performed a qualitative study that
consisted of narratives describing 30-60 minute interview sessions with 40 low-income women,
20 black and 20 white, and their child-bearing experiences throughout their life course. The
narratives exhibit trends of self-claimed young naiveté in instances of adolescent pregnancy,
norms (i.e. having one’s first baby at an appropriate age) even if they themselves violated them
(“young and dumb”). They reveal common perceptions among low-income women in that they
would prefer to wait to have children, and that they often felt that their pregnancies were beyond
their control or due to youthful lack of education on the matter. Although the more recent studies
of factors of RRP lack a large sample size and high quality methodology or analysis, the findings
support associations of the above important characteristics that need to be examined further,
more rigorously, and in the context of contraceptive practice.
Patchen et al. (2009) conducted a preliminary study (n = 58, 59% black) with prevalence
estimates of mental health and trauma indicators in adolescent mothers who had a subsequent
pregnancy (SP) within 24 months and adolescent mothers who did not (NSP, comparison group:
random sample of the NSPs, matched for age and ethnicity). In this small sample, significantly
more SP adolescent mothers than NSP adolescent mothers had recorded mental health issues
(from discouragement to attempting suicide) and trauma (rape, physical or emotional abuse,
sexual abuse, or death of a loved one) in their prenatal and postpartum assessments. They
conducted another study (n = 279) on maternal depression and RRP (< 6 months) in first-time
mothers (ages 15-36 years) and found that women diagnosed with moderate to severe depression
had significantly higher odds (7.24) of RRP than women diagnosed with minimal to mild
depression (Patchen et al., 2013). However, the comparison was based on a small outcome of 12
RRPs. Although the study began with a small sample size and experienced a high attrition rate,
the follow-up period lasted 36 months with a RRP cutoff at 6 months. They reported no
significant difference between races, although their only indicators were white and non-white.
Studies using older data from the early 1990s to determine social and socioeconomic
(Gillmore et al., 1997; Gold et al., 2004, 2005) or occurrence of RRP (Raneri & Wiemann,
2007) between different races, or their samples consisted mostly of white women (Gillmore et
al., 1997). This could be an indication of the influence of welfare reform, since the results of the
studies are more consistent within time periods (Raneri & Wiemann, 2007). All studies found on
the matter agree that adolescent mothers are at high risk of RRP (Crittenden et al., 2009; Damle
et al., 2015; Gavin et al., 2013; Gemmill & Lindberg, 2013; Patchen & Lanzi, 2013; Raneri &
Wiemann, 2007; Sober & Schreiber, 2014; Templeman et al., 2000; Tocce et al., 2012;
Waggoner et al., 2012).
2.2 Postpartum Contraceptive Methods
There are many important considerations in choice of contraceptive method that, in turn,
require a variety of choices in order to ensure mother and infant health and adequate pregnancy
spacing (Sober & Schreiber, 2014). In terms of safety, the CDC’s US Medical Eligibility Criteria
for Contraceptive Use (2011) revised recommendations for postpartum contraceptive methods
include specific timelines of safe usage for breastfeeding versus non-breastfeeding women, as
well as for women at risk of venous thrombosis (VT). Sober and Schreiber (2014) reviewed the
different methods, considerations and processes that postpartum mothers should adhere to for
health, safety and prevention. A postpartum woman’s plan to breastfeed is a critical decision that
affects both her choices in postpartum contraceptive methods as well as her chances of
experiencing a short IPI. If she chooses to breastfeed, she must use either a non-hormonal form
of contraception or a progestin-only form in order to avoid affecting the breast milk or the infant.
While breastfeeding and depending on the frequency and duration, a postpartum woman will
However, for LAM to be achieved, the postpartum mother must be breastfeeding exclusively and
less than 6 months postpartum.
Other factors that influence a woman’s choice of contraceptive method, and the
continued use, are insurance coverage, perinatal counseling and health services, and types of
contraception that are made available and accessible (Gavin et al., 2013; Miller et al., 2000;
O’Neil-Callahan et al., 2013; Tang et al., 2013). Influences within the woman’s life, including
perceived barriers or effectiveness of contraceptive methods (James-Hawkins & Sennott, 2015;
Miller et al., 2000) and psychological, social, and behavioral factors also show potential to
predict both postpartum contraception use and RRP (Bennett et al., 2006; Tang et al., 2013;
Templeman et al., 2000; Waggoner et al., 2012). Miller et al. (2000) examined postpartum
contraceptive choices among a sample of mostly single, black women who were eligible for
Medicaid (n = 299). The main risk factor was the baseline prenatal perception of each method as
“Most Effective,” “Safest,” or “Best for [Her].” Due to resource restrictions, the study was only
able to include the OCP, DMPA, condoms, and tubal ligation. The study found a low rate of
consistent use postpartum among women who chose OCP (54.7%) and among women who
chose condoms (31.3%). The nature and results of this study reflect both the lack of choices and
the indecision (due to lack of knowledge, lack of counseling, etc.) experienced among
Medicaid-eligible women.
The MMWR (2013) reported that black adolescents were significantly less likely to use
highly effective contraceptive methods postpartum (14.3%) than non-Hispanic white teens
(24.6%) and Hispanic teens (27.9%). As discussed in Section 2.3, these statistics are likely to be
closely related to the demographic population’s higher likelihood of RRP. Each study highlights
period through the postpartum period, although with varying degrees of bias and contextual
access to services.
2.3 Postpartum Contraception Use and Rapid Repeat Pregnancies
Adherence to non-LARCs, which require either daily or weekly maintenance, is prone to
failure, so such methods are deemed by several publications to be less effective. A mixed race
(61.2% black), multi-site study (n = 227) examined participant characteristics, 6-month
contraception use, and RRP (< 18 months) among postpartum women aged 14-36 (Waggoner et
al., 2012). Contraceptive choices were long-acting (sterilization, Norplant, implant, IUD, DMPA,
or injectables) and others (OCP, condoms, diaphragm, patch, sponge, abstinence, withdrawal,
etc.). The majority of the sample was black, but there were no significant differences between
race and RRP. The study also found teens to be at significantly higher risk for RRP than adult
women, controlling for education and ethnicity. Interestingly, a greater proportion of participants
who had a goal-oriented intention for their next pregnancy (e.g. completing education) chose a
long-acting contraceptive than participants who wanted never to have another pregnancy. 21.6%
of the ‘never again’ patients were pregnant again within 18 months. Participants ages 14 to 16
were over twice as likely to experience a RRP as adult women, and using a LARC at 6 months
decreased risk of a RRP by 70% compared to using no method.
Bennett et al. (2006) conducted a study (n = 643, 68.9% black, age ≥ 19) that considered
low education as the main predictor of unintended rapid repeat pregnancies, while testing for
mediating effects of depression and contraceptive method. They considered highly effective
methods to be oral and transdermal hormonal contraception (always in use during intercourse),
DMPA, and combination hormone contraception (used monthly). They found that education
unintended RRP, but neither contraceptive method nor depression mediated the effect of
education. This study also found that 22.3% of the women breastfed at 3 months after delivery,
with similar rates between education levels. By 11 months postpartum, however, 9.1% (7.1%) of
high (low) education participants were still breastfeeding. Both studies that factored in
postpartum contraception found that depression had no effect on rapid repeat pregnancy, which
conflicts with studies mentioned earlier that did not consider contraceptive method.
Damle et al. (2015) looked at contraceptive choices as factors of RRP (< 2 years) using
data on adolescent mothers in a mostly black, Medicaid insured sample (n = 340). The available
LARCs were LNG IUD, copper IUD, and subdermal implant, measured at initiation within 8
weeks postpartum. DMPA injections were the only inpatient contraceptive method available.
Other contraception indicators were ‘nothing documented,’ declined, condoms, OCP, patch and
ring. Getting the DMPA injection before discharge resulted in significantly fewer RRPs than
declining the injection. Use of LARCs and postpartum visits within 8 weeks also significantly
reduced RRPs, but patients who reported intent to use LARC but had not yet initiated it by their
postpartum visit had the same pregnancy rate as those who did not plan to use LARC. Notably,
prenatal care, social worker involvement, and participation in a specialized teen pregnancy
program were all insignificant in predicting RRP. Limitations included inadequate follow-up
documentation and possible under-reporting of subsequent pregnancies.
An older study (n = 206) compared RRP (< 12 months) in postpartum adolescents who
delivered in 1997 and chose either the DMPA or OCP upon discharge (Templeman et al., 2000).
Follow-up for updates on contraceptive use and pregnancy status lasted at least 12 months.
DMPA users had almost twice the retention rate of OCP users, and OCP users were 9.09 times as
compared to non-LARC users. However, they used either logistic regression with longitudinal
data or Kaplan Meier estimates to track contraceptive changes, so precise trends could not be
captured.
2.4 Interventions against RRP
Barnet et al. (2009) conducted a randomized controlled trial and used a Cox proportional
hazards model to examine the association between specialized counseling sessions and time to
repeat pregnancy in a sample of mostly black, Medicaid insured adolescent mothers (n = 235).
The computer-assisted motivational intervention (CAMI) was designed to prevent RRP in
adolescents through quarterly sessions until 2 years postpartum and a single home visit. It used a
trans-theoretical model that assessed sexual relationships, contraception-use intentions and
behaviors, and readiness to engage in pregnancy prevention. CAMI+ also included a
multi-component home-based intervention and monthly visits, while the control group received
standard usual care. The CAMI+ group resulted in a significantly lower rate of RRP than the
control group, but the CAMI-only group did not. Completing at least 2 CAMI sessions in either
CAMI group significantly reduced the rate of RRP. The study may have had issues with
implementation fidelity: the CAMI+ group consisted of more interactive components, which
likely ensured greater compliance. Participants who became pregnant during the trial were
required to cease the intervention, because it used an algorithm that could not accommodate
pregnancies. Still, the study highlights the benefit of frequent counseling. Depressive symptoms,
drug use, and, notably, wanting another child within 2 years were all insignificantly associated
with RRP.
Finally, Patchen et al. (2013) sought to determine the effect of an integrated services
months) among participants (n = 187, 61.3% black). The intervention was stratified by site:
hospital-based health center (HHC, 89.8% black) or community-based health center (CHC,
78.1% Hispanic). 43.9% of the HHC participants’ family received public assistance, and 50% of
the HHC participants’ mother was a teen parent. HHC participants had a higher rate of
graduation or GED, and both parents also had a higher rate of graduating from high school. The
study only reported prevalence of contraceptive use and subsequent pregnancy among each site
and their total. In such an integrated services setting with free contraceptive counseling and
issuance, rate of use decreases at a slow rate over time. Rates of both subsequent pregnancy and
subsequent birth were higher in the CHC participants than the HHC participants. Major
limitations to the study were a high attrition rate and lack of a comparison group. The
comparisons between sites, however, provided a proximate indicator of race. Compared to CHC
participants, HHC participants had a higher rate of RRP (21.1% vs. 16.4%).
2.5 Summary
According to the literature, the women of LCHS are in a demographic group that is more
susceptible to a short IPI. The psychological stressors and trauma that they are more likely to
experience, as found by Patchen et al. (2009), make them prone to depression. This study
controls for physical abuse during the index pregnancy and postpartum depression. The literature
presents evidence that black women with low socioeconomic status are at a higher risk of not
using an effective form of contraception, and that postpartum adolescents who choose a Depo
injection over OCP are more likely to continue use and prevent a RRP. Choosing a postpartum
contraceptive method is a critical point in the stages of family planning that has been researched
at length. Evidence indicate LARCs to be the most effective form of contraception when
and for women who plan to breastfeed. The OCP is highly effective (Bennett et al., 2006), but
only when used correctly; research shows that it has a lower retention rate and a lower rate of
proper maintenance and usage. This study will model time to RRP according to indicators related
to the above risk factors.
Methods
3.1 Study Population
Clients who enroll in LCHS are residents of the four counties that make up Low Country,
South Carolina. The region consists of a predominantly black, low-income population with a
history of chronic conditions and other hardships that perpetuate a prevalence of adverse birth
outcomes for mothers and infants. Both pregnant women and mothers are accepted into LCHS,
but the target population for this study is women and adolescents who either (1) entered LCHS
with a pregnancy or (2) entered LCHS recently postpartum. At the time of the study, the number
of clients enrolled in LCHS was 2,460. 2,259 clients were eligible for this study, with correctly
entered data and sufficient records of index delivery (first delivery while enrolled in LCHS) and
contraceptive method issuance.
3.2 Low Country Healthy Start Program Strategy and Data Collection
The program is an ongoing case management intervention, with a client navigator (CN)
who works with each clients during home visits to screen for referrals and services based on their
identified needs from the initial risk assessment that is to be completed upon entry into the
program. The initial risk assessment is a comprehensive risk screening tool that was developed
and modified for over 12 years by LCHS. It is administered by the CN to the client and is used to
demographic characteristics, previous pregnancy outcomes, stress, social and behavioral factors
(e.g. smoking, alcohol or drug use), personal and family medical history, physiological data, and
medical and psychosocial risk factors and conditions (e.g. diabetes, hypertension, depression,
family conflict, domestic violence). Through the risk screening, the CN refers the client to the
appropriate appointments and educational services, and they work closely with each client to
track these services, both prenatal and postpartum.
LCHS activities related to interconceptional care (ICC) and family planning (FP) include
home visits that incorporate a strong educational curriculum for ICC and FP;
collaborations with other local health systems to facilitate collective impact on
women’s access to a consistent and seamless service delivery and support system;
case management services for each client to effectively navigate the system;
follow-up support to help clients establish a medical home as a permanent
connection to the health care system;
follow-up support to ensure a that a client leaves the hospital post-delivery with a
contraceptive method in hand; and
follow-up support to ensure that women are effectively using a contraceptive
method at periodic intervals over the 24-month postpartum enrollment.
LCHS personnel and the obstetricians and nurse midwives at the hospital form a
collective effort to increase the number of clients who leave the hospital with a Depo Provera
injection after delivery. CNs coach prenatal women to ask for the injection. Some methods to
ensure that women receive follow-up of some form is by scheduling immunization or Well-Child
to receive a check-up themselves. The program protocol compensates the client with cash for
each appointment, since client retention becomes more difficult during postpartum. LCHS tracks
all appointments and assessments in a web-based database system that is managed by the South
Carolina Budget and Control Board, Division of Research and Statistics-Health Demographics.
3.3 Measures
3.3.1 Outcome measure. The outcome measure of interest for both Aim 1 and Aim 2
was time, in months, to RRP, given the clients who experienced the outcome as well as the
clients who, in her length of recorded enrollment in LCHS, did not experience a short IPI (≤ 24
months). LCHS enters information for each time that a client delivers an infant while enrolled in
the program. If a client enters the program during her postpartum period, the study used her
index delivery date based on her self-report. When a client confirms a subsequent pregnancy, this
new pregnancy start date is estimated from her latest reported menstrual cycle. The IPI was
measured, in months, from the delivery date of the index child to the estimated start date of the
subsequent pregnancy.
3.3.2 Explanatory variables.
Postpartum contraceptive decisions. It is important to emphasize that the contraceptive
methods adjusted for in these two analyses represent the client’s choice, adherence and
consistency to the contraceptive methods. Biologically, the contraceptive methods, if used
correctly, do protect against pregnancy, with the exception of condom breakage. For Aim 1, the
Depo injection is measured at discharge from the hospital after the client’s index delivery, so that
a client either received a Depo injection at discharge (1) or did not receive a Depo injection at
discharge (0). For Aim 2, the Depo injection is measured at each issuance of the injection, as are
client tracks each date that each method of contraception is given to the client and records the
expiration date of the contraceptive method and, thus, the next required follow-up visit date.
Based on past literature and the purposes of the research question, the other contraceptive
methods were categorized into maintenance (OCP, patch, ring), barrier (vaginal spermicide,
condom, film), and LARC (Implanon, Norplant, Mirena, IUD). For the Aim 2 analysis, each
category of contraceptive method was coded as a time-varying dichotomous value, in which the
method is considered to be in use (1) starting from its issue date and ending on its expiration
date. The method is considered in nonuse (0) starting from the expiration date and ending on the
next date that the client receives the same method.
Demographic risk factors. LCHS records each client’s date of birth as well as her date of
entry into the program. The study used the client’s age at entry (number of years between entry
date and client’s date of birth) into LCHS as a proximate measure of her age at the conception of
her index baby, treated as a continuous variable. Of the available socioeconomic characteristics
that LCHS records for each client during the initial risk assessment, educational status was
reported the most by clients, and was thus chosen for a potential explanatory variable. The study
treated limited education as a dichotomous variable, indicating whether the client did not finish
high school before she became pregnant (1) or she did finish high school (0).
Psychosocial risk factors. The study considered prenatal and postpartum depression for
potential inclusion into the models. Upon entry into LCHS, each client completes the Edinburg
Depression Screening (EPDS) questions to detect any risk for prenatal depression, if they entered
the program while pregnant, or for postpartum depression, if they entered the program after
giving birth. Clients who were screened for prenatal depression were screened again four weeks
four-level Likert scale in response to each statement. For LCHS purposes, an EPDS score of 12
or greater indicates a high risk of depression. The study treated both prenatal and postpartum
depression scores as continuous variables.
The study took into account whether or not a client’s index birth resulted in a live birth or
a fetal death (birth outcome). If the client enters the program after her index delivery, she is
asked during the initial risk assessment to list her past pregnancies and the birth outcome of each.
If she enters the program while pregnant, the CN reports the details of the delivery, including
birth outcome, into the database. In the initial risk assessment, for deliveries that occurred prior
to entry into LCHS, LCHS categorizes birth outcomes as a live birth, a fetal death, or an infant
death before his or her first birthday. For deliveries that occurred while the client was enrolled in
LCHS, LCHS categorizes birth outcomes as a live birth, a spontaneous abortion (miscarriage or
loss of fetus <28 weeks), an elected abortion, or a fetal death (fetus >28 weeks of gestation). For
this study, birth outcome was treated as a dichotomous variable for either a live birth (1) or a
fetal death (0), in which any outcome that was not reported as a live birth was categorized as a
fetal death. For each pregnancy that the client reports happening prior to entry into LCHS, as
well as for each pregnancy that she experiences while in LCHS, the CN records whether or not
the pregnancy was unplanned. The study treated the intention of the index pregnancy as a
dichotomous variable, either unplanned (1) or planned (0).
Other factors that were tested for potential inclusion into the models, specifically
important aspects of the client’s relationship health, were whether or not (1) the father of the
index baby is involved, (2) a male is emotionally involved, (3) the client’s partner drinks, (4) the
index pregnancy. These characteristics are self-reported by the client in her initial risk
assessment. The study treated each of these variables as dichotomous on a yes (1) or no (0) basis.
Behavioral risk factors. LCHS reports pregnancy-related behaviors, including a client’s
plan to breastfeed, the trimester that she started prenatal care, and the trimester that she entered
LCHS, for each delivery that she experiences while enrolled. The study took into account a
client’s decision to breastfeed (1) or not (0) after her index delivery. For the trimester that the
client began prenatal care and for the trimester that she entered LCHS, the CN records either first
trimester, second trimester, third trimester, or not applicable/postpartum for each. For the study,
the two variables were treated as dichotomous, so that the client either received prenatal care
during her first, second, or third trimester (1) or did not receive prenatal care (0), and that she
either enrolled in LCHS while in her first, second, or third trimester (1) or postpartum (0).
The remaining available behavioral risk factors that the study considered are measured
during the initial risk assessment by the client’s self-report as yes (1) or no (0). The study
included whether a client was physically active (1) or not (0) as a potential explanatory variable.
Although the literature lacks much information on the relationship between physical activity and
IPI, there may exist some linkage between the behavioral and biological aspects of physical
activity and whether or not a woman experiences a RRP. The study also took into account clients
who reported having sex without a condom (1) versus clients who reported that they did not have
sex without a condom (0). Finally, the study also considered whether the client reported having
3.4 Analysis
3.4.1 Overview. The study used descriptive statistics to describe the study population,
excluded clients, and final sample. We used t-tests and chi-square tests of association, where
appropriate, to compare the final sample with the excluded clients. We used Kaplan Meier
survival curves to observe time to RRP for each covariate in the final sample as well as between
the study sample and the final sample used for analysis. Age at entry and prenatal depression
score were stratified on their means for the Kaplan-Meier survival curves. We performed two
analyses, one using a model to fit significant covariates for Aim 1 (Model 1) and one using a
separate model with the same baseline covariates for Aim 2 (Model 2). Unadjusted and adjusted
hazard ratios were calculated for both models. Data merging and preparation, hazard ratios,
confidence intervals for the hazard ratios, and p-values were all obtained using Statistical
Analysis System (SAS) version 9.4.
3.4.2 Model building and diagnostics. First, for Aim 1 model building, all potential
explanatory variables were tested separately for association with IPI using Kaplan-Meier
survival curves and the log-rank test, with a more conservative α of 0.1 in order to avoid
excluding predictors that may have been significant after adjusting for other covariates.
Covariates that were statistically significant were included in the initial choices for Model 1. The
exceptions were age and Depo injection at discharge, which were included in the model
regardless of statistical significance. Variables in Model 1 that were no longer significant after
adjusting for other covariates were removed using a backward elimination, unless the partial log
likelihood test for the model with and without a particular covariate resulted in a significant
difference, in which case the variable remained in the model. Variables whose log-rank test
statistical significance (α = 0.05), adjusting for other variables. Martingale residuals with a
lowess smoothed plot were used to test for a linear relationship between the continuous variables
(age and prenatal depression score) against the outcome (time to RRP). Once the appropriate
main effects and transformations were obtained for the model, each explanatory variable was
tested for interaction with each other explanatory variable (α = 0.05). Deviance residuals were
used to detect the percentage and extent of poorly predicted outcomes. Schoenfeld residuals fit to
a lowess smoothed plot and rank-transformed time were used to test the proportional hazards
assumption for each explanatory variable. Any explanatory variable that did not meet the
proportional hazards assumption was tested for interaction with time. The difference in sample
log cumulative hazard functions for the covariate over time was used to choose the function of
time interaction. Finally, score residuals were used to detect influential cases. The same main
effects that were fitted to the adjusted model in Aim 1 for statistical significance were also fitted
to the adjusted model for Aim 2, which took into account the time-varying use of contraceptive
methods, specifically Depo injections over time, maintenance methods, barrier methods, and
LARC methods. The same procedures for testing for interactions, linearity, and proportional
3.4.3 Censored data. The analysis took into account right censoring of the data, in which
a client did not have a record within LCHS of experiencing a subsequent pregnancy. For the
purpose of this study, IPIs were observed only if the client experienced one within 24 months of
her index birth into LCHS. Thus, the analysis includes both clients who were censored prior to
the 24-month cutoff point as well as clients who were censored at 24 months. 37 (1.75%) of the
2,115 clients who were not observed to have a RRP were censored at 24 months, while the other
2,078 were censored prior to 24 months.
3.4.4 Missing data and exclusion criteria.For the analysis, SAS was not able to include
any records with missing covariates in the Cox model. Thus, all clients with any missing
explanatory variable were excluded from the final sample. Clients with only a single record in
the data set were excluded, as well. T-tests and chi-square tests of association were used to
compare continuous and dichotomous covariates, respectively, between the excluded clients and
the final sample. Because of missing data for the explanatory variables, the final sample size
could only be known after the appropriate explanatory variables were determined for the
adjusted model.
Results
5.1 Descriptive Statistics
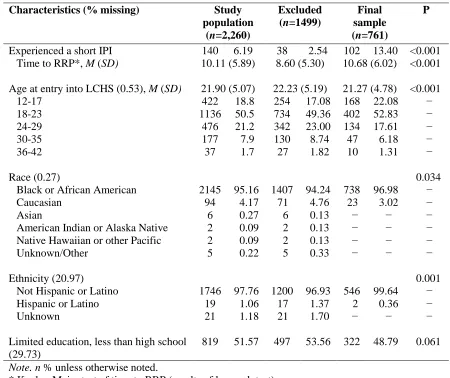
Out of the 2,260 clients eligible to be included in the study, 761 were included in the
analysis with the above exclusion criteria. Table 1 includes descriptive statistics for relevant
demographic variables for the overall study population, those excluded from the analysis, and
those included in the analysis of the Cox model. The final sample reflects the demographic
(96.98%), non-Hispanic (99.64%) population. The tests of differences between the included and
excluded samples showed which variables are not missing completely at random for the study
population. Overall, the included sample consisted of a much greater proportion of IPIs shorter
than 24 months, c2(1, N = 2,260) = 102.6, p < 0.001, although it had a mean IPI about two
months longer than the excluded sample, t(927.53) = 10.36, p < 0.001. The majority of clients
were younger than 23, and the final sample was younger by a statistically significant yet small
difference in magnitude, t(1648.6) = 4.23, p < 0.001.
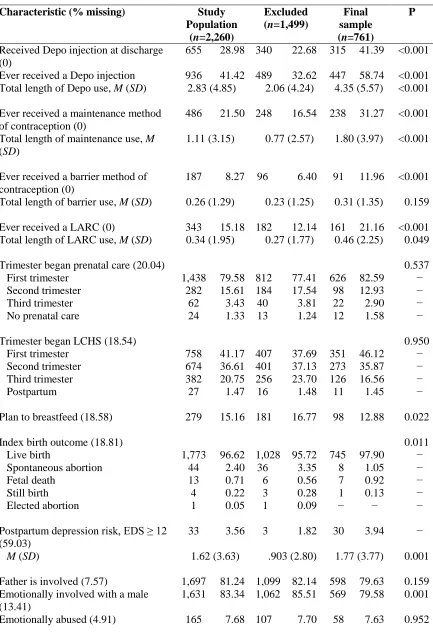
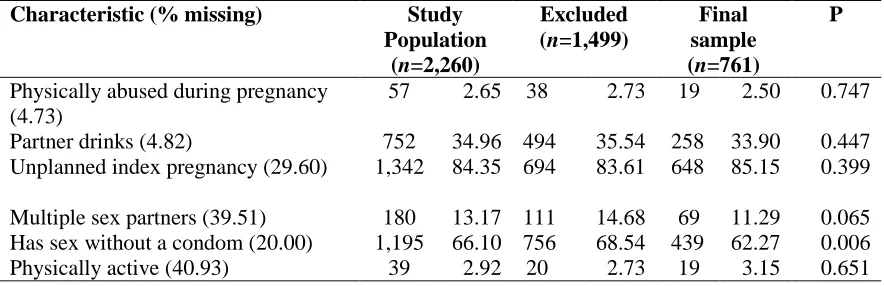
Table 2 contains similar statistics and comparisons for the pregnancy-related variables. A
much greater proportion of those included in the study received the Depo injection at discharge,
c2(1, N = 2,260) = 85.86, p < 0.001, and a much greater proportion of those included in the study
ever received a Depo injection over time, c2(1, N = 2260) = 141.9, p < 0.001. For all
contraceptive method categories, a significantly greater proportion of clients who were included
in the analysis had ever received a contraceptive method of that type. Also, the average length of
time that a client was prescribed a contraceptive method was significantly greater for those
included in the analysis than those who were excluded, except for the barrier method, in which
the difference in proportion was not significant. In the included sample, 3.89% more clients
planned to breastfeed than the excluded sample, c2(1, n = 1,840) = 5.27, p = 0.022. A
significantly smaller proportion of clients included in the final sample reported having sex
without a condom, c2(1, N = 1808) = 7.55, p = 0.006, as was the case for being emotionally
Table 1: Descriptive Statistics for Demographic Variables
Characteristics (% missing) Study population
(n=2,260)
Excluded (n=1499)
Final sample (n=761)
P
Experienced a short IPI 140 6.19 38 2.54 102 13.40 <0.001 Time to RRP*, M (SD) 10.11 (5.89) 8.60 (5.30) 10.68 (6.02) <0.001 Age at entry into LCHS (0.53), M (SD) 21.90 (5.07) 22.23 (5.19) 21.27 (4.78) <0.001
12-17 422 18.8 254 17.08 168 22.08 − 18-23 1136 50.5 734 49.36 402 52.83 − 24-29 476 21.2 342 23.00 134 17.61 − 30-35 177 7.9 130 8.74 47 6.18 − 36-42 37 1.7 27 1.82 10 1.31 −
Race (0.27) 0.034
Black or African American 2145 95.16 1407 94.24 738 96.98 − Caucasian 94 4.17 71 4.76 23 3.02 − Asian 6 0.27 6 0.13 − − − American Indian or Alaska Native 2 0.09 2 0.13 − − − Native Hawaiian or other Pacific 2 0.09 2 0.13 − − − Unknown/Other 5 0.22 5 0.33 − − − Ethnicity (20.97) 0.001
Not Hispanic or Latino 1746 97.76 1200 96.93 546 99.64 − Hispanic or Latino 19 1.06 17 1.37 2 0.36 − Unknown 21 1.18 21 1.70 − − − Limited education, less than high school
(29.73)
819 51.57 497 53.56 322 48.79 0.061
Note. n % unless otherwise noted.
Table 2: Descriptive Statistics for Pregnancy-Related Variables
Characteristic (% missing) Study Population
(n=2,260)
Excluded (n=1,499)
Final sample (n=761)
P
Received Depo injection at discharge (0)
655 28.98 340 22.68 315 41.39 <0.001 Ever received a Depo injection 936 41.42 489 32.62 447 58.74 <0.001 Total length of Depo use, M (SD) 2.83 (4.85) 2.06 (4.24) 4.35 (5.57) <0.001 Ever received a maintenance method
of contraception (0)
486 21.50 248 16.54 238 31.27 <0.001 Total length of maintenance use, M
(SD)
1.11 (3.15) 0.77 (2.57) 1.80 (3.97) <0.001 Ever received a barrier method of
contraception (0)
187 8.27 96 6.40 91 11.96 <0.001 Total length of barrier use, M (SD) 0.26 (1.29) 0.23 (1.25) 0.31 (1.35) 0.159 Ever received a LARC (0) 343 15.18 182 12.14 161 21.16 <0.001 Total length of LARC use, M (SD) 0.34 (1.95) 0.27 (1.77) 0.46 (2.25) 0.049 Trimester began prenatal care (20.04) 0.537 First trimester 1,438 79.58 812 77.41 626 82.59 − Second trimester 282 15.61 184 17.54 98 12.93 − Third trimester 62 3.43 40 3.81 22 2.90 − No prenatal care 24 1.33 13 1.24 12 1.58 − Trimester began LCHS (18.54) 0.950
First trimester 758 41.17 407 37.69 351 46.12 − Second trimester 674 36.61 401 37.13 273 35.87 − Third trimester 382 20.75 256 23.70 126 16.56 − Postpartum 27 1.47 16 1.48 11 1.45 − Plan to breastfeed (18.58) 279 15.16 181 16.77 98 12.88 0.022 Index birth outcome (18.81) 0.011 Live birth 1,773 96.62 1,028 95.72 745 97.90 − Spontaneous abortion 44 2.40 36 3.35 8 1.05 − Fetal death 13 0.71 6 0.56 7 0.92 − Still birth 4 0.22 3 0.28 1 0.13 − Elected abortion 1 0.05 1 0.09 − − − Postpartum depression risk, EDS ≥ 12
(59.03)
33 3.56 3 1.82 30 3.94 −
M (SD) 1.62 (3.63) .903 (2.80) 1.77 (3.77) 0.001 Father is involved (7.57) 1,697 81.24 1,099 82.14 598 79.63 0.159 Emotionally involved with a male
(13.41)
Characteristic (% missing) Study Population
(n=2,260)
Excluded (n=1,499)
Final sample (n=761)
P
Physically abused during pregnancy (4.73)
57 2.65 38 2.73 19 2.50 0.747 Partner drinks (4.82) 752 34.96 494 35.54 258 33.90 0.447 Unplanned index pregnancy (29.60) 1,342 84.35 694 83.61 648 85.15 0.399 Multiple sex partners (39.51) 180 13.17 111 14.68 69 11.29 0.065 Has sex without a condom (20.00) 1,195 66.10 756 68.54 439 62.27 0.006 Physically active (40.93) 39 2.92 20 2.73 19 3.15 0.651
Note. n % unless otherwise noted.
[image:35.612.86.528.72.215.2]5.2 Model Building and Diagnostics
Table 3 shows the results of the Kaplan-Meier survival estimate log-rank tests for each
potential explanatory variable. The variables that were significantly associated (α = 0.1) with
time to RRP by the nonparametric test of the survival function were first entered into the
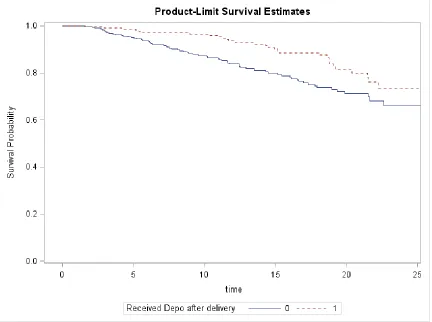
adjusted Cox model. Figure 1 illustrates the Kaplan-Meier survival curves for those who
received the Depo injection at discharge and for those who did not receive the Depo injection at
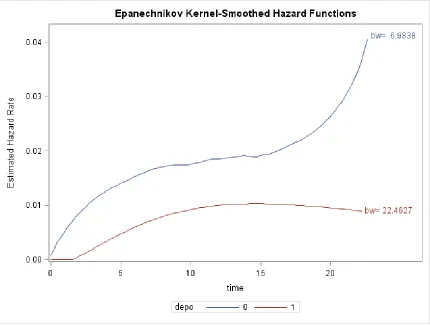
discharge, in the final sample. Epanechnikov kernel-smoothed hazard functions corresponding to
the Depo injection at discharge are given in Figure 2, and they indicate that the hazard rates do
not change proportionally over time. The diagnostics for this occurrence will be discussed further
below. After entering the covariates into the Cox model, variables were deleted for statistically
insignificant association, either by the Wald chi-square test or by the partial log-likelihood test,
in the following order: prenatal care, prenatal entry into LCHS, prenatal depression score, father
involvement, birth outcome, plan to breastfeed, sex without a condom, and physical activity.
Plan to breastfeed initially contributed to a significant change in partial log-likelihood when
included in the model, but it was no longer a significant variable after removing sex without a
Table 3: Difference in K-M Estimated Survival Rates for the Study Population
Variable (n = 2,260) P
Received Depo injection at discharge 0.124 Limited education 0.661 Received prenatal care <0.001 Prenatal entry into LCHS <0.001 Planned to breastfeed 0.095 Index birth resulted in a live birth 0.019 Had sex without a condom 0.058 Had multiple sex partners 0.394 Partner drank 0.301 Unplanned index pregnancy 0.004 Physically active 0.008 Experienced physical abuse during pregnancy 0.034 Father of the baby is involved 0.048 Age at entry into LCHS* 0.226 Prenatal depression score* 0.014 Postpartum depression score* <0.001 *Stratified on the mean
[image:36.612.110.542.360.682.2]Figure 2: Hazard Function for Depo at Discharge, Unadjusted, Final Sample
Figure 3 shows the lowess smoothed line fit to the martingale residuals for postpartum
depression score and age. In the right-hand panel, age shows a relatively linear trend over time,
indicating that a linear prediction of age is appropriate for the model. In contrast, the left panel
shows a lowess smoothed line with a nonlinear trend over time for postpartum depression score,
indicating that a transformation is needed for that variable. A square root transformation for
postpartum depression score gave it a linear trend over time in relation to time to RRP, therefore
satisfying the linearity assumption for the Cox model.
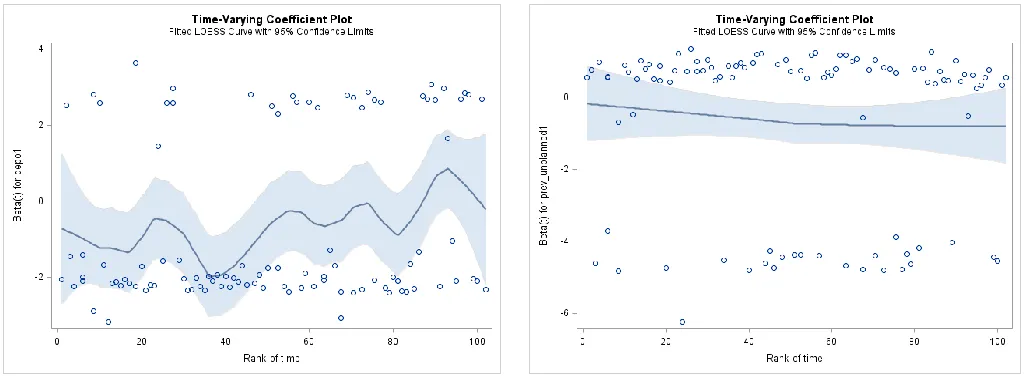
No covariate interaction was found for during the model building for Aim 1. Depo
Schoenfeld residuals (Figure 4, left panel), and the variable showed a significant interaction (r =
0.22, c2 = 4.99, p = 0.026) with time with a lowess smoothed line that showed systematic
deviation from the line at β(t) = 0 with a slope of 0 over the ranked time. In contrast, unplanned
index pregnancy (Figure 4, right panel), resulted in a lowess smoothed line that had a relatively
linear slope approximately equal to 0, indicating that it did not demonstrate evidence of
non-proportionality, r = -0.07, c2 = 0.51, p = 0.477. The difference between the sample log
cumulative hazard functions between those who did not receive the Depo injection at discharge
and those who did declined steeply over time, indicating that a log function of time was
appropriate in modeling the time-varying effect of Depo injection at discharge (Figure 5). The
final model included Depo injection at discharge as well as its interaction with the log function
of time, unplanned index pregnancy, physical abuse during pregnancy, postpartum depression
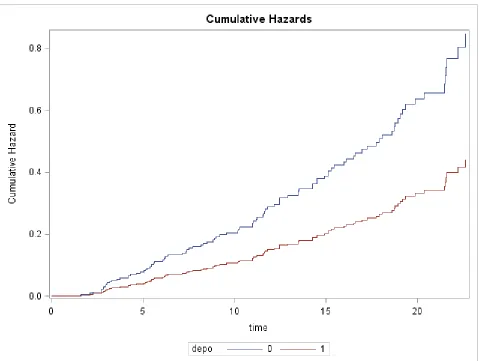
score, and age. Figure 6 shows the cumulative hazard plot for Depo injection at discharge, not
adjusting for its time-varying effects.
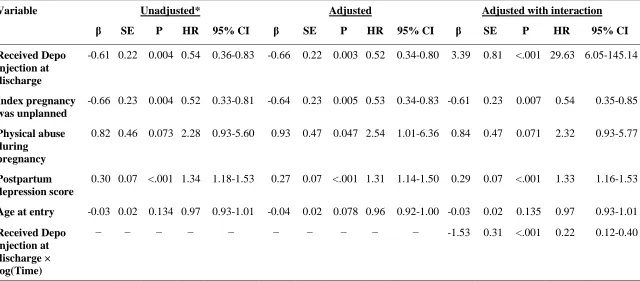
Table 4 displays the regression model parameter estimate, standard error, hazard ratio,
and 95% confidence interval for each variable term. The column labeled “Unadjusted” contains
such information for each variable as a separate model. The middle column, labeled “Adjusted”
contains HRs that are comparable to those of the unadjusted models for each variable. The
right-hand column, labeled “Adjusted with Interaction,” contains the model that adjusts for the
time-varying effects of Depo injection at discharge, as necessary due to the variable’s
Figure 3: Martingale Residuals for Postpartum Depression Score (left) and Age (right)
[image:39.792.137.651.320.508.2]Figure 5: Difference in Sample Log Cumulative Hazard Functions, Final Sample
[image:40.612.74.553.343.704.2]Unplanned index pregnancy, physical abuse during pregnancy, postpartum depression
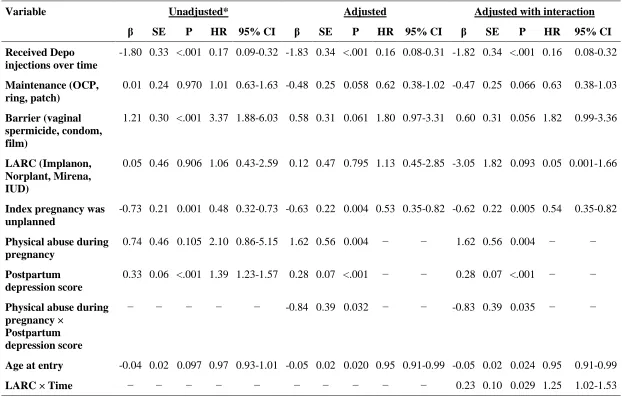
score, and age were similarly included, along with the time-varying contraceptive method
variables, in the model building for Aim 2. In the adjusted model, receiving Depo injections over
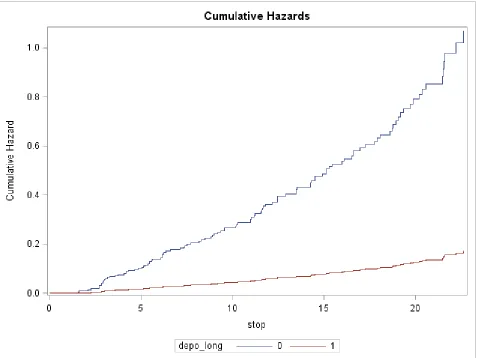
time satisfied the proportional hazards assumption, r = -0.03, c2 = 0.12, p = 0.74. As seen in
Figure 7, receiving Depo injections over time provided a strong protective factor against RRP, as
expected. A significant interaction existed between physical abuse during pregnancy and
postpartum depression score in the adjusted model for Aim 2. LARC did not meet the
proportional hazards assumption, r = 0.24, c2 = 6.37, p = 0.012, and the variable showed a
significant interaction with time. Finally, a significant interaction existed between physical abuse
during pregnancy and postpartum depression score. Table 5 displays the results of the model
Table 4: Cox Proportional Hazards Model Fitting for Aim 1
Variable Unadjusted* Adjusted Adjusted with interaction
β SE P HR 95% CI β SE P HR 95% CI β SE P HR 95% CI
Received Depo injection at discharge
-0.61 0.22 0.004 0.54 0.36-0.83 -0.66 0.22 0.003 0.52 0.34-0.80 3.39 0.81 <.001 29.63 6.05-145.14
Index pregnancy was unplanned
-0.66 0.23 0.004 0.52 0.33-0.81 -0.64 0.23 0.005 0.53 0.34-0.83 -0.61 0.23 0.007 0.54 0.35-0.85
Physical abuse during
pregnancy
0.82 0.46 0.073 2.28 0.93-5.60 0.93 0.47 0.047 2.54 1.01-6.36 0.84 0.47 0.071 2.32 0.93-5.77
Postpartum depression score
0.30 0.07 <.001 1.34 1.18-1.53 0.27 0.07 <.001 1.31 1.14-1.50 0.29 0.07 <.001 1.33 1.16-1.53
Age at entry -0.03 0.02 0.134 0.97 0.93-1.01 -0.04 0.02 0.078 0.96 0.92-1.00 -0.03 0.02 0.135 0.97 0.93-1.01
Received Depo injection at discharge × log(Time)
Table 5: Cox Proportional Hazards Model Fitting for Aim 2
Variable Unadjusted* Adjusted Adjusted with interaction
β SE P HR 95% CI β SE P HR 95% CI β SE P HR 95% CI
Received Depo injections over time
-1.80 0.33 <.001 0.17 0.09-0.32 -1.83 0.34 <.001 0.16 0.08-0.31 -1.82 0.34 <.001 0.16 0.08-0.32
Maintenance (OCP, ring, patch)
0.01 0.24 0.970 1.01 0.63-1.63 -0.48 0.25 0.058 0.62 0.38-1.02 -0.47 0.25 0.066 0.63 0.38-1.03
Barrier (vaginal spermicide, condom, film)
1.21 0.30 <.001 3.37 1.88-6.03 0.58 0.31 0.061 1.80 0.97-3.31 0.60 0.31 0.056 1.82 0.99-3.36
LARC (Implanon, Norplant, Mirena, IUD)
0.05 0.46 0.906 1.06 0.43-2.59 0.12 0.47 0.795 1.13 0.45-2.85 -3.05 1.82 0.093 0.05 0.001-1.66
Index pregnancy was unplanned
-0.73 0.21 0.001 0.48 0.32-0.73 -0.63 0.22 0.004 0.53 0.35-0.82 -0.62 0.22 0.005 0.54 0.35-0.82
Physical abuse during pregnancy
0.74 0.46 0.105 2.10 0.86-5.15 1.62 0.56 0.004 − − 1.62 0.56 0.004 − −
Postpartum depression score
0.33 0.06 <.001 1.39 1.23-1.57 0.28 0.07 <.001 − − 0.28 0.07 <.001 − −
Physical abuse during pregnancy ×
Postpartum depression score
− − − − − -0.84 0.39 0.032 − − -0.83 0.39 0.035 − −
Age at entry -0.04 0.02 0.097 0.97 0.93-1.01 -0.05 0.02 0.020 0.95 0.91-0.99 -0.05 0.02 0.024 0.95 0.91-0.99
LARC × Time − − − − − − − − − − 0.23 0.10 0.029 1.25 1.02-1.53
5.3 Model Interpretation
For Aim 1 (Table 4), a client who received the Depo injection at discharge had a
RRP rate about 46% slower than that of a client who did not receive the Depo injection at
discharge (unadjusted HR = 0.54, 95% CI:0.36- 0.83; adjusted HR = 0.52, 95% CI: 0.34-0.8).
However, after adjusting for the time-varying effect of Depo injection at discharge, receiving the
Depo injection at discharge resulted in a much later RRP than not receiving the Depo injection at
discharge (HR = 29.63, β = 3.39, 95% CI: 6.049-145.141). Over time, the HR for receiving the
Depo injection at discharge decreased gradually (HR = 0.22, β = -1.53, 95% CI: 0.12-0.40), so
that, by about 9.15 months1 postpartum, receiving the Depo injection at discharge became a more
protective factor against RRP than not receiving the Depo injection at discharge.
In order to estimate survival rates, it was necessary to disregard the time-varying effects
of receiving the Depo injection at discharge. The survival estimates for each explanatory variable
in Aim 1, not accounting for any time-varying effect, is given in Table 6. The survival rates for
Depo injection at discharge were overestimated at 6 and 12 months, since earlier postpartum was
associated with a higher hazard ratio for those who received the Depo injection at discharge.
Comparing the survival estimates for each explanatory variable, adjusted for other covariates at
their reference category (0) or mean values, to the reference set of covariates (“Reference
baseline,” Table 6), revealed approximate differences that those covariates produced on time to
RRP. Physical abuse during pregnancy had a deleterious effect on rapid repeat pregnancy,
although the confidence interval reaches 100% survival rate over each period of time. The
survival rates for the postpartum depression score were calculated at the mean (EDS = 0) and at
the 90% quantile (EDS = 6). The higher the postpartum depression score, the lower the survival
rate over time. The older the client’s age at pregnancy with her index child, the greater the
survival rate over time.
Table 5 shows that, for Aim 2, receiving Depo injections over time resulted in a much
lower hazard rate than not receiving Depo injections over time (unadjusted HR = 0.17, 95% CI:
0.09-0.32; adjusted HR = 0.16, 95% CI:0.08-0.31). Due to the differing results between the
time-varying effects of Depo injection at discharge and whether or not a client received the
injection over time, we tested the addition of receiving Depo injection at discharge to the
adjusted model for Aim 2 for association and interaction with other contraceptive methods.
Adjusting for all other variables in the second model, including receiving Depo injections over
time, receiving the Depo injection at discharge resulted in a lower hazard rate than not receiving
the Depo injection at discharge, although the association was not significant (adjusted HR = 0.88,
p = 0.544, 95% CI: 0.57-1.34). There was no significant interaction between receiving the Depo
injection at discharge and receiving Depo injections over time. Similarly, there was no
significant interaction between receiving the Depo injection at discharge and any other
contraceptive method variable. Clients who received the other methods of contraception did not
show statistically significant effects on time to RRP at α = 0.05. LARC showed a highly
protective but not statistically significant effect against RRP (adjusted HR = 0.05, p = 0.093,
95% CI: 0.002-2.26), but that protective effect decreased multiplicatively by about .25 with each
Table 6: Survival Rates over Time for Aim 1 Adjusted Model
Variable 6 Months 12 Months 18 Months
% 95% CI % 95% CI % 95% CI
Reference baseline a 89.1 84.0-94.4 74.4 65.4-84.7 59.4 47.7-73.9
Depo injection at discharge
94.2 91.0-97.5 85.8 79.3-92.9 76.3 66.7-87.4
Unplanned index pregnancy
94.1 91.8-96.4 85.0 81.5-89.9 76.0 70.2-82.4
Physical abuse during pregnancy
74.5 54.6-100 47.3 21.9-100 26.6 6.96-100
Postpartum depression score
0 92.2 88.2-96.3 81.3 73.6-89.8 69.4 58.6-82.2
6 b 85.5 78.8-92.8 67.2 56.0-80.6 49.5 36.3-67.6
Age at entry c 14 85.6 78.2-93.8 67.4 54.5-83.3 49.8 34.5-71.9 18 87.6 81.8-93.8 71.4 61.2-83.3 55.2 42.5-71.8 25 90.5 85.8-95.5 77.5 68.8-87.4 63.8 52.1-78.2 30 92.1 87.4-97.1 81.2 71.8-91.9 69.2 56.1-85.5 a All dichotomous variables set to 0, all continuous variables set to their mean
(postpartum depression score = 1.77, age = 21.9). b 90% quantile of the final sample
c Values chosen arbitrarily
When adjusting for all explanatory variables including the LARC interaction with time,
the HR for physical abuse during pregnancy decreased as the postpartum depression score
increased (At EDS = 0: HR = 5.05, 95% CI: 1.69-15.2; at EDS = 6: HR = 1.68, 95% CI:
0.62-4.55; at EDS = 6: HR = 0.67, 95% CI: 0.14-3.16). The 95% confidence intervals indicate that, at
lower EDS scores for postpartum depression, physical abuse during pregnancy had a significant
effect on time to RRP, but, at higher EDS scores, the effect of physical abuse during pregnancy
was no longer statistically significant. Figure 8 displays the interaction effect between physical
abuse during pregnancy and postpartum depression score on the cumulative hazard rates of time
to RRP. The top left panel shows that, with no risk of postpartum depression, physical abuse
during pregnancy results in a much higher hazard rate over time than no physical abuse during
(1.77), although the mean postpartum depression score indicates little risk of postpartum
depression. The bottom panel shows the cumulative hazard plot for clients in the 90% quantile of
postpartum depression scores (EDS = 6). For the clients experiencing that level of postpartum
depression, those who were physically abused actually had a lower hazard rate for time to RRP
than those who were not physically abused. For the purpose of estimating survival rates, the
adjusted model was fitted without a time-varying effect of LARC, so that receiving LARC had a
statistically insignificant adjusted HR of 1.13 (β = 0.12, p = 0.795, 95% CI: 0.45-2.85). Survival
rates for the adjusted model for Aim 2, without the time-varying effect of LARC, are given in
Table 7. For physical abuse during pregnancy, the survival rates displayed are at each level of