ScholarWorks @ Georgia State University
ScholarWorks @ Georgia State University
Kinesiology Dissertations Department of Kinesiology and Health
Spring 5-11-2012
Low Fitness Phenotype and Cardiovascular Disease Risks in
Low Fitness Phenotype and Cardiovascular Disease Risks in
African American Women
African American Women
Jurine H. Owen Mrs Georgia State University
Follow this and additional works at: https://scholarworks.gsu.edu/kin_health_diss
Recommended Citation Recommended Citation
Owen, Jurine H. Mrs, "Low Fitness Phenotype and Cardiovascular Disease Risks in African American Women." Dissertation, Georgia State University, 2012.
https://scholarworks.gsu.edu/kin_health_diss/10
This Dissertation is brought to you for free and open access by the Department of Kinesiology and Health at ScholarWorks @ Georgia State University. It has been accepted for inclusion in Kinesiology Dissertations by an authorized administrator of ScholarWorks @ Georgia State University. For more information, please contact
ACCEPTANCE
This dissertation, LOW FITNESS PHENOTYPE AND CARDIOVASCULAR DISEASE RISKS IN AFRICAN AMERICAN WOMEN, by JURINE HATTEN OWEN, was prepared under the direction of the candidate’s Dissertation Advisory Committee. It is accepted by the committee members in partial fulfillment of the requirements for the degree Doctor of Philosophy in the College of Education, Georgia State University. The Dissertation Advisory Committee and the student’s Department Chair, as representatives of the faculty, certify that this dissertation has met all standards of excellence and scholarship as determined by the faculty. The Dean of the College of Education concurs.
_____________________________ ____________________________ L. Jerome Brandon, Ph. D Rebecca Ellis, Ph. D.
Committee Chair Committee Member
_____________________________ _____________________________ Jeffrey C. Rupp, Ph.D. Lynda D. Woodruff, Ph.D.
Committee Member Committee Member
_____________________________ Date
_____________________________ Jacalyn L. Lund, Ph.D.
Chair, Department of Kinesiology and Health
______________________________ R. W. Kamphaus, Ph.D.
AUTHOR’S STATEMENT
By presenting this dissertation as a partial fulfillment of the requirements for the
advanced degree from Georgia State University, I agree that the library of Georgia State University shall make it available for inspection and circulation in accordance with its regulations governing materials of this type. I agree that permission to quote, to copy from, or to publish this dissertation may be granted by the professor under whose direction it was written, by the College of Education’s director of graduate studies and research, or by me. Such quoting, copying, or publishing must be solely for scholarly purposes and will not involve potential financial gain. It is understood that any copying from or publication of this dissertation which involves potential financial gain will not be allowed without my written permission.
NOTICE TO BORROWERS
All dissertations deposited in the Georgia State University Library must be used in
accordance with the stipulations prescribed by the author in the preceding statement. The author of this dissertation is:
Jurine Hatten Owen 2276 1st Avenue NE Atlanta, GA 30317
The director of this dissertation is:
Dr. Leslie Jerome Brandon Department of Kinesiology and Health
VITA
Jurine Hatten Owen
ADDRESS: 2276 1st Avenue NE Atlanta, GA 30317
EDUCATION:
PhD 2012 Georgia State University Sports Science
MS 1999 North Georgia College and State University Physical Therapy
BS 1994 Spelman College Natural Science
PROFESSIONAL EXPERIENCE:
2005-2011 Graduate Teaching Assistant Georgia State University 1999-Present Physical Therapist/Contractor
Metro Therapy Providers, Inc. 2004-2005 Physical Therapist/Contractor
PT for Kids, Inc.
2004-2005 Physical Therapist/Contractor Tandem Rehabilitation, Inc. 1995-1996 First Grade Interim Teacher
Atlanta Public Schools
PROFESSIONAL CREDENTIALS:
Licensed Practicing Physical Therapist, State of Georgia Heartsaver AED & CPR certified, American Heart Association
Neuro-Developmental Treatment certified, Neuro-Developmental Treatment Association
PROFESSIONAL SOCIETIES AND ORGANIZATIONS: American College of Sports Medicine
PUBLICATIONS AND PRESENTATIONS:
Owen, J.H., Brandon, L.J. Phenotype and cardiovascular disease morbidity and Mortality in multicultural populations. Presented at the 2011 Southeast Regional Chapter of the American College of Sports Medicine Annual Meeting, Greenville, South
Carolina.
Owen, J.H., Brandon, L.J. How does body composition relate to cardiovascular disease risk in African American women? Medicine & Science in Sports & Exercise, 42, S433. Presented at the 2010 American College of Sports Medicine Annual Meeting, Baltimore, Maryland.
Brandon, L.J., Owen, J.H. Impact of obesity on metabolic syndrome & CVD risk in African American women. Medicine & Science in Sports & Exercise, 42, S433. Presented at the 2010 American College of Sports Medicine Annual Meeting, Baltimore, Maryland.
Owen, J.H., Brandon, L.J. Relationship among measures of body composition and cardiovascular disease risk in African American women. Presented at the 2010 Southeast Regional Chapter of the American College of Sports Medicine Annual Meeting,
Greenville, South Carolina.
HONORS:
ABSTRACT
LOW FITNESS PHENOTYPE AND CARDIOVASCULAR DISEASE RISKS IN AFRICAN
AMERICAN WOMEN by
Jurine H. Owen
The purpose of this study is to determine if African American Women (AAW)
with low fitness levels have low fitness related to a lifestyle choice of decreased physical
activity (PA) or the cardiovascular disadvantage of greater proportion of Type II (FT)
muscle fibers.
Forty-eight apparently healthy AAW participated in the study. The women had
no known risk factors for CVD; were sedentary (no structured fitness training program
within last six months) or minimally fit (PA ≤ 3 x week for 20 minutes); and were not
taking any prescription medications for blood pressure, diabetes, or lipid control. On the
first visit the following measurements were taken: 1.) height and weight (electronic scale
and stadiometer); 2.) body fat percentage (dual energy x-ray absorptiometry (DXA %
body fat); and 3.) CRF (submaximal treadmill exercise test). On the second visit
additional measurements included: 1.) blood pressure (stethoscope and
sphygmomanometer); 2.) lipid profile and high sensitivity-C reactive protein (hs-CRP)
(Cholestech LDX analyzer); 3.) thigh anthropometric measurements; 4.) isokinetic power
and fatigue testing (KIN-COM dynamometer). Pearson product correlation coefficient
(r) was used to analyze the relationship between the variables.
The results indicated that gross oxygen consumption at 85% maximal heart rate
(VO2) was not significantly related to PA (r = -.06, p = .67) or FT fibers (r = 0.14, p =
pressure (r = -0.47, p < 0.01), diastolic blood pressure (r = -0.42, p < 0.01), and DXA %
body fat (r = -0.64, p < 0.01). There were no significant relationships between PA and
any of the variables. FT fibers were negatively correlated with low density lipoprotein (r
= -0.30, p < 0.05) and DXA % body fat (r = -0.46, p < 0.01).
In conclusion, low cardiorespiratory fitness in AAW does not seem to be a related
to reported levels of PA or proportion of FT fibers. This suggests that there may be other
factors that are contributing to the low levels of cardiorespiratory fitness observed in this
LOW FITNESS PHENOTYPE AND CARDIOVASCULAR DISEASE RISK IN AFRICAN
AMERICAN WOMEN by
Jurine Hatten Owen
A Dissertation
Presented in Partial Fulfillment of Requirements for the Degree of
Doctor of Philosophy in
Kinesiology in
The Department of Kinesiology and Health in
the College of Education Georgia State University
Copyright by Jurine H. Owen
ii
ACKNOWLEDGEMENTS
I would like to express my deepest gratitude to the members of my dissertation
committee for their continued guidance, support, and encouragement. I am thankful to
my advisor and chair, Dr. L. Jerome Brandon, for his insight, expertise, and counsel that
he provided throughout my graduate studies and this dissertation. I thank Dr. Jeffrey C.
Rupp for his invaluable input and knowledge that he shared, helping me to improve my
methodology. I also want to express my sincere appreciation to Dr. Rebecca Ellis for her
expertise and assistance with selecting the physical activity instrumentation for this study.
I am also earnestly grateful to Dr. Lynda D. Woodruff, for her mentorship, support, and
inspiration that she has given to me during this process and throughout my professional
career.
I want to thank Josh Keller (Hanson Medical, Inc.) and Bobby Hickman
(Isokinetic International) for their generosity and assistance with supplying the equipment
and maintenance necessary for data collection. I also thank all of the wonderful and
courageous women who participated in this study. For without their commitment and
compassion this study would not have been possible. I truly appreciate Dwayne Turner
for his information technology support.
Finally, I owe my greatest thanks to my husband Chuck, and our daughter, Sarah
Paisley, for their enduring love, kindness, and patience. And I would be remiss if I did
not express my gratitude to my mother, Mary Wright; mother-in-law, Emily Owen; and
my aunt, Darlene Jordan, for all the encouragement, love, and support they shared during
iii
TABLE OF CONTENTS
Page
List of Tables ... iv
Abbreviations ...v
Chapter 1 LOW FITNESS PHENOTYPE AND CARDIOVASCULAR DISEASE (CVD) RISKS IN AFRICAN AMERICAN WOMEN – A REVIEW ...1
Introduction ...1
Risk Factors: Hypertension, Obesity, Type II Diabetes ...2
The Low Fitness Phenotype ...5
Physical Activity, Cardiorespiratory Fitness, and CVD risks ...7
Skeletal Muscle Fiber Composition and Disease Risk ...9
Skeletal Muscle Fiber Identification using Isokinetic Testing ...10
Summary...13
References ...15
2 LOW FITNESS PHENOTYPE AND CARDIOVASCULAR DISEASE (CVD) RISKS IN AFRICAN AMERICAN WOMEN ...20
Methods ...22
Results ...28
Discussion...34
Conclusions ...41
References ...42
iv
LIST OF TABLES
Table Page
1 Physiological Characteristics of the Participants ...29
2 Physical Activity Categorical Score of Participants ...30 3 Risk Factors for CVD ...30 4 Relationships Among VO2max, Type II Muscle Fibers, and CVD risk Factors ..32 5 Relationships Among Physical Activity, Type II Muscle Fibers, and CVD Risk
Factors ...33 6 Relationship Between Proportion of Type II Muscle Fibers and CVD Risk
v
ABBREVIATIONS
AA African Americans
AAW African American Women
ACSM American College of Sports Medicine
APO A-I Apolipoprotein A-I
BMI Body Mass Index
BP Blood Pressure
CAD Coronary Artery Disease
CDC Centers for Disease Control and Prevention
CHD Coronary Heart Disease
CI Confidence Interval
cm Centimeter
CRF Cardiorespiratory Fitness
CVD Cardiovascular Disease
DBP Diastolic Blood Pressure
dl Deciliter
DXA Duel Energy X-Ray Absortiometry
FFMT Fat Free Mass of the Thigh
FG Fasting Glucose
FT Fast Twitch
G Grade
GXT Graded Exercise Test
h Height
HDL-C High Density Lipoprotein Cholesterol
vi
hs-CRP High Sensitivity C-Reactive Protein
IHS Indian Health Service
IPAQ-s International Physical Activity Questionnaire short form
kg Kilogram
LCR Low Capacity Running Rats
LDL-C Low Density Lipoprotein Cholesterol
LTPA Leisure Time Physical Activity
LV Left Ventricle
m Meters
mATPase Myosin Adenosine Triphosphatase
MET Metabolic Equivalent of Task
mg Milligrams
min Minutes
ml Milliliters
mm Millimeters
mmHg Millimeters of Mercury
mph Miles Per Hour
NHAMES National Health and Nutrition Examination Survey
NHIS National Health Interview Survey
PA Physical Activity
PAEE Physical Activity Energy Expenditure
PRE Progressive Resistance Exercise
P280/FFMT Power at Angular Velocity of 280◦ • s-1 normalized for Fat Free Mass
vii
P250/FFMT Power at Angular Velocity of 250◦ • s-1 normalized for Fat Free Mass
Of Thigh
r Pearson Product Correlation Coefficient
RM Repetition Maximum
RPE Ratings of Perceived Exertion
R1 Radius of the Base
R2 Radius of the Top
S Speed
SBP Systolic Blood Pressure
SD Standard Deviation
SPSS Statistical Package for Social Sciences
ST Slow Twitch
STF Slow Twitch Fibers
TC Total cholesterol
TC/HDL Total Cholesterol to High Density Lipoprotein Ratio
TRG Triglycerides
T55 Relative Torque Values of 55 Contractions
VL Vastus Lateralis
VO2 Gross Oxygen Consumption
wt Weight
yrs Years
CHAPTER 1
LOW FITNESS PHENOTYPE AND CARDIOVASCULAR DISEASE RISK IN
AFRICAN AMERICAN WOMEN – A REVIEW
Introduction
Cardiovascular disease (CVD) refers to any disease that affects the heart and
blood vessels and includes, but is not limited to, atherosclerosis, cardiomyopathy,
coronary artery disease, and peripheral vascular disease (1). The occurrence and
mortality rate of CVD is approaching epidemic proportions in women who are African
American (AAW) (2, 3). Although AAW have a higher incidence of select risk factors
for CVD, there have been no clear explanations to elucidate their increased likelihood of
developing the disease (4). One possibility observed in the research literature is that an
individual's level of physical fitness may influence their incidence of health
compromising risks and contribute to the development of chronic diseases such as CVD
(5, 6, 7). In addition, there have been a few studies that have shown a connection
between skeletal muscle fiber type and risks for CVD (8-13). The purpose of this review
of the literature is to discuss key risk factors for developing CVD in AAW; examine the
concept of the low fitness phenotype; discuss published literature investigating the
association between physical activity (PA) and CVD risks; review the published literature
on the relationship between skeletal muscle fiber type and disease risks; and examine the
Risk Factors: Hypertension, Obesity, and Type II diabetes,
Hypertension is a disease that is becoming more widespread around the world. In
the US, more than 58 million people are hypertensive and a relatively greater proportion
of these individuals tend to be of African American descent (6). As a group, 38.5% of
African Americans have hypertension as compared to only 28.9% of non-Hispanic
Caucasians. For African Americans between 40-59 years of age, 50% are hypertensive
as compared to 30% of Caucasians in the same age category (6). For AAW greater than
65 years of age, roughly 75% are hypertensive as compared to about 50% of Caucasian
women of similar age (6). The development of hypertension is a significant health risk
for AAW. Elevated blood pressure is a key risk factor for developing CVD as it can
facilitate adverse structural and functional changes of the heart; mechanical stress &
damage to arteries; and renal complications (6, 7). Quite often, hypertension is diagnosed
at a later age in African Americans; and it is not uncommon for many AAW to be
unaware that they are hypertensive and vulnerable to developing CVD (7). In the United
States, approximately 45% of AAW have some form of undiagnosed CVD as compared
to 32% of Caucasian women (7). The consequences of hypertension are more severe for
African Americans (AA) as they suffer from higher rates of morbidity and mortality as a
result of hypertension related stroke, CVD, and end stage renal disease. As compared to
the general population, AA experience an 80% higher stroke mortality rate, a 50% higher
CVD mortality rate, and a 32% higher end stage renal disease mortality rate as a
consequence of high blood pressure (6). Less access to preventative care and lower rates
of referral for preventative cardiac interventions are additional reasons for the greater
Obesity is another CVD risk factor that is disproportionately higher in AAW and
is a major comorbidity for chronic diseases in our society. It has been defined as the
“excessive accumulation of adipose tissue to the extent that health is impaired” (14). The
Centers for Disease Control and Prevention (CDC) reports that approximately 32.2% of
men and 35.5% of women were obese as indicated by data collected from the 2007-2008
National Health and Nutrition Examination Survey (NHAMES) (15). The combined
prevalence of overweight and obesity in the adult population in the United States is
approximately 68%, and of that percentage, a significant portion of these individuals are
AAW (15, 16). African American women have greater obesity rates than African
American men, and are two times more likely to be obese as compared to Caucasian
American women (17). This higher tendency toward obesity in AAW is significant as it
can precipitate a number of chronic disorders, such as hypertension, type-II diabetes,
cancer, and cardiovascular disease, and thus increase the rates of associated morbidity
and mortality (7, 16). However, the influence of obesity in the development of CVD in
AAW is not clear as many obese AAW do not exhibit abnormal lipid profiles which
precipitate CVD (18). Generally, CVD occurs as a consequence of increased levels of
triglycerides (TRG) & low density lipoprotein cholesterol (LDL-C) and decreased levels
of high density lipoprotein cholesterol (HDL-C), which promotes atherosclerosis and
atherogenesis (18). Many obese AAW have metabolically normal lipid profiles with low
levels of TRG, LDL-C, and high levels of HDL-C, but still they manage to have an
increased likelihood of developing CVD (18, 19). More research is warranted to unravel
The prevalence of non-insulin dependent or type 2 diabetes mellitus is growing
throughout the United States (20). In 2007, data collected from the 2003-2006 National
Health and Nutrition Examination Survey (NHAMES), 2004-2006 National Health
Interview Survey (NHIS), 2005 Indian Health Service (IHS), and 2007 resident
population estimates, indicated that 23.6 million Americans have either diagnosed or
undiagnosed type 2 diabetes (17). Of those 23.6 million Americans with diabetes, ethnic
minority groups have a disproportionately greater percentage of the disease (20). For
example, the prevalence rate for type 2 diabetes is 1.6 times higher in AA (6, 17). In
particular, AAW demonstrate a greater susceptibility to diabetes, which appears to be
related to higher levels of physical inactivity and obesity. (17, 21, 22). About one third of
the difference for the rate of diabetes among AAW and Caucasian women has been
attributed to differences in obesity levels (21). Diabetes is a significant risk factor for the
development of CVD. It contributes to pathological changes that produce lesions in the
vascular system which can initiate myocardial dysfunction and atherosclerotic changes
(23). Diabetic individuals are two to five times more likely to develop coronary artery
disease (CAD), stroke, or peripheral vascular disease (23). The presence of type II
diabetes, obesity, and hypertension has an important influence on the occurrence of CVD,
and since AAW have increased rates of each of these risks it is not surprising that they
are one of the minority groups critically affected (6).
It is clear that AAW have a greater predisposition to various risk factors
associated with CVD. What is not easily understood is the reason for this predisposition.
Speculation has been made regarding the influence of physical fitness on the
associated with CVD (5, 6, 7). Relatively high levels of fitness have been found to be
beneficial in lowering the occurrence and severity of chronic disorders such as
hypertension, diabetes, lipid disorders, metabolic syndrome and cardiovascular disease
(6). Conversely, low levels of fitness have been shown to predispose individuals to
chronic disorders thus making it a contributing risk factor.
Apparently, AAW have a physical constitution (phenotype) that makes them more
vulnerable to CVD than other populations. Phenotype refers to the physical appearance
of an individual that is influenced by their genetics, environment, and behavior or
lifestyle choices (1). This suggests that an admixture of genetics, environment, cultural
preferences, and lifestyle behaviors may be contributors to the observed predisposition
toward CVD in AAW. Several studies have demonstrated that AAW are relatively
physically inactive and that they are comfortable with having a body shape that is mildly
heavier and fuller than those typically desired by Caucasian women (18). In addition,
AAW have exhibited lower levels of fitness as compared to African American men and
Caucasian men and women (18, 24-29). Hence, low fitness may be a contributing factor
and a particular aspect of their phenotype that influences their prevalence and severity of
select CVD risks (30). There is a need to better understand the impact of low fitness and
how different factors that determine low fitness might impact the health of AAW.
The Low Fitness Phenotype
The concept of the low fitness phenotype offers physiologic suggestions for lower
fitness levels that are based on an individual's intrinsic capacity for oxidative metabolism,
two proposed hypotheses for the low fitness phenotype. The first hypothesis includes the
metabolically "normal" individuals who have lower levels of physical fitness due to
inactive lifestyles as opposed to inherited factors related to oxidative metabolism (30).
These individuals are at increased risk for CVD and metabolic disorders as a result of a
sedentary lifestyle that is not due to the metabolic properties of the skeletal muscle that
can influence the risk for chronic diseases. The second hypothesis includes the
metabolically "disregulated" individuals who have an inborn impaired metabolic capacity
that influences their behavior and metabolism (30). Their fitness is based on their
intrinsic capacity for oxidative metabolism. The impaired oxidative capacity in turn
facilitates lower levels of baseline fitness, low capacity and tolerance for work, and
smaller improvements in fitness in response to endurance exercise stimuli. These
individuals are more likely to adopt a sedentary lifestyle due to easy fatigability,
difficulty performing endurance physical activity, and a diminished perception that
physical activity is beneficial (30). For this group there is a greater risk for CVD and
metabolic disorders as the sedentary lifestyle is compounded by the impaired oxidative
capacity of the muscle thus creating a more severe situation (30).
Animal studies that have investigated the impact of skeletal muscle fiber type on
disease risks have used untrained selectively bred rats that were specifically bred to have
a high intrinsic aerobic capacity (greater % of type I fibers) or a low intrinsic aerobic
capacity (lower % of type I fibers) for running (31-34). The most significant findings
from these studies have shown that the low capacity running rats (LCR) had a severe
CVD risk profile as they had higher blood pressures, insulin resistance and fasting
al. (33) found that the LCR demonstrated up-regulation of a gene that is similar to
mutated leucyl-transfer RNA in humans. Overexpression of this gene in humans is
associated with structural and functional changes in mitochondrial proteins that can cause
impaired oxygen uptake, hyperglycemia, and exercise intolerance, and subsequently lead
to metabolic dysfunction (33). Since the majority of literature supporting this idea has
been studied in rats its application to humans is limited. However, this hypothesized idea
appears to have possibilities for AAW.
Physical Activity, Cardiorespiratory Fitness, and CVD Risks
Physical activity (PA) and cardiorespiratory fitness (CRF) are often used
synonymously when referring to an individual’s level of physical fitness. Physical
activity generally refers to any form of muscular activity in which energy is expended
proportional to the amount of muscular work (35). Cardiorespiratory fitness represents
the ability to perform moderate to vigorous intensity exercise using large muscle groups
for an extended period of time (36). It involves the collective interaction of the
cardiovascular, respiratory, and skeletal muscle systems (36). The literature is replete
with investigations providing support of the inverse relationships among PA, CRF, and
the risk of developing CVD. Both PA and CRF have been reported to be significant
predictors for all-cause and cardiovascular mortality in both men and women (35, 36). In
the late 1980s, a group of researchers led by Steven N. Blair performed a series of
prospective studies investigating the association between cardiorespiratory fitness and
precursor of cardiovascular disease and all- cause mortality (37-40) in men and women.
maximal treadmill exercise testing, the authors determined that low fitness was associated
with increased risk of CVD mortality and was a significant indicator of all-cause
mortality. They also found that improvements in CRF were associated with a decrease in
risks for CVD and mortality. In their conclusion, the author’s noted that improvements in
physical fitness can offer a protective effect against risk factors for CVD and premature
death (37-40).
Numerous other studies have also demonstrated that physical inactivity and low
levels of CRF, exclusive from other risk factors, are indeed significant independent risk
factors for CVD and related mortality. Haapanen-Niemi and colleagues (41) in a 16 year
prospective study examined the independent association of BMI, leisure time physical
activity (LTPA), and physical fitness with CVD mortality. They determined that BMI
was not an independent predictor of all-cause and CVD mortality. However, low levels
of LTPA and physical fitness and function were significant independent risk factors for
all-cause and CVD mortality in both middle aged and elderly men and women (41). In
2007, Nocon and colleagues (42) conducted a meta-analysis of 33 prospective cohort
studies examining the association of physical activity with all cause and cardiovascular
mortality. Nearly all the studies included in the analysis demonstrated that physical
activity significantly reduced risks for all cause and CVD mortality by 33% (95%
confidence interval (CI), 28%-37%) and 35% (95% CI, 30%-40%), respectively. Lower
risk reductions were found in studies that used objective testing procedures such as a
cardiorespiratory fitness test rather than self-report questionnaires. In healthy
premenopausal women, Abdulnor et al. (43) examined the relationship between
predictor of anthropometric and metabolic risks associated with CVD. Instead they
found that VO2peak was a better predictor to determine the risks for CVD in healthy
pre-menopausal women (43).
Higher levels of physical activity and CRF have also been found to be associated
with decreasing various risk factors for CVD and CVD mortality. Lavoie et al. (44)
found significantly lower levels of hs-CRP (-21.5%, p<0.05) and haptoglobin (-20.3%,
p<0.05) for sedentary overweight/obese women with higher levels of physical activity
energy expenditure (PAEE) (1276 kcal·day-1) as compared to sedentary overweight/obese
women with lower levels of PAEE (587 kcal·day-1). In addition, PAEE was the only
predictor of hs-CRP (r2 = 0.14, p < 0.05) and haptoglobin (r2 = 0.04, p < 0.05),
accounting for 14% and 4% of the variance, respectively (44). Lee et al. (45) reported
that all-cause mortality and CVD mortality is reduced in individuals with moderate to
high levels of CRF; and that improvement in CRF is associated with lower risk of
all-cause and CVD mortality. These observations were seen in both men and women even
after adjusting for other CVD risk factors, including age, smoking status, ethnicity,
adiposity, alcohol intake, and health status (45).
Skeletal Muscle Fiber Composition and Disease Risk
The association between skeletal muscles fibers and risk factors for chronic
diseases has not been studied extensively. The majority of published studies
investigating the relationship were performed by one group of researchers who conducted
several cohort studies (8-13). Although the data are limited, the results of these studies
muscle fibers (STF) and various health outcomes associated with risk for chronic
diseases, particularly CVD. These authors found that a low percentage of STF is
associated with increased blood pressure, increased insulin resistance, weight gain,
decreased serum HDL-C and apolipoprotein A-I (apo A-I), and adverse changes in left
ventricle (LV) structure and function (8-13). In regards to the observations between
percentage of STF with weight gain and HDL-C, the authors suggest that these
relationships may be influenced by the oxidative capacity of the muscle fibers and the
ability to metabolize fatty acids (8, 9). In addition, the oxidative properties of skeletal
muscle fibers are important factors to consider when assessing risk for CVD and should
be included in the risk profile with other known risk factors (10). While these studies
provide convincing evidence of a relationship between skeletal muscle fiber type and
CVD risk, it is important to mention that the authors did not recruit a diverse group of
subjects and in every study they examined men who were of Finnish descent.
Skeletal Muscle Fiber Identification using Isokinetic Testing
Skeletal muscle fibers can be identified according to histochemical,
morphological, and physiological properties (46). Most invasive procedures involve
obtaining several tissue samples at various depth of the muscle via muscle biopsy; and
then the fiber types are identified using histochemical staining methods (46-49). The
most commonly used technique is immuno-histochemical method which allows for
identification of myosin adenosine triphosphatase (mATPase) proteins through the use of
antibody specificity (46). Although muscle biopsy is considered to be the gold standard
number of biopsies required for determination of muscle fiber type composition; and
extreme variability in proportion of fiber types within a whole muscle, it is not the most
clinically applicable technique (47-49). A less invasive testing procedure could provide a
more practical alternative for estimation of fiber type proportion within a whole muscle.
Isokinetic testing has been documented as being a useful and reasonable functional test
for examining the contractile properties of skeletal muscle (51-55). The use of isokinetic
testing to examine the relationship between force velocity and muscle fiber type
composition has been examined repeatedly in the research literature. Some investigators
have found it to be a practical noninvasive procedure that can assist with distinguishing
between the basic properties of Type I and Type II fibers within a muscle through the
assessment of power output at various angular velocities (53-55).
In 1976, Thorstensson et al. investigated the relationship between force-velocity
and fiber composition in human knee extensor muscle (51). They found that muscles
with a greater percentage or relative area of fast twitch (FT) fibers can produce a great
amount of force at high angular velocities. This was the first study to demonstrate these
findings in humans, and corroborate similar findings observed only in animal studies
(51). Since this classic study, other studies have been completed and have reported
similar outcomes. Coyle et al. (52) reported that men with predominately FT fibers were
able to produce greater relative peak torque values than those with predominately ST
fibers at high angular velocities (115◦ • s-1, 200◦ • s-1, 287◦ • s-1, 400◦ • s-1); and muscle
fiber composition becomes increasingly more related to power production as the speed of
movement increased (52). Similarly, Ivy et al. (53) discovered that men with greater
power. However, they also found that greater percentages of FT fibers significantly
influenced the rate of power production and the relative work performed during an
isokinetic contraction. It was also suggested that 180◦ • s-1 is the best speed for
determining muscle fiber composition from an isokinetic knee exercise (53).
Although isokinetic testing is useful for distinguishing between the basic
contractile properties of type I and type II fibers, estimations of proportion of fiber types
within the muscle are only possible if accompanied with muscle biopsies. Suter et al.
(54) sought to develop a non-invasive method that would allow for estimation of
proportion of type II fibers using isokinetic testing. They found that fatigue testing and
power testing at different angular velocities were the best functional tests to yield
reasonable estimates of fiber type distribution in the vastus lateralis (VL). They derived a
regression equation that utilizes relative torque after 53-55 contractions on a fatigue test
and power output at an angular velocity of 280◦ • s-1 normalized for fat free mass of the
thigh to estimate proportion of type II fibers of VL. The final regression model had a
significant correlation (r = 0.72, p < 0.01) with the muscle biopsies of VL and the
standard error of prediction was 8.1% (54).
Douris et al. (55) were the first to use the Suter equation as a non-invasive fiber
typing procedure to assess the relationship between fiber type and performance on a one
repetition maximum (RM) test in untrained women. They found a significant
relationship between proportion of fiber type and performance as the women have a
Summary
The presence of CVD is on the rise in AAW, and as a result the morbidity and
mortality rates from CVD have increased. Data from several investigations have shown
that AAW have a greater incidence of hypertension, obesity, and type II diabetes, which
are key risk factors for developing CVD. These characteristics, along with sedentary
behavior, raise the question as to whether AAW have a particular phenotype that makes
them more susceptible to the development of CVD.
The concept of the low fitness phenotype offers metabolic possibilities related to
skeletal muscle oxidative capacity, which is directly associated to muscle fiber type, that
may partially explain why certain populations have low fitness and are more susceptible
to developing CVD. Unfortunately the majority of the studies that offer support of this
idea have been conducted in rats so its applicability to humans is unclear and limited.
None-the-less the idea does offer clues to possible answers as there have been numerous
published studies in both men and women demonstrating that low levels of
cardiorespiratory fitness and physical activity are associated with an increased risk of
CVD and all-cause mortality (37-45). In addition, there is reason to consider the
influence of muscle fiber type on the development of risk factors for CVD as several
studies using male participants have shown that a greater proportion of type I fibers is
associated with an increase in blood pressure, weight gain, insulin resistance, and various
other metabolic risk factors.
Attempting to identify possible answers to AAW’s predisposition to CVD is
going to require collaborative efforts on several research fronts. There is certainly a need
in addition to examining the influence of muscle fiber type on the development of CVD
risk factors. Future research is warranted and perhaps novel studies should consider
investigating these relationships in AAW and using practical non-invasive procedures
References
1.) Taber's cyclopedic medical dictionary. edited by CL Thomas. Philadelphia, PA: F.A. Davis Co., 1993, p. 344&1493.
2.) Borgman M, McErlean E. What is metabolic syndrome: prediabetes and cardiovascular risk. J Cardiovasc Nurs. 2006;21(4):285-90.
3.) Despres JP. Cardiovascular disease under the influence of excess visceral fat. Crit Pathw Cardiol. 2007;6(2):51-9.
4.) Clark LT, El-Atata F. Metabolic syndrome in African American: implications for preventing coronary heart disease. Clin Cardiol. 2007;30(4):161-164.
5.) Gaillard T, Schuster D, Osei K. Differential impact of serum glucose, triglycerides, and high-density lipoprotein cholesterol on cardiovascular risk factor burden in nondiabetic, obese African American women: implications for the prevalence of metabolic syndrome. Metabolism. 2010; Jan 4. [Epub ahead of print]
6.) Jones-Burton C, Saunders E. Cardiovascular disease and hypertension. In Satcher D, Pamies RJ, eds. Multicultural Medicine and Health Disparities. New York, NY: McGraw Hill; 2006:167-170.
7.) Williams R. Cardiovascular disease in African American women: a health care disparities issue. J Natl Med Ass. 2009; 101(6): 536-540.
8.) Tikkanen HO, Härkönen M, Näveri H, Hämäläinen E, Elovarino R, Sarna S, et al. Relationship of skeletal muscle fiber type to serum high density lipoprotein cholesterol and apolipoprotein A-I levels. Atherosclerosis. 1991; 90:49-57.
9.) Tikkanen HO, Näveri H, Härkönen M. Skeletal muscle fiber distribution influences
serum high density lipoprotein cholesterol level. Atherosclerosis. 1996; 120:1-5.
10.) Tikkanen HO, Hamalainen E, Sarna S, Adlercreutz H, Härkönen M. Associations
between skeletal muscle properties, physical fitness, physical activity and
coronary heart disease risk factors in men. Atherosclerosis. 1998; 137(2):377-89.
11.) Tikkanen HO, Hämälinen E, Härkönen M. Significance of skeletal muscle properties
on fitness, long-term physical training and serum lipids. Atherosclerosis. 1999; 142:367-378.
12.) Hernelahti M, Tikkanen HO, Karjalainen J, and Kujala UM. Muscle fiber type distribution as a predictor of blood pressure: a 19 year follow-up study.
13.) Karjalainen J, Tikkanen H, Hernelahti M and Kujala UM. Muscle fiber type distribution predicts weight gain and unfavorable left ventricular geometry: a 19 year follow-up study. BMC Cardiovascular Disorders. 2006; 6:2-8.
14.) http://www.apta.org/rt.cfm/Education/Continuing_Education/obesity
15.) Flegal KM, Carroll MD, Ogden CL, Curtin LR. Prevalence and trends in obesity among US adults, 1999-2008. JAMA. 2010; 303(3):235-241.
16.) Nelson TL, Brandon DT, Wiggins SA, Whitfield KE. Genetic and Environmental Influences on Body fat measures among African-American twins. Obes Res 2002; 10:733-739.
17.) Tilghman J. Obesity and diabetes in African American women. ABNF Journal
May/Jun2003;14(3):66-68.
18.) Allison DB, Edlen-Nezin L, Clay-Williams G. Obesity among African American women: prevalence, consequences, causes, and developing research. Women’s
Health. 1997; 3(3-4):243-74.
19) Henry-Okafor Q, Cowan PA, Wicks MN, Rice M, Husch DS, Khoo MS. Effect of obesity on cardiovascular disease risk factors in African American women. Biol Res Nurs. 2011 [Epub ahead of print].
20.) http://www.cdc.gov/diabetes/pubs/pdf/ndfs_2007.pdf
21.) Okosun IS. Racial Differences in Rates of Type 2 Diabetes in American Women: How Much is Due to Differences in Overall Adiposity? Ethn Health. 2001; 6(1):27-34.
22.) Cowie CC, Harris MI, Silverman RE, Johnson EW, Rust KF. Effect of multiple risk factors on differences between blacks and whites in the prevalence of non-insulin-dependent diabetes mellitus in the united states. Am J Epidemio. 1993;137(7):719-732.
23.) Dagogo-Jack S, Gavin III JR. Diabetes. In Satcher D, Pamies RJ, eds. Multicultural Medicine and Health Disparities. New York, NY: McGraw Hill; 2006:187-188.
24.) Macera CA, Croft JB, Brown DR, Ferguson JE, Lane MJ. Predictors of adopting leisure-time physical activity among biracial community cohort. Am J Epidemiol. 1995; 142(6):629-635.
26.) Lewis CE, Raczynski JM, Heath GW, Levinson R, Cutter GR. Physical activity of public housing residents in Birmingham, Alabama. Am J Public Health. 1993; 83(7):1016-1020.
27.) Crespo CJ, Keteyian SJ, Heath GW, Sempos CT. Leisure time physical activity among US adults. Results from the Third National Health and Nutrition Examination Survey. ArchIntern Med. 1996; 156(1):93-98.
28.) Kelley GA, Kelley KS. Physical activity habits of African-American college students. Res Q Exerc Sports. 1994; 65(3):207-212.
29.) Tuten C, Petosa R, Sargent R, Weston A. Biracial differences in physical activity and body composition among women. Obes Res. 1995; 3(4):313-318.
30.) Church T. The low fitness phenotype as a risk factor: more than just being sedentary. Obesity. 2009;17(3):S39-42.
31.) Koch LG, Britton SL. Artificial selection for intrinsic aerobic endurance running capacity in rats. Physiol Genomics. 2001; 5(1):45-52.
32.) Wisløff U, Najjar SM, Ellingsen Ø, Haram PM, Swoap S, Al-Share Q, et al. Cardiovascular risk factors emerge after artificial selection for low aerobic capacity. Science. 2005; 307:418-420.
33.) Bye A, Høydall MA, Catalucci D, Langaas M, Kemi OJ, Beisvaq V, et al. Gene expression profiling of skeletal muscle in exercise-trained and sedentary rats with inborn high and low VO2max. Physiol Genomics. 2008; 35:213-221.
34.) Thyfault JP, Rector RS, Uptergrove GM, Borengasser SJ, Morris EM, Wei Y, et al. Rats selectively bred for low aerobic capacity have reduced hepatic mitochondrial oxidative capacity and susceptibility to hepatic steatosis and injury. J Physiol. 2009; 587(8):1805-1816.
35.) Powers SK, ET. Exercise Physiology: Theory and application to fitness and performance. 7th edition. New York: McGraw-Hill; 2009.
36.) American College of Sports Medicine. ACSM’s guidelines for exercise testing and
prescription, 7th edition. Philadelphia, PA: Lippincott Williams & Wilkins; 2006.
38.) Blair SN, Kohl HW 3rd, Paffenbarger RS Jr, Clark DG, Cooper KH, Gibbons LW. Physical fitness and all-cause mortality. A prospective study of healthy men and women. JAMA. 1989; 262:2395-2401.
39.) Blair SN, Kohl HW 3rd, Barlow CE, Paffenbarger RS Jr, Gibbons LW, Macera CA. Changes in physical fitness and all-cause mortality. A prospective study of healthy and unhealthy men. JAMA. 1995; 273:1093-1098.
40.) Blair SN, Kampert JB, Kohl HW 3rd, Barlow CE, Macera CA, Paffenberger RS Jr. Influences of cardiorespiratory fitness and other precursors on cardiovascular disease and all-cause mortality in men and women. JAMA. 1996; 276:205-210.
41.) Haapanen-Niemi N, Miilunpalo S, Pasanen, Vuori I, Oja P, Malmberg J. Body mass index, physical inactivity and low level of physical fitness as determinants of all-cause and cardiovascular disease mortality-16y follow-up of middle-aged and elderly men and women. Int J Obes. 2000; 24:1465-1474.
42.) Nocon M, Hiemann T, Müller-Riemenschneider F, Thalau F, Roll S, Willich SN. Association of physical activity with all-cause and cardiovascular mortality: a systematic review and meta-analysis. Eur J Cardiovasc Prev Rehabil. 2008;
15(3):239-246.
43.) Abdulnour J, Boulay P, Brochu M, Rabasa-Lhoret R, Yasari S, Prud’homme D. Relationship between the percentage of predicted cardiorespiratory fitness and cardiovascular disease risk factors in premenopausal women: a MONET study.
Climacteric. 2010; 13(4):347-54.
44.) Lavoie ME, Rabasa-Lhoret R, Doucet E, Mignault D, Messier L, Bastard JP, et al. Association between physical activity energy expenditure and inflammatory markers in sedentary overweight and obese women. Int J Obes. 2010; 34:1387-1395.
45.) Lee DC, Artero EG, Sui X, Blair SN. Mortality trends in the general population: the importance of cardiorespiratory fitness. J Psychopharmacol. 2010; 24(4
Suppl):27-35.
46.) Leiber RL. Skeletal muscle structure, function: Implications for rehabilitation and sports medicine. Baltimore, MD: Williams and Wilkins, 1992.
47.) Lexell J, Taylor C, Sjöström M. Analysis of sampling errors in biopsy techniques using data from whole muscle cross sections. J Appli Physiol. 1985; 59(4):1228-1235.
49.) Lexell J, Taylor CC. Variability in muscle fibre areas in whole human quadriceps muscle. How much and why? Acta Physiol Scand. 1989; 136(4):561-568.
50.) Baguet A, Everaert I, Hespel P et al. A new method for non-invasive estimation of human muscle fiber type composition. Plos One. 2011; 6(7):e21956.
51.) Thorstensson A, Grimby G, Karlsson J. Force-velocity relations and fiber
composition in human knee extensor muscles. J Appl Physio. 1976;40(1):12-16.
52.) Coyle E, Costill D, Lesmes G. Leg extension power and muscle fiber composition.
Med Sci Sports Exer. 1979;11(1):12-15.
53.) Ivy J, Withers R, Brose G, Maxwell BD, Costill DL. Isokinetic contractile properties of the quadriceps with relation to fiber type. Eur J Appl Physiol. 1981;47:247-255.
54.) Suter E, Herzog W, Sokolosky J, Wiley J, Macintosh B. Muscle fiber type
distribution as estimated by cybex testing and by muscle biopsy. Med Sci Sports Exer. 1993;25(3):363-370.
Chapter 2
LOW FITNESS PHENOTYPE AND CARDIOVASCULAR DISEASE RISKS IN
AFRICAN AMERICAN WOMEN
Cardiovascular disease (CVD) refers to any disease that affects the heart and
blood vessels and includes, but is not limited to, atherosclerosis, cardiomyopathy,
coronary artery disease, and peripheral vascular disease (1). The prevalence of CVD is
approaching epidemic proportions among many minority populations, including African
American women (AAW) (2, 3). African American women have a higher prevalence of
certain risk factors associated with CVD (inactivity, hypertension, obesity, and diabetes);
and therefore have a greater occurrence and mortality rate from the disease(4, 5, 6).
Despite these observations, there seems to be a paucity of information that can explain
why AAW are more predisposed to developing CVD.
One risk for developing chronic diseases is linked to level of cardio-respiratory
fitness (5, 7, 8). Several studies have demonstrated that low levels of cardiorespiratory
fitness and physical activity are associated with an increased risk of CVD (5, 9-17).
Some have demonstrated that a low level of cardiorespiratory fitness alone is a strong
independent predictor of CVD mortality (12, 13, 17). Although AAW have been found
to be more sedentary and inactive than their Caucasian peers, it is unclear whether
physical inactivity is enough to explain their susceptibility to CVD (18-24).
A relatively new concept, the low fitness phenotype, suggests that parameters
other than an inactive lifestyle are responsible for the manifestation of sedentary
behaviors. Phenotype refers to the physical characteristics of an individual that is
choices (1). The author of the low fitness phenotype, Tim Church (25), suggests that
there may be metabolic differences related to skeletal muscle fiber type that may
contribute to low cardiorespiratory fitness. In essence there are two types of skeletal
muscle fibers, type I or slow twitch fibers, and type II or fast twitch fibers. Type I fibers
have a high quantity of oxidative enzymes and therefore a greater capacity for oxidative
metabolism. Type II fibers have a high quantity of glycolytic enzymes and a lower
number of oxidative enzymes, and thus a limited capacity for oxidative metabolism (26).
Conceivably, low fit individuals may have an intrinsically low oxidative capacity and
cardiorespiratory fitness due to skeletal muscle fiber type, which induces sedentary
behavior as a result of rapid fatigability they experience with endurance physical activity.
Thus, they adapt sedentary lifestyles that subsequently predispose them to developing
risk factors for CVD (25).
Studies investigating an association between skeletal muscle fibers and risk
factors for chronic disease provide support of a positive relationship between these
variables. These studies have shown that a low percentage of type I fibers is associated
with increased blood pressure, increased insulin resistance, weight gain, decreased serum
HDL-C and apolipoprotein A-1 (apo A-I), and adverse changes in left ventricle (LV)
structure and function (27-32). However, these studies are limited and lack diversity as
they were completed by a group of researchers who conducted a series of cohort studies
utilizing only men of Finnish descent. The literature is void of studies investigating the
idea of the low fitness phenotype and subsequently, the influence of muscle fiber type on
the development of risk factors for CVD in AAW. Therefore the purpose of this study,
lifestyle choice of decreased physical activity (PA) or greater proportion of Type II (FT)
muscle fibers. The relationships between cardiorespiratory fitness and CVD risks, and
type II fibers and CVD risks will also be assessed.
Hypothesis: Low cardiorespiratory fitness levels among AAW will be associated
with low levels of PA instead of a greater percentage of fast twitch fibers. In addition, it
is hypothesized that low cardiorespiratory fitness will also be associated with several risk
factors associated with CVD.
Methods
Participants: Fifty AAW volunteered to participate in the study. The participants
were recruited via posted advertisements placed around the Georgia State University
campus, local coffee shops and eateries, and various government buildings. Criteria for
admission into the study included that the women be: 1.) African American between the
ages of 18-60; 2.) have no known risk factors for CVD; and 3.) were sedentary (no
structured exercise program within last six months) or minimally active (PA ≤ three times
a week for 20 min). Women were excluded from participating if: 1.) they had CVD; 2.)
were taking blood pressure (BP), lipid, or diabetes medications; 3.) unable to participate
in isokinetic or cardiorespiratory fitness testing; or 4.) were involved in a regular exercise
program. The Institutional Review Board of Georgia State University approved this
study and all participants read and signed the informed consent prior to participation.
Testing Procedures: The participants were asked to volunteer their time for two
testing sessions on two different days. During visit one the subjects completed a health
Questionnaire short form - IPAQ-s). They also completed the following measurements:
1.) height and weight; 2.) dual energy X-ray absorptiometry (DXA) body composition
assessment; and 3.) cardiorespiratory fitness testing. During visit two the following
measurements were completed: 1.) blood pressure and lipid profile including hs-CRP and
2.) anthropological measurement for determination of proportion of type II fibers (via
regression equation) and isokinetic testing.
Assessment of Height and Weight. Height was measured using a stadiometer
(graduated staff used for measuring length) and body weight was assessed using a
calibrated electronic beam scale with a digital readout to the nearest 0.1 kilogram (kg).
Weight expressed in kilograms divided by height in meters squared was used to calculate
body mass index (BMI).
Measurement of Body Composition. Percent body fat measured by a Lunar
DPX-L dual-energy X-ray absorptiometer (model DPX-L with version 3.6R software,
Lunar Radiation Corp., Madison, WI) was used as the standard for obesity assessment in
this study. This is a non-invasive procedure where measurements are taken as the subject
lies in a supine position on a table. Low non-harmful amounts of radiation are emitted
during body fat assessments. This procedure uses a three-compartment model (bone, fat
and lean soft tissue) and makes the assumption that the hydration of the mineral-free lean
tissue is constant at 0.73 ml.g-1. Dual-energy X-ray absorptiometry (DXA) is able to
provide segmental parts and total body estimates of bone, fat and lean tissue by
measuring the attenuation of two energies of X-rays through the body. The amount of
absorbed energy from the X-ray source is used to determine body fat percentages. DXA
different scan speeds exist and are based on subject size. DXA software has the
capability of adjusting for subject gender, race and age. Dual-energy X-ray
absorptiometer scanners are reported to accurately estimate soft tissue composition with a
precision of 1% to 1.5% (33).
Assessment of Physical Activity. Self- reported physical activity was measured
by the short form of the International Physical Activity Questionnaire (IPAQ-s). The
IPAQ-s is a valid instrument for assessing self-reported physical activity (34-37).
Specifically among AAW the IPAQ-s was moderate correlated with accelerometry (37).
Subjects were asked to recall any form of PA that they participated in for at least 10
minutes over the last seven days, and indicate how much time they spent performing
those activities (i.e. days per week, hours and minutes per day). Three specific types of
activities (walking, moderate-intensity, and vigorous physical activity) were assessed and
the metabolic equivalents of the task (MET)-minutes per week (MET-min/week) for each
type of activity was calculated using the following formulas (38):
Walking MET-min/week = 3.3 * walking min. * walking days
Moderate MET-min/week = 4.0 * moderate intensity activity min * moderate
days
Vigorous MET-min/week = 8.0 * vigorous intensity activity min * vigorous days
The summation of MET-min/week for walking, moderate intensity, and vigorous
intensity PA was used to calculate total PA scores for each subject. Based on their
individual total PA score, subjects were classified into three categories: inactive (PA
min/week), or health enhancing physical activity (PA score ≥ 3000
MET-min/week) (38).
Assessment of cardiorespiratory fitness. Performance on submaximal graded
exercise test (GXT) using the treadmill was completed to determine cardiorespiratory
fitness. Using the Standard Balke protocol for normal sedentary subjects, the women
walked on the treadmill, initially performing a brief warm-up followed by several two
minute work stages. The women walked at a speed of 3.0 miles per hour (mph) and
every two minutes the stages increased in difficulty as the incline of the treadmill
increased by 2.5% grade. Ratings of perceived exertion (RPE) were taken 15 seconds
prior to the end of each work stage. Cessation of testing occurred once subjects' reached
85% of their maximal predicted heart rate. Testing would have been discontinued if there
were any abnormal exercise responses, but this did not occur. Subjects were given a 10
minute cool down following completion of testing. An estimation of their gross oxygen
consumption at 85% max heart rate (VO2) was calculated and used as an indicator of
their cardiorespiratory fitness. It was determined using the American College of Sports
Medicine’s (ACSM) standard formula for treadmill walking (39):
VO2 (ml·kg-1·min-1) = (0.1·S) + (1.8·S·G) + 3.5 ml·kg-1·min-1 , where S is speed
in m/min and G is % grade.
Measurement of blood pressure. Blood pressure was measured on the right arm
with a stethoscope and sphygmomanometer after 10 minutes of quite sitting. Blood
pressures were measured twice and the mean value was calculated and used as the blood
Measurements of lipid profile and hs-CRP. Finger sticks of the subjects’
middle finger were performed (using 2.2mm lancet) to collect blood samples for fasting
glucose, lipids, and hs-CRP profiles. Although fasting time for analysis of glucose and
lipids is frequently about 12 hours (40), subjects were asked to fast at least four hours to
be postprandial before blood testing. Blood samples were collected in three 40 µl
Cholestech LDX capillary tubes (Hanson Medical Systems, Inc, Winter Park, FL). A
Cholestech LDX capillary plunger was used to insert the samples into a LDX Lipid
Profile plus Glucose cassette (Hanson Medical Systems, Inc., Winter Park, FL) and a
LDX hs-CRP cassette (Hanson Medical Systems, Inc., Winter Park, FL). The cassettes
were placed into the Cholestech LDX analyzer and analyzed for fasting glucose (FG),
total cholesterol (TC), high density lipoprotein (HDL), low density lipoprotein (LDL),
triglycerides (TRG), TC/HDL ratio, and high sensitivity C-reactive protein (hs-CRP).
Fasting glucose and lipid profiles were performed in duplicate.
Anthropological measurement of the thigh. Circumferential and length
measurements of the subjects right leg were taken to determine fat free mass of the thigh
(FFMT) as detailed by Suter et al. (41) for the regression equation. Circumferential
measurements were taken using a flexible plastic tape measure at two sites:
subtrochanteric and supra patellar. Length measurements were taken from the
subtrochanteric to supra patellar areas. Values were recorded to the nearest 0.1
centimeter (cm). Fat free mass of the thigh was determined by calculating density and
volume of the thigh.
Mass = density * volume
measurements were used to calculate thigh volume. The following equations were used
to calculate density and volume (42).
Density = 4.201/(% fat/100 +3.813)
Volume = 1/3*pi*h (R12+ R22 +R1*R2); (pi = 3.142, R1 = radius of the base, R2
= radius of the top, h = height of truncated cone)
Isokinetic Testing. Isokinetic testing was completed using the KIN-COM 500H
dynamometer (Chattecx Corporation, Chattanooga, TN). The women performed power
testing and fatigue testing of the dominant leg. The protocol and multiple regression
equation described by Suter et al. (41) were used for the isokinetic testing and for
determination of proportion of type II fibers. Prior to testing, the women completed a
brief warm-up using the cycle ergometer for 3 minutes at an intensity of 1-2 based on the
rating of perceived exertion scale. For power testing, the women performed four
consecutive maximal effort knee extensor contractions at an angular velocity of 250◦ • s-1.
Power was calculated as the product of peak torque of the set and the corresponding
angular velocity. Power values were normalized by dividing the values by the fat free
mass of the thigh (P250/FFMT). Power values normalized for FFMT were used in the
regression equation and statistical analysis. For fatigue testing, the women performed 55
consecutive knee extensor contractions at an angular velocity of 90◦ • s-1. To ensure
maximal effort on each attempt the women were able to watch their efforts on the
KIN-COM monitor while being given continuous verbal encouragement. Relative torque
values (T55) were calculated and used in the regression equation. To determine relative
torque the mean values for contractions 53-55 were calculated and expressed as
normalized for FFMT (P250/FFMT) and relative torque (T55) were used in the
regression equation established by Suter et al. (41) to calculate proportion of type II
fibers (r = .72 and RMSE of 8.1%).
Proportion of type II fibers = 52.239 - 0.533 (T55) + 0.512 (P280/FFMT)
(Note: a power value of 250◦ • s-1 (P250) was used instead of 280◦ • s-1 as this was the
maximal angular velocity possible for the dynamometer in our lab).
Statistical Analysis
All statistical analyses were performed using the Statistical Package for Social
Sciences 18 (SPSS, Inc., Chicago, IL). Prior to statistical analysis, test for normality and
univariate and multivariate outliers were conducted. Descriptive statistics were used to
compute the means, standard deviations, and range values for all the variables. Pearson
product correlation coefficients (r) were calculated to analyze the relationships among
cardiorespiratory fitness, PA, and proportion of type II fibers; the relationships between
fitness levels and risk factors for CVD (FG, TC, HDL, LDL, TRG, and hs-CRP); and the
relationships between proportion of type II fibers and risk factors for CVD (FG, TC,
HDL, LDL, TRG, and hs-CRP).
Results
Fifty AAW volunteered for this study. Two of the participants were excluded
from the final analysis because they were identified as univariate outliers (i.e. PA scores).
The final sample consisted of 48 AAW. The physiological characteristics of the subjects
BMI values (28.8 ± 6.8 kg/m2) indicated that the women were overweight; however the
mean value for DXA % body fat (39.9 % ± 6.8) indicated that the women were obese.
On average the women had an intermediate proportion of type II fibers (50.7% ± 6.4),
with a range of type II fibers from 35.2% to 64.9%. The mean values for VO2 (25.9 ±
4.1ml•kg•min-1
) demonstrated that the women had poor cardiovascular fitness; and
similarly the mean value for PA scores of the IPAQ-s (393.4 ± 461.4) indicated that the
women were inactive. (i.e. performing a pattern of physical activity achieving less than
600 MET-min/week). Physical activity classification according to the IPAQ-s showed
that 81% of the women were categorized as inactive and 19% were categorized as
minimally active. (Table 2).
Table 1. Physiological Characteristic of the Participants (N=48)
Variables Mean SD Minimum Maximal
Age (yrs) 33.6 9.9 20 58
Height (cm) 163.6 5.9 153.7 174.0
Weight (kg) 77.0 18.7 48.5 131.1
BMI(ratio-wt-kg/ ht-m2) 28.8 6.8 18.1 49.6
Body Fat DXA (%) 39.9 7.9 21.8 60.2
FFMT (kg) 8.7 2.4 4.4 15.8
Proportion of Type II
fibers (%) 50.7 6.3 35.2 64.9
PA (MET-min/week) 393.4 461.4 00 2160.0
VO2 (ml•Kg -1•min-1
) 25.9 5.3 18.8 33.3
Table 2. Physical Activity Categorical Score of Participants (N=48)
Categorical Score N
Inactive 39
Minimally Active 9
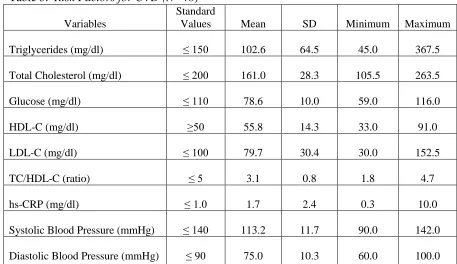
Risk factors for CVD, which included blood lipid parameters and blood pressure
(SBP & DBP), are shown in Table 3. The mean values for all of the blood lipids and
systolic and diastolic blood pressures were within normal range, indicating that the
women did not have any of the non-obesity tested risk factors for developing CVD.
Table 3. Risk Factors for CVD (N=48)
Variables
Standard
Values Mean SD Minimum Maximum
Triglycerides (mg/dl) ≤ 150 102.6 64.5 45.0 367.5
Total Cholesterol (mg/dl) ≤ 200 161.0 28.3 105.5 263.5
Glucose (mg/dl) ≤ 110 78.6 10.0 59.0 116.0
HDL-C (mg/dl) ≥50 55.8 14.3 33.0 91.0
LDL-C (mg/dl) ≤ 100 79.7 30.4 30.0 152.5
TC/HDL-C (ratio) ≤ 5 3.1 0.8 1.8 4.7
hs-CRP (mg/dl) ≤ 1.0 1.7 2.4 0.3 10.0
Systolic Blood Pressure (mmHg) ≤ 140 113.2 11.7 90.0 142.0
VO2, PA, Type II fibers, and CVD risk factors. The relationships among
cardiovascular fitness (VO2), PA, type II muscle fibers, and risk factors for CVD are
displayed in Table 4. VO2 was neither related significantly to PA (r = -.14, p = .32) nor
to proportion of type II muscle fibers (r = 0.13, p = 0.38). However, VO2 was
significantly correlated with several CVD risk factors. It was negatively correlated with
hs-CRP (r = -.31, p < 0.05), SBP (r = -0.47, p < 0.01), DBP (r = -0.43, p < 0.01), and
DXA % body fat (r = -0.62, p < 0.01). These negative associations suggest that if the
values of VO2 were to increase then the values for hs-CRP, SBP, DBP, and DXA % body
fat would decrease. The coefficients of determination for these significant relationships
were hs-CRP (r2 = .10, p < 0.05), SBP (r2 = .22, p < 0.01), DBP (r2 = .18, p < 0.01), and
DXA % body fat (r2 = .40, p < 0.01). These results indicate that DXA % body fat has
the greatest amount of common variance with VO2. Partial correlations controlling for
both age and BMI showed no significant correlations.
PA, Type II fibers, and CVD risk factors. Table 5 contains the correlations
among PA, type II fibers, and CVD risk factors. There were no significant statistical
relationships between PA and any of the variables. Partial correlations controlling for age
and BMI also showed no significant associations. There were significant negative
correlations between type II fibers and LDL-C (r = -0.30, p < 0.05), and type II fibers and
DXA % body fat (r = -0.46, p < 0.01). The coefficients of determination for these
significant relationships were LDL-C (r2 = .09, p < 0.05) and DXA % body fat (r2 = .21,
p < 0.01), indicating that both variables account for small percentage of the common
correlations (controlling for age and BMI) between type II fibers and CVD risk factors
[image:48.612.103.547.178.504.2]were observed (Table 6).
Table 4. Relationships among Cardiorespiratory Fitness (VO2), Type II muscle fibers, and Risk
Factors for CVD (N=48)
Variables r p value
VO2 and Type II fibers .14 .34
VO2 and PA -.06 .67
VO2and Triglycerides .00 .99
VO2 and Total Cholesterol .00 1.0
VO2 and Glucose -.10 .49
VO2 and HDL-C .10 .49
VO2 and LDL-C -.08 .56
VO2and hs-CRP -.31* .03
VO2 and SBP -.47** .00
VO2and DBP -.42** .00
VO2 and DXA %fat -.64** .00
Table 5. Relationships among PA, Type II muscle fibers, and CVD risk factors (N=48)
Variables r p value
PA and Type II fibers -.12 .42
PA and Triglycerides -.14 .36
PA and Total Cholesterol .15 .32
PA and Glucose -.11 .44
PA and HDL-C .08 .59
PA and LDL-C .17 .25
PA and hs-CRP -.12 .43
PA and SBP -.05 .76
PA and DBP .06 .68
PA and DXA %fat -.08 .60
**. Correlation is significant at the 0.01 level (2-tailed). *. Correlation is significant at the 0.05 level (2-tailed).
Table 6. Relationship between Proportion of Type II fibers and CVD risk factors (N =48)
Variables r p value
Type II fibers and Triglycerides -.23 .11
Type II fibers and TC -.27 .06
Type II fibers and Glucose .93 .53
Type II fibers and HDL-C .03 .82
Type II fibers and LDL-C -.30* .04
Type II fibers and hs-CRP -.23 .10
Type II fibers and SBP -.16 .27
Type II fibers and DBP -.11 .44
Type II fibers and DXA %fat -.46** .00