Mechanical Properties and Dislocation Substructure of 6061-T6 Aluminum Alloy
Impacted at Cryogenic Temperatures
Woei-Shyan Lee
+and Yu-Chi Huang
Department of Mechanical Engineering, National Cheng Kung University, Tainan 701, Taiwan
The mechanical properties and dislocation substructure of 6061-T6 aluminum alloy deformed at temperatures of 0°C,¹100°C and
¹196°C and strain rates of 1000 s¹1, 3000 s¹1and 5000 s¹1are investigated using a compressive split-Hopkinson pressure bar. It is found that
theflow stress and strain rate sensitivity increase with increasing strain rate, but decrease with increasing temperature. In addition, the work hardening rate decreases with increasing strain rate and temperature. Theflow stress corresponding to a true strain of 0.6 is modelled using a power law expression with an activation energy of 1.7 kJ/mol and an average strain rate sensitivity of 0.154. The dislocation density increases with increasing strain rate and decreasing temperature, and leads to a greaterflow stress. A greater multiplication and tangling of the dislocations occurs at higher strain rates and lower temperatures. Theflow stress and square root of the dislocation density are linearly related via the Bailey-Hirsch type relation·¼·0þ¡1Gbpffiffiffiµ, where¡1has a value of 0.46 for the current 6061-T6 aluminum alloy.
[doi:10.2320/matertrans.M2015170]
(Received May 7, 2015; Accepted December 7, 2015; Published February 5, 2016)
Keywords: aluminum alloy, cryogenic deformation, high strain rate, dislocation
1. Introduction
Al-Mg-Si 6061 aluminum alloy is a medium strength alloy. However, its strength can be enhanced by the production of precipitates in a tempering process (T6, solutionised and artificially aged). 6061-T6 has excellent mechanical proper-ties and good weldability, and is therefore widely used throughout the aircraft, automotive, nuclear and space industries.13)In many space applications, 6061-T6 compo-nents are subject to both high strain rates and cryogenic temperatures. For example, in the propellant tanks for launch vehicles, cryogenic storage tanks, and the Terrestrial Planet Finder (TPF) system,46) the components or structures frequently operate at strain rates of 102³104s¹1and temper-atures as low as¹200°C. Many studies have investigated the fracture toughness,7)damage behaviour,8)tensile properties,9) and high strain rate response10)of 6061-T6 aluminum alloy at room or elevated temperatures. However, the deformation behaviour and microstructural evolution of 6061-T6 alloy at cryogenic temperatures and high strain rates are less well understood. Nonetheless, in designing 6061-T6 components for implementation in arduous operating conditions, such an understanding is urgently required.
The literature contains a wealth of experimental data regarding the mechanical response of metals and alloys under high loading rates. In general, the results show that theflow stress of metallic materials increases significantly with an increasing strain rate or decreasing temperature.1113)Several mechanisms have been proposed to account for the change in mechanical properties prompted by high velocity deforma-tion, including dislocation damping,14) thermal activation15) and dislocation generation.16)Many studies have shown that high strain rate loading induces microstructural evolution and phase transformation, and therefore has a significant effect on the material properties.17,18)It has also been reported that for fcc metals and alloys, high strain rate loading leads to a rapid multiplication of the dislocations in the deformed
micro-structure.19,20) However, a lower deformation temperature enhances the internal resistance to dislocation motion, and therefore increases the material strength.21) Many studies have shown that as the strain rate increases, or the temperature decreases, the dislocation density increases; leading to a greater rate of work hardening and an enhanced
flow resistance. In general, the relationship between the dislocation density, the flow stress and the hardening behaviour of fcc metals and alloys can be adequately described using a common power law model.20)
The present study utilises a compressive split-Hopkinson pressure bar (SHPB) system to investigate the impact response of 6061-T6 aluminum alloy at temperatures ranging from 0 to¹196°C and strain rates of 1000 to 5000 s¹1. The microstructures of the deformed specimens are observed using transmission electron microscopy (TEM). The me-chanical response of the specimens deformed under different temperatures and strain rates is then interpreted in terms of the differences observed in the deformation micro-structures.
2. Experimental Procedure
The 6061-T6 alloy used in the present study was purchased from Northwest Aluminum (NWA; The Dalles, OR) in the form of hot-rolled plates with a thickness of 12 mm and a width of 150 mm. According to the manufacturer’s specifi -cation, the chemical composition of the alloy plates was as follows: Si 0.66, Fe 0.2, Cu 0.24, Mn 0.01, Mg 0.93, Cr 0.05, Ti 0.013, Zn 0.15, and a balance of Al (mass%). Cylindrical specimens with a height and diameter of 8 mm were machined from the as-delivered plates with the impact axes parallel to the rolling direction. To ensure uniaxial deforma-tion condideforma-tions (i.e., a fricdeforma-tionless state), the end faces of the specimens were lubricated using commercial molybdenum disulfide (Molykote) mixed with a glass paste consisting of 80% PbO, 20% B2O3 and alcohol. Figure 1(a) presents an optical micrograph of the as-received alloy. As shown, the microstructure consists predominantly of flattened and
+Corresponding author, E-mail: wslee@mail.ncku.edu.tw
elongated grains. In addition, the matrix contains a random distribution of fine and relatively coarse precipitates. The energy dispersive X-ray (EDX) analysis results presented in Fig. 1(b) show that the precipitates are Mg2Si (¢phase).
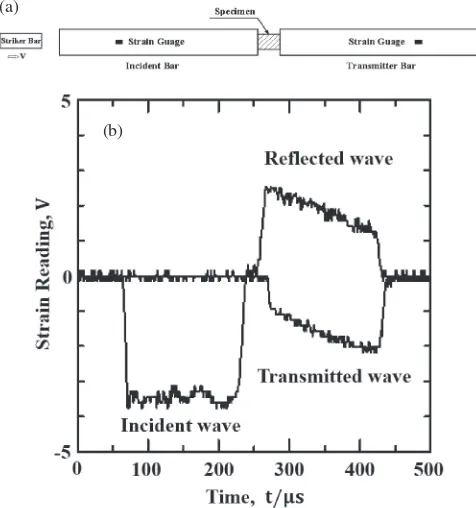
The specimens were deformed at strain rates of 1000 s¹1, 3000 s¹1and 5000 s¹1and temperatures of 0°C,¹100°C and ¹196°C, respectively, using a SHPB system. As shown in Fig. 2(a), the SHPB system consisted of an incident bar, a transmitter bar and a striker bar. All three bars were fabricated of Maraging steel and had a diameter of 12.7 mm. Moreover, the incident bar and transmitter bar each had a length of 1 m, while the striker bar had a length of 317 mm. The low testing temperatures of 0°C, ¹100°C and ¹196°C were obtained by fitting a refrigeration system around the specimen. Liquid nitrogen and alcohol were added to the system at the beginning of the experimental tests and were replenished periodically in order to maintain a constantfluid level. Figure 2(b) presents a typical oscilloscope trace obtained during the impact tests. The compressive stress-strain response of the specimens was established in accordance with uniaxial elastic wave theory.22,23) Specifi -cally, the recorded values of the incident, reflected and transmitted pulses (i.e.,¾i(t),¾r(t) and¾t(t), respectively) were used to compute the average compressive engineering strain ¾e(t), nominal strain rate ¾_ðtÞ, and average compressive engineering stress·e(t) in accordance with
¾eðtÞ ¼ ð2C0=L0Þ
Z
¾rðtÞdt; ð1Þ
_
¾ðtÞ ¼2C0¾rðtÞ=L0; ð2Þ
·eðtÞ ¼EðA=A0Þ¾tðtÞ; ð3Þ
whereC0is the longitudinal wave velocity;L0is the effective gauge length of the specimen; Eis the Young’s modulus of the split-Hopkinson bars; andAandA0are the cross-sectional areas of the split-Hopkinson bars and specimen, respectively. Having obtained the engineering stress-strain data, the true stress (·T) and true strain (¾T) were determined respectively as
·T¼·eð1¾eÞ; ð4Þ
¾T¼ lnð1¾eÞ: ð5Þ
Following the impact tests, thin foils for TEM observation were prepared by cutting slices with a thickness of 0.7 mm from the impacted specimens in a direction perpendicular to the compression axis. The slices were ground to a thickness of 0.2 mm using 1200 grit size soft paper, and discs with a diameter of 3 mm were then trepanned from each slice using an electron discharge machining system. Finally, the discs were polished in a circulating electrolyte solution comprising 50% HNO3 and 50% C2H5OH at ¹15°C using a twin-jet polishing machine with an agitation voltage of 15 V DC. The TEM observations were performed using a JEOL-3010 transmission electron microscope with an operating voltage of 300 kV. The dislocation density µ of each sample was calculated using Ham’s interception method.24)
3. Results and Discussions
3.1 Stress-strain curves
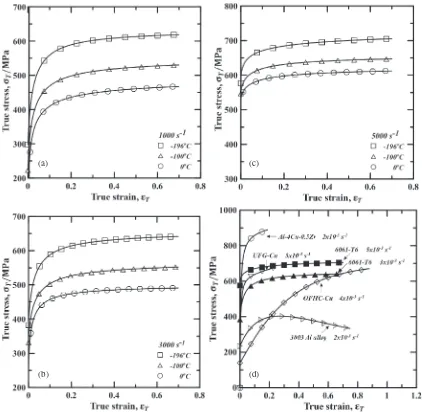
Figures 3(a)³3(c) show the stress-strain response of the impacted 6061-T6 specimens at strain rates of 1000 s¹1, 3000 s¹1 and 5000 s¹1, respectively. It can be seen that the
flow response of the specimens is significantly dependent on both the strain rate and the temperature. Specifically, theflow
(a)
(b)
Fig. 1 (a) Optical micrograph of as-received 6061-T6 aluminum alloy (undeformed); (b) energy dispersive X-ray (EDX) analysis results for Mg2Si precipitates.
(a)
(b)
[image:2.595.307.545.72.326.2] [image:2.595.63.278.72.349.2]stress increases with increasing strain rate, but decreases with increasing temperature. Furthermore for each test condition, the flow stress increases quickly at the onset of dynamic plastic deformation, but increases more slowly at larger strains. Comparing the variations of the flow stress with the strain rate and temperature, respectively, it is found that the temperature has a greater effect on the flow stress than the strain rate. Specifically, in the cryogenic temperature regime, a pronounced strengthening effect occurs as the deformation temperature is decreased. It is noted that none of the specimens fractured under the considered test conditions. Thus, it is inferred that 6061-T6 alloy has good ductility and strengthening properties under cryogenic temperatures and high strain rates.
Figure 3(d) compares the stress-strain response of the current 6061-T6 alloy with that of Al-4Cu-0.5Zr,25) UFG-Cu,26) OFHC-Cu27) and 3003 Al-Mn28) under broadly equivalent loading conditions. The results show that the
flow stress of 6061-T6 alloy is higher than that of UFG-Cu, OFHC-Cu and 3003 Al-Mn, but lower than that of
Al-4Cu-0.5Zr. However, although Al-4Cu-0.5Zr has a higher strength than 6061-T6, it has a very low deformability. Furthermore, comparing the stress-strain responses of OFHC-Cu and 6061-T6, it is found that while both alloys have good strength, 6061-T6 has better deformability and an improved flow response. In other words, of the two alloys, 6061-T6 is better suited to the fabrication of structural components designed for use in arduous operating conditions.
The stress-strain curves in Fig. 3 show that the specimens deformed at different strain rates and temperatures exhibit a different work hardening behaviour. In other words, the work hardening rate (@·/@¾) of 6061-T6 alloy is dependent on the strain, strain rate and temperature. Table 1 shows the variation of the work hardening rate with the temperature at true strains ranging from 0.05 to 0.7 and strain rates of 1000 s¹1, 3000 s¹1 and 5000 s¹1, respectively. It is seen that for a given temperature, the work hardening rate decreases with increasing strain rate due to a higher deformation-induced temperature rise. Furthermore, for a constant strain and strain rate, the work hardening rate decreases as the
(a)
(b)
(c)
(d)
Fig. 3 Stress-strain curves of 6061-T6 alloy deformed at temperatures of 0°C,¹100°C and¹196°C and strain rates of: (a) 1000 s¹1,
(b) 3000 s¹1, and (c) 5000 s¹1; (d) stress-strain responses of 6061-T6 alloy, Al-4Cu-0.5Zr alloy, UFG-Cu alloy, OFHC-Cu alloy and 3003
[image:3.595.86.508.68.480.2]temperature increases. It is noted that the work hardening rate has a positive value for all values of the strain, strain rate and temperature. Thus, it is inferred that the specimens undergo stable plastic deformation under high strain rates and cryogenic temperatures.
3.2 Effects of strain rate and temperature
Figures 3(a)³3(c) show that the true stress increases with increasing strain rate or decreasing temperature. The strain rate dependence of the flow stress can be approximated by the following power law expression:29)
_
¾¼C1·nexpðQ=RTÞ; ð6Þ
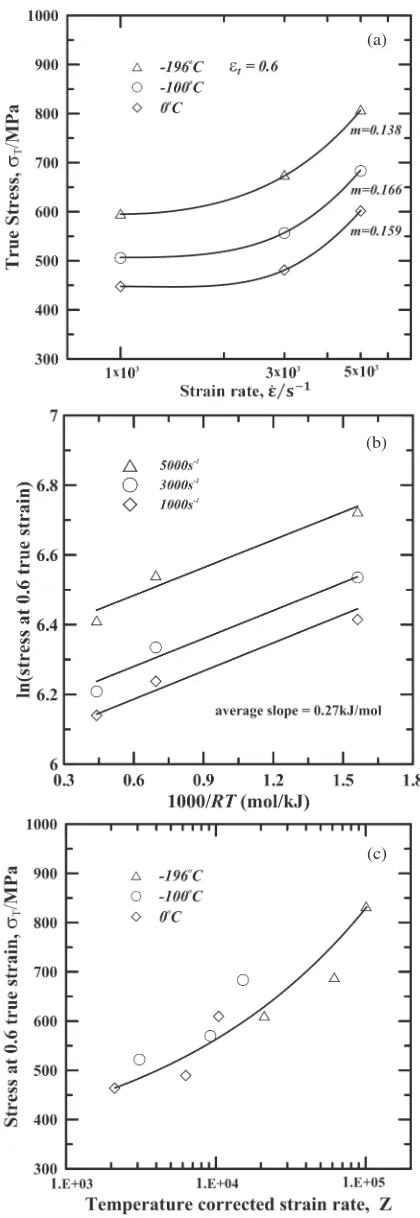
whereQis the effective activation energy for deformation,R is the gas constant (=8.314 J/mol K),T is the deformation temperature, and C1 and n are constants. Figure 4(a) shows the effect of the strain rate on theflow stress at a true strain of 0.6 given the three deformation temperatures considered in the present study. The results confirm the validity of the power law in eq. (6) for describing the relationship between the strain rate and the flow stress at different temperatures. The average value of the strain rate sensitivity parameter (i.e., power law exponent), m=1/nA, is found to be 0.154. This value can be used to extract the average effective activation energy from plots of ln(·) against the inverse of the temperature using the following rearrangement of eq. (6):
ln·¼Q=ðn0RTÞ þ ð1=n0Þln _¾ ð1=n0ÞlnC
1: ð7Þ
Figure 4(b) shows the effect of the temperature on theflow stress given a true strain of 0.6 and different strain rates. From inspection, the average value of Q/nA is 0.27 kJ/mol. Hence, the average effective activation energy is equal to 1.7 kJ/mol.
For impact deformation, the flow stress depends on both the strain rate and the temperature. Figure 4(c) shows the variation in theflow stress as a function of the strain rate and temperature, as evaluated using the Zener-Hollomon parame-ter, Zð¼_¾expðQ=RTÞÞ. Note that the true strain is equal to 0.6. It is observed that the maximumflow stress occurs at the lowest temperature and highest strain rate (i.e., high Z).
3.3 Thermal activation volume
In general, the strain rate of a plastically-deforming
material can be expressed in the form of the following Arrhenius equation:30)
_
[image:4.595.320.530.66.675.2]¾¼_¾oexp½G=KbT; ð8Þ
Table 1 Variation of work hardening rate of 6061-T6 specimens as function of strain, strain rate and temperature.
T(°C) Strain rate (s¹1)
Work hardening rate (MPa/Unit Strain)
¾=0.05 ¾=0.1 ¾=0.3 ¾=0.5 ¾=0.7
0
1000 1088 435 91 43 25
3000 805 296 51 22 12
5000 352 173 44 21 14
¹100
1000 1234 499 96 41 24
3000 903 379 76 34 20
5000 433 257 88 48 32
¹196
1000 1392 531 89 36 20
3000 1105 446 83 35 20
5000 562 303 115 73 54
(a)
(b)
(c)
Fig. 4 (a) Effect of strain rate on true stress at true strain of 0.6 given deformation temperatures of 0°C, ¹100°C and ¹196°C; (b) effect of temperature on true stress at true strain of 0.6 given strain rates of 1000 s¹1, 3000 s¹1and 5000 s¹1; (c) effect of Zener-Hollomon parameter
[image:4.595.47.292.94.238.2]where _¾o is the frequency factor, ¦G* is the activation energy, Kb is the Boltzmann constant (Kb=1.38©10¹23 JK¹1), andTis the absolute temperature. According to,31,32) ¦G*can be derived as
G¼ T¯½@·=@T_
¾;¾; ð9Þ
where¯*is the activation volume and is given by33)
¯¼KT @ln _¾ @·
¼KT
¢ : ð10Þ
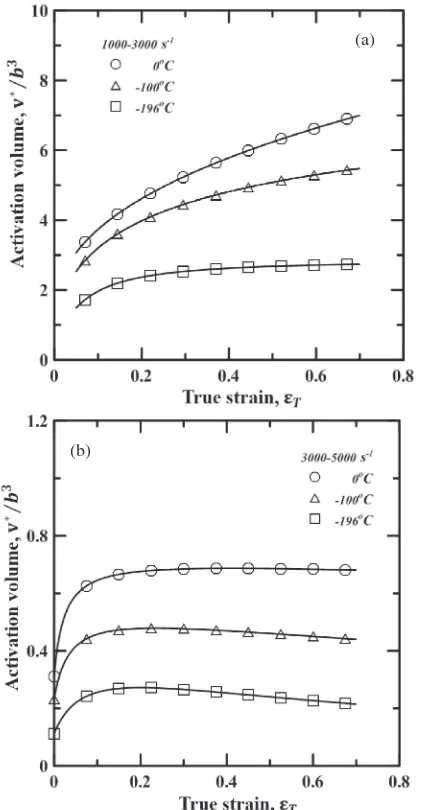
Figures 5(a) and 5(b) present the results obtained for the activation volume of the present 6061-T6 specimens over strain rate ranges of 1000 to 3000 s¹1and 3000 to 5000 s¹1, respectively. Note that the activation volume is obtained by substituting the stress-strain data in Figs. 3(a)³3(c) into eq. (10). Note also that in bothfigures, the activation volume is normalised by dividing¯*byb3, wherebis the magnitude of Burgers vector and has a value of 2.86©10¹10m for 6061-T6 aluminum alloy.34)It can be seen that for a constant strain and strain rate, the activation volume increases with increasing temperature. However, for a constant temperature,
the activation volume decreases with increasing strain rate. For strain rates in the range of 1000 to 3000 s¹1, the normalised activation volume has a value greater than unity; indicating that the deformation process is dominated by thermal activation.31) However, at higher strain rates (i.e., 3000 to 5000 s¹1), the normalised activation volume is less than unity. In other words, the deformation process is dominated by dislocation generation as reported in a previous study by the present group for 304L SS.16)Table 2 shows the activation volumes of the five alloys shown in Fig. 3(d) at true strains of 0.05 and 0.15 and a temperature of 0°C. It is seen that the present 6061-T6 alloy has the lowest activation volume of thefive alloys.
3.4 Dislocation substructure observations
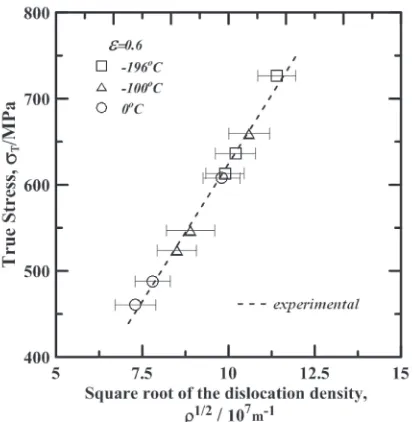
Figures 6(a)³6(d) present TEM micrographs of the 6061-T6 specimens deformed under strain rates of 1000 s¹1 and 5000 s¹1 and temperatures of 0°C and ¹196°C. Comparing the four figures, it is seen that the dislocation density increases with increasing strain rate or decreasing temper-ature. (Note that this observation is confirmed by Table 3, which shows the dislocation density values for each of the current specimens.) The micrographs presented in Fig. 6 also show that the multiplication and tangling of the dislocations increases as the strain rate increases or the temperature decreases. Thus, the plastic flow stress also increases, as shown in the stress-strain curves presented in Figs. 3(a)³3(c). Figure 7 shows the variation of the experimental measured flow stress with the square root of the dislocation density as a function of the temperature given
(a)
(b)
Fig. 5 Variation of thermal activation volume with true strain as function of temperature for strain rate ranges of: (a) 1000 to 3000 s¹1; (b) 3000 s¹1
[image:5.595.65.276.69.474.2]to 5000 s¹1.
Table 2 Activation volume of various alloys at 0°C.
Metal Strain rate (s¹1)
Activation volume (¯*/b3)
Reference
¾t=0.05 ¾t=0.15
6061-T6 3000³5000 0.16 0.19 Current study
OFHC-Cu 4000³8000 0.79 0.52 27)
6061-T6 1000³3000 0.87 1.18 Current study
Al-4Cu-0.5Zr 0.001³2000 6.59 4.40 25)
UFG-Cu 0.001³5000 16.28 10.86 26)
[image:5.595.305.550.84.189.2]3003 Al-Mn 0.001³3000 22.71 8.51 28)
Table 3 Dislocation density of 6061-T6 specimens deformed to true strain of 0.6 under different strain rates and temperatures.
T(°C) Strain rate (s¹1) Stress (MPa)
Dislocation densityµ1/2
(107m¹1)
0
1000 460.48 7.3«0.59
3000 487.98 7.8«0.51
5000 607.81 9.8«0.54
¹100
1000 523.68 8.5«0.57
3000 546.98 8.9«0.70
5000 659.44 10.6«0.59
¹196
1000 613.11 9.9«0.56
3000 636.29 10.2«0.58
[image:5.595.304.549.243.393.2]a constant true strain of 0.6. It is observed that theflow stress and the square root of the dislocation density are linearly related (as indicated by the dashed line).
The strengthening effect prompted by dislocation multi-plication and tangling can be described via the following Bailey-Hirsch type relationship:20)
· ¼·0þ¡1Gbpffiffiffiµ; ð11Þ
where·0is the friction stress of the material,¡1is a material constant, Gis the shear modulus,b is the magnitude of the Burgers vector, and µis the dislocation density. In general, the friction stress (·0) reflects the overall impedance of a material to the onset of slip provided by the matrix or the lattice, and is regarded as the initial yield stress of the particular material. For the current 6061-T6 specimens, the initial yield stress is equal to 276 MPa (as measured using a Saginomiya 100 metal forming machine). Substituting values of G=26 GPa,34)b=2.86©10¹10m,34)and ·
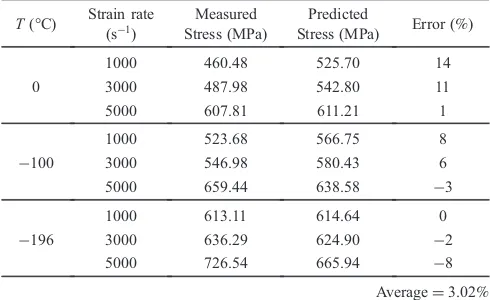
0=276 MPa into eq. (11), the material constant for the present 6061-T6 alloy is found to be ¡1=0.46. Table 4 compares the experimental values of the flow stress with the predicted values obtained from eq. (11). The average error in theflow
(a)
(b)
(c)
(d)
Fig. 6 TEM micrographs showing dislocation microstructures of 6061-T6 specimens deformed at: (a) 1000 s¹1, 0°C; (b) 5000 s¹1, 0°C;
(c) 1000 s¹1,¹196°C; (d) 5000 s¹1,¹196°C.
[image:6.595.110.487.74.468.2] [image:6.595.66.274.537.748.2]stress estimates over the considered strain range is 3.02%. In addition, the standard deviation is just 0.069. In other words, the Bailey-Hirsch type equation provides an adequate description of the strengthening behaviour of 6061-T6 alloy under the current deformation conditions.
It is noted that the value of ¡1=0.46 obtained in the current study is significantly higher than that of pure aluminum deformed at 25°C under a strain rate of 8.3© 10¹4s¹1 (¡=0.24),35) or that of Al-Sc alloy deformed at temperatures ranging from ¹100³25°C and strain rates of 1.2³5.8©103s¹1 (¡=0.34).36) The higher value of ¡ observed for the present 6061-T6 specimens implies that deformation under higher strain rates and lower temperatures prompts a rapid generation and accumulation of the dislocations within the deformed microstructure.
4. Conclusions
The dynamic impact response of 6061-T6 aluminum alloy has been investigated at temperatures ranging from 0°C to ¹196°C and strain rates in the range of 1000 to 5000 s¹1 using a compressive SHPB system. The results have shown that the flow stress increases with increasing strain rate or decreasing temperature. Moreover, a strengthening effect occurs during deformation at higher strain rates and lower temperatures. The flow stress at a true strain of 0.6 has a power law dependency on the Zener-Hollomon parameter with an exponent of around 0.154. The dislocation density of the 6061-T6 specimens increases with increasing strain rate and decreasing temperature. The strengthening effect ob-served in the specimens deformed at higher strain rates and lower temperatures is the result of a more rapid multiplication of the dislocations.
Acknowledgements
The authors gratefully acknowledge the financial support
provided to this study by the National Science Council of the Republic of China under Grant No. NSC101-2221-E-006-144.
REFERENCES
1) D. R. Chichili, K. T. Ramesh and K. J. Hemker:Acta Mater.46(1998) 10251043.
2) W. S. Lee, C. F. Lin, T. H. Chen and H. W. Chen:Mater. Sci. Eng. A
528(2011) 62796286.
3) A. G. Odeshi, S. Al-ameeri, S. Mirfakhraei, F. Yazdani and M. N. Bassim:Theor. Appl. Fract. Mech.45(2006) 1824.
4) S. G. Kang, M. G. Kim, S. W. Park, C. G. Kim and C. W. Kong: J. Compo. Mater.42(2008) 975992.
5) S.-G. Kang, M. G. Kim and C. G. Kim:Compo. Structures78(2007) 440446.
6) C. Y. Peng, M. Levine, L. Shido and R. Leland: Proc. of SPIE, ed. by Lee D. Peterson and Robert C. Guyer, (SPIE, Bellingham, WA, 2004) Vol.5528(2004) pp. 4462.
7) F. J. MacMaster, K. S. Chan, S. C. Bergsma and M. E. Kassner:Mater. Sci. Eng. A289(2000) 5459.
8) A. O. Adesola, A. G. Odeshi and U. D. Lanke:Mater. Des.45(2013) 212221.
9) F. Ozturk, A. Sisman, S. Toros, S. Kilic and R. C. Picu:Mater. Des.31
(2010) 972975.
10) W. S. Lee, J. C. Shyu and S. T. Chiou:Scr. Mater.42(2000) 5156. 11) A. Mishra, M. Martin, N. N. Thadhani, B. K. Kad, E. A. Kenik and
M. A. Meyers:Acta Mater.56(2008) 27702783.
12) W. S. Lee, C. F. Lin, T. H. Chen and W. Z. Luo:J. Nucl. Mater.420
(2012) 226234.
13) A. S. Khan, Y. S. Suh and R. Kazmi:Int. J. Plasticity20(2004) 2233 2248.
14) W. G. Ferguson, A. Kumar and J. E. Dorn:J. Appl. Phys.38(1967) 1863.
15) A. Seeger:Philos. Mag.46(1955) 11941217.
16) W. S. Lee and C. F. Lin:Metall. Mater. Trans. A33(2002) 28012810. 17) H. Jarmakani, J. M. McNaney, B. Kad, D. Orlikowski, J. H. Nguyeu
and M. A. Meyers:Mater. Sci. Eng. A463(2007) 249262. 18) D. M. Norfleet, D. M. Dimiduk, S. J. Polasik, M. D. Uchi and M. J.
Mills:Acta Mater.56(2008) 29883001.
19) K. Yasunaga, M. Iseki and M. Kiritani:Mater. Sci. Eng. A350(2003) 7680.
20) Y. Tomota, P. Lukas, S. Harjo, J. H. Park, N. Tsuchida and D. Neov: Acta Mater.51(2003) 819830.
21) W. S. Lee, T. H. Chen and S.-C. Huang:J. Nucl. Mater.402(2010) 17. 22) U. S. Lindholm:J. Mech. Phys. Solids12(1964) 317335.
23) W. S. Lee and T. H. Che:Mater. Trans.47(2006) 355363. 24) R. K. Ham:Philos. Mag.6(1961) 11831184.
25) G. T. Gray, III, T. C. Lowe, C. M. Cady, R. Z. Valiev and I. V. Aleksandrov:Nanostructural Mater.9(1997) 477480.
26) T. Suo, Y. Li, F. Zhao, X. Fan and W. Guo:Mech. Mater.61(2013) 110.
27) S. Nemat-Nasser and Y. Li:Acta Mater.46(1998) 565577. 28) W. G. Guo, X. Q. Zhang, J. Su, Y. Su, Z. Y. Zeng and X. J. Shao:
Europen J. Mech. - A/Solids30(2011) 5462.
29) J. J. Jonas, C. M. Sellars and W. J. McG. Tegart: Metall. Rev. 130 (1969) 124.
30) J. Harding: Met. Technol. January (1977) 616. 31) H. Conrad: J. Metal16(1964) 582588.
32) L. Shi and D. O. Northwood:Acta Metall. Mater.43(1995) 453460. 33) G. B. Gibbs:Mater. Sci. Eng.4(1969) 313328.
34) V. Sarma, J. Wang, W. W. Jian, A. Kauffmann, H. Conrad, J. Freudenberger and Y. T. Zhu:Mater. Sci. Eng. A527(2010) 7624 7630.
[image:7.595.46.291.105.255.2]35) N. Hansen and X. Huang:Acta Mater.46(1998) 18271836. 36) W. S. Lee and T. H. Chen:Mater. Sci. Technol.24(2008) 12711282. Table 4 Comparison of experimental measuredflow stress and predicted
flow stress at true strain of 0.6 under different strain rates and temperatures.
T(°C) Strain rate (s¹1)
Measured Stress (MPa)
Predicted
Stress (MPa) Error (%)
0
1000 460.48 525.70 14
3000 487.98 542.80 11
5000 607.81 611.21 1
¹100
1000 523.68 566.75 8
3000 546.98 580.43 6
5000 659.44 638.58 ¹3
¹196
1000 613.11 614.64 0
3000 636.29 624.90 ¹2
5000 726.54 665.94 ¹8