An Investigation of Factors for Changing
Land Use Pattern in Bihar with a
Piercing Insight on Current Fallow Lands
Sinha, D.K. and Ahmad, Nasim and Singh, K.M.
Dr. Rajendra Prasad Central Agricultural University, Pusa
14 February 2017
Online at
https://mpra.ub.uni-muenchen.de/80264/
Piercing Insight on Current Fallow Lands
D.K. Sinha, Nasim Ahmad and K.M. Singh
Department of Agricultural Economics
Dr. Rajendra Prasad Central Agricultural University, Pusa, Samastipur (Bihar)
Abstract
In the present study, an effort has been made to analyze the factors responsible for changes in land use pattern especially increasing current fallow lands, shrinking net sown area and shifting of lands for non-agricultural purposes in the state. The categories of land such as barren land, culturable waste land and permanent pastures and grazing land have shown declining trend. Further, declining trend in net sown area and other fallow lands has been noticed. Current fallows reduced over the period till 2000s but it began to rise since 2000s afterwards. The rainfall and road length did have significant impact on the level of current fallows. Erratic monsoon and scarcity of labour during the study period of present century resulted/led to accumulation of current fallow lands. It was further observed that the non-agricultural use of land was identified as the dominant factor for changes in common lands as it affected the current fallows negatively. It is a challenging task for policy makers to maximize the income of farming community from continuous decline in net sown area, deteriorating climatic condition (erratic monsoon) as well as labour scarce conditions thus finally resulting in aggregation of current fallows. In order to discourage/arrest the rising tendency in current fallows or put the current fallows under profitable cultivation, cheap source of irrigation is needed to be made available to cultivators.
An Investigation of Factors for Changing Land Use Pattern in Bihar with a
Piercing Insight on Current Fallow Land
Introduction
Bihar with a total population of about 116 million people is the most densely populated state among all states forming eastern India and ranked third largest state of India with respect to population and seventh in terms of area. Home to a large proportion (58%) of young (below the age of 25) population, the state is ranked at the top in terms of highest proportion of young people as compared with all other states of the country. Bihar is endowed with various diversified natural gifts. Fertile Gangetic alluvial soil, abundant water resources, particularly ground water resources altogether forms the basic/core components for development of agriculture in Bihar. The state is considered as destination for second Green Revolution in the country. Several reports including the National Farmers’ Commission have emphasized the need for accelerated development of agriculture in eastern India for securing food security of the country.
Since time immemorial, human used land to meet their material, social and cultural needs. In this process, they are modifying lands in various ways, often with known impacts on climatic conditions, consequently human well-being. Change in land use pattern is a complex phenomenon which is affected by several socio-economic, climatic conditions and institutional factors. Technological changes have also extended change in land use pattern. Intensive cultivation, resulting in changing marginal land into more productive agricultural lands through capital intensive cultivation, ignited by technological changes.(Ramasamy et. al. 2005). A study conducted by Nadkarni and Deshpande (1997) highlighted the importance of institutional factors leading to under utilization of agricultural lands, especially when the people employed in urban areas keep lands idle for using it after retirement or for speculative purposes. However, this is not true in case of flood and drought prone areas, and state like Bihar, where farmers are financially weak and technological expansion is very limited. Despite this, the change in land use has taken place in conformity with shifting of land towards non-agricultural uses. Pandey and Tiwari (1987) analyzed the dynamics of land use nad estimated the shift in land use in each state with the help of simple identity of linearly additive land uses changes.
shifting of area from the land under cultivable waste, current fallows and fallow lands other than current fallow (Sharma and Pandey 1992; Subramanian et al., 1994). In Bihar, area under current fallow has been found stepping up over the time, thereby reducing the net sown area (Singh and Vashist, 1997). For the state as a whole, the current fallows rose to 8.61% during the seventies(70s) to 9.40% in eighties (80s) and thereafter, it showed declining at 7.58% & 6.53% during 90s and 2000s, respectively and further, turned out to be up by 7.42% during 2003-13. Shifting of land towards non-agricultural uses and declining net sown area are of great concern for food and nutritional security of the state as well as the nation and world as a whole. Competition between agricultural and non-agricultural sectors for land is intensifying due to growing population pressure on land for food production, shelter and industrial growth. In 1970-71, net sown area was 62.68% which reduces to only 58.46% in 2013-14 whereas land put to non-agricultural uses jumped up from merely 11.77% in 1970-71 to 17.85% in 2013-14. However, the shrinkage in net sown area is not being compensated by increased productivity of crops so as to provide fillip to higher production. Decadal growth performance of fallow lands were found negative in the decades of 70s, 80s and 90s, indicating reduction in fallow lands or conversion of fallow lands to agricultural production purposes as well as for non agricultural purposes like establishment of industries, construction of residential buildings, construction of roads for using the and other infrastructural bases. But in the decades of 2000s and 2003-13, compound growth rates were found positive i.e. 1.49% and 2.21%. In spite, increasing pressure on land, there is also tendency to keep their land fallow due to factors like uncertainty of monsoon, poor irrigation facilities, irrigation through diesel pump sets being very costly, labour scarcity etc, reminding that all is not well with land management in the state.
Hence, the present investigation is an attempt to study the factors causing changes in land use pattern especially increasing fallow lands, shrinking net sown area and shifting of lands for non-agricultural purposes in the state.
Methodology
composite districts were compiled by summing up the data for newly carved out districts which were the parts of old districts i.e. undivided districts of Bihar.
Growth rate estimation: Compound growth rates for different land use categories for the state were worked out using the log-linear regression equation.
=
= +
Log Y=y, Log A=a and Log B=b
thus, = +
= ( ′ ′ −1) 100
Where, Y = Different categories of land use pattern (in ‘000 ha) a= Intercept
b = Regression coefficient
t = Time periods (t= 1, 2, 3,………n)
r = Compound Growth Rate (CGR) per annum.
Estimation of Instability Index: Analysis of instability index is carried out to know the fluctuations or instability in any time series data. First we estimate the parameters of log linear trend line for the variable (Yt) for which instability is to be estimated. If the estimated parameter is statistically significant, the instability index is defined as:
I = 1−
Where, CV= Coefficient of variation for time series data and is estimated as:
= 100
Where, SD= standard deviation
If the estimated parameter of regression equation is not significant, then the CV itself is considered as instability index.
Estimation of Location Coefficient (L): There are many methods to measure the change in land use pattern. Location coefficient (L) is useful to identify the pattern of distribution of a given categories of land across different regions of the state.
Location co-efficient (L) is estimated as:
Where, Lij = area of jth category of land in ith district
Li = area of all categories of land in the district
Lj= area of jth categories of land in the state
Ls= area of all categories of land in the state
A higher value for location coefficient for the district indicates the higher concentration of that particular category of land in that district.
Results
Changing land use pattern: A macro-level study
The decadal changes in different categories of lands are presented in Table 1.
Table 1: Share of different land use categories to total geographical area in Bihar (Averages for the respective decades)
(Area ‘000 ha)
Sl. No.
Particulars
1970s 1980s 1990s 2000s 2003-13
1. Reporting area 9359.76
(100.00) 9359.76 (100.00) 9359.76 (100.00) (9359.76) (100.00) (9359.76) (100.00)
2. Forest area 591.75
(6.32) 607.85 (6.49) 616.45 (6.59) 621.12 (6.64) 621.64 (6.64) 3. Barren and unculturable area 455.21
(4.86) 439.04 (4.69) 437.34 (4.67) 434.97 (4.65) 433.54 (4.63) 4. Land put to non-agricultural uses 1101.71
(11.77) 1335.91 (14.27) 1539.19 (16.44) 1651.98 (17.65) 1670.71 (17.85)
(a) Land area 870.35
(9.30) 1056.83 (11.29) 1217.41 (13.01) 1291.42 (13.80) 1311.76 (14.01)
(b) Permanent water area 156.77
(1.67) 179.78 (1.92) 196.92 (2.10) 207.39 (2.22) 207.39 (2.22)
(c) Temporary water area 74.58
(0.80) 99.30 (1.06) 124.86 (1.33) 153.16 (1.64) 151.46 (1.62)
5. Culturable waste land 107.50
(1.15) 77.75 (0.83) 59.30 (0.63) 45.81 (0.49) 45.48 (0.49) 6. Permanent pastures & grazing land 41.57
(0.44) 33.80 (0.36) 22.14 (0.24) 17.12 (0.18) 16.49 (0.18) 7. Land under misc. tree crops &
groves 182.13 (1.95) 167.39 (1.79) 226.19 (2.42) 238.86 (2.55) 242.13 (2.59)
8. Fallow land other than current fallow 206.60 (2.21) 205.29 (2.19) 167.56 (1.79) 127.87 (1.37) 124.08 (1.33)
9. Current fallow 806.19
(8.61) 880.20 (9.40) 709.81 (7.58) 611.26 (6.53) 694.32 (7.42) 10. Total unculturable land(2 to 9) 3492.66
(37.32) 3557.23 (40.04) 3777.98 (40.36) 3788.48 (40.48) 3887.90 (41.54)
11. Net area sown 5867.10
(62.68) 5612.50 (59.96) 5576.99 (59.58) 5571.08 (59.52) 5471.67 (58.46)
Figures in parentheses indicate percentage value
Growth rate
Compound growth rates for different categories of land use in the state of Bihar have been worked out decade-wise since 1970 to 2013 as well as for the period as a whole (Overall period i.e. 2003-13) and presented in Table 2.
non-agricultural uses has increased constantly throughout the study period at 0.56 percent growth rate per annum (1970-2013). The land under miscellaneous tree crops and groves indicated negative growth in its area during the period of 70s and 80s but its growth turned out to be positive (0.69 percent) during 1990s and it occupied further positive growth during 2000s (0.22%) & 2003-13 (0.16%). Thus the area under this category scaled up at overall growth rate (0.045%) per annum during overall period (1970-2013). The cultivators may have tempted to diversify their farming, putting more area under high valued crops on one side and also prefer to minimize the risk situation emerging due to climatic change unleashing erratic rainfall and consequently costly diesel irrigation, engulfing the margin of profits in raising season’s crops.
The analysis also indicated that the current fallow lands have swollen since the period 2000s, evidenced by 1.49 per cent (2000s) & 2.21 percent growth rate per annum. Keeping the land as current fallow may be assigned to the sum total effect of different factors like climatic change resulting in erratic rainfall, deteriorating water table, costly diesel irrigation, costly seeds & fertilizers, application of fertilizes irrespective of soil test, defective implementation of MSP, lack of accessibility to markets, thus finally result in marginal profit in cultivation of crops (paddy & wheat) and also putting the land fallow for the purpose of restoring its capacity/strength in form of soil fertility.
Table 2. Compound growth rate of different land use categories in Bihar
(Decadal Compound Growth Rate)
Sl No. Particulars 1970s 1980s 1990s 2000s 2003-13 1970-2013
1. Reporting area - - - - - -
2. Forest land -0.15 0.08 0.00 0.02 0.00* 0.06*
3. Barren unculturable land -0.37** 0.06 -0.02 -0.06* -0.06* -0.06*
4. Land put to non-agricultural uses 0.48* 1.26* 0.69* 0.11* 0.20* 0.56*
(a) Land area 0.48* 1.28* 0.51* 0.16* 0.27* 0.55*
(b) Permanent water area 0.48* 1.27* 0.65* 0.00 0.00* 0.38*
(c) Temporary water area 0.49* 0.94* 2.56* -0.15* -0.18* 0.96*
5. Culturable waste land 0.10 -1.13 -1.41* -0.10* -0.09* -1.13*
6. Permanent pastures & grazing
land -1.38* -3.79 -2.07* -0.61* -0.66* -1.26*
7. Land under Misc. trees & groves -0.86* -0.55 0.69* 0.22* 0.16* 0.45*
8. Fallow land other than current
fallow -0.53 0.24 -1.70* -0.63* -0.43* -0.71*
9. Current fallow -0.22 -1.38** -1.23 1.49** 2.21* -0.33*
10. Total unculturable land (2 to 9) -0.06 0.09 -0.02 0.37* 0.41* 0.12*
11. Net area sown 0.03 -0.06 0.03 -0.26* -0.29* -0.08*
Instability index
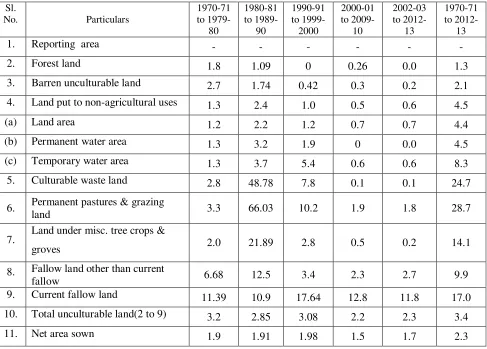
[image:9.595.54.541.427.776.2]Instability is a measure of extent of variability or the absence of stability in time series/ secondary data and thus, the instability indices for various land use categories were worked out presented in Table 3. An examination of the table explained the fact that the instability index during overall period 1970-71 to 2012-13 was found the highest (28.7%) for permanent pastures and grazing land, followed by culturable waste land (24.7%), current fallow land (17.0%) and land under miscellaneous tree and groves (14.1%). The decadal instability was found to be comparatively large in permanent pastures and grazing land (66.03%), followed by culturable waste land (48.78%), land under miscellaneous tree crops and groves (21.89%), current fallow land (17.64%) and fallow land other than current fallow (12.5%) during the periods of 80s, 90s and 2000s. However, the instability or variability index during the decades 2002-03 to 2012-13 was observed highest in current fallow category of land (11.8%), followed by fallow land other than current fallow (2.7%). The largest instability consistent in current fallow land during the first decade of the present century was probably due to climate change/global warming causing erratic rainfall. The instability associated with net sown area remained constant throughout the study period.
Table 3. Instability index for land use pattern in Bihar
Sl.
No. Particulars
1970-71 to
1979-80
1980-81 to
1989-90
1990-91 to
1999-2000
2000-01 to
2009-10
2002-03 to
2012-13
1970-71 to
2012-13
1. Reporting area - - - - - -
2. Forest land 1.8 1.09 0 0.26 0.0 1.3
3. Barren unculturable land 2.7 1.74 0.42 0.3 0.2 2.1
4. Land put to non-agricultural uses 1.3 2.4 1.0 0.5 0.6 4.5
(a) Land area 1.2 2.2 1.2 0.7 0.7 4.4
(b) Permanent water area 1.3 3.2 1.9 0 0.0 4.5
(c) Temporary water area 1.3 3.7 5.4 0.6 0.6 8.3
5. Culturable waste land 2.8 48.78 7.8 0.1 0.1 24.7
6. Permanent pastures & grazing
land 3.3 66.03 10.2 1.9 1.8 28.7
7. Land under misc. tree crops &
groves 2.0 21.89 2.8 0.5 0.2 14.1
8. Fallow land other than current
fallow 6.68 12.5 3.4 2.3 2.7 9.9
9. Current fallow land 11.39 10.9 17.64 12.8 11.8 17.0
10. Total unculturable land(2 to 9) 3.2 2.85 3.08 2.2 2.3 3.4
Spatial Distribution of Current Fallow Lands in Bihar
Table 4: Dynamics of spatial distribution of current fallow lands and common lands in Bihar
Sl.
No. Districts
Location coefficient for Current fallow land
Location coefficient for common land
1990-91 1999-2000 2012-13 1990-91 1999-2000 2012-13
1. Roht as 0.66 0.46 0.34 0.70 0.72 0.74
2. M unger 1.34 2.70 2.03 1.39 1.44 1.30
3. Bhagalpur 1.17 0.42 1.06 2.00 2.05 2.07
4. Gaya 2.04 3.14 3.09 0.93 0.93 0.94
5. West Cham paran 0.55 0.21 0.09 0.86 0.31 0.31
6. East Cham paran 0.64 0.36 1.22 0.84 1.03 1.05
7. Bhojpur 0.84 0.49 0.41 0.36 0.39 0.41
8. Saharsa 0.65 0.23 0.21 1.65 1.29 1.31
9. M adhubani 1.00 1.42 0.28 0.65 0.95 1.00
10. Aurangabad 2.25 2.66 1.59 0.73 0.74 0.75
11. Pat na 1.22 0.47 2.51 0.64 0.58 0.57
12. M uzaffarpur 0.77 1.14 0.33 0.79 0.89 0.93
13. Purnea 1.73 2.15 2.32 0.94 0.90 0.90
14. Kat hihar 1.60 1.66 0.35 1.37 1.81 1.48
15. Araria 1.22 0.64 0.31 0.80 1.13 1.16
16. Sit am arhi 0.80 0.61 0.15 0.74 0.90 1.01
17. Saran 1.03 0.46 1.54 1.33 1.26 1.28
18. Sam ast ipur 0.44 0.17 0.59 0.89 0.57 0.59
19. Dahrbhanga 1.43 0.45 1.03 0.73 0.67 0.70
20. Naw ada 0.40 0.74 1.24 0.76 0.69 0.71
21. Nalanda 0.19 0.39 1.45 0.12 0.13 0.14
22. Siw an 0.31 0.57 0.04 0.83 1.01 1.04
23. Gopalganj 0.07 0.23 0.31 0.90 0.88 0.91
24. Vaishali 0.50 0.79 0.17 2.14 2.12 2.16
25. Kishanganj 1.23 0.95 1.60 1.27 1.17 1.20
26. Begusarai 0.37 0.63 0.44 1.49 1.43 1.46
27. M adhepura 1.10 0.18 0.36 0.73 0.75 0.78
28. Jehanabad 0.52 1.69 1.92 0.58 0.64 0.61
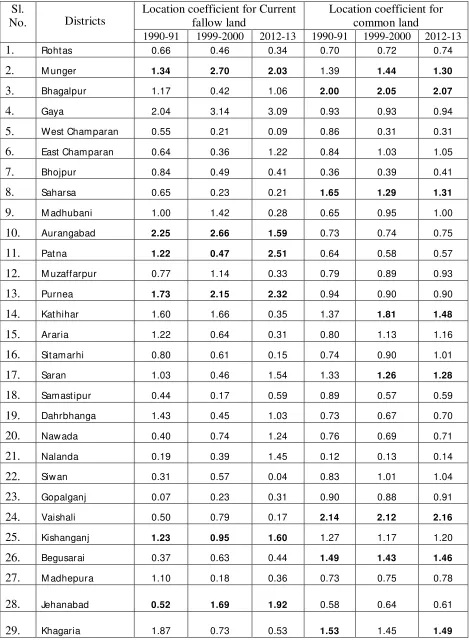
Location coefficients were estimated to examine the spatial dynamics of current fallow lands over the last 32 years across the different districts of the state. The results from the analysis as presented in Table 4 indicated that there has been a sharp increase in the concentration of current fallow lands in Gaya, Patna, Purnea, Munger, Jehanabad and Kishanganj districts and so on, this may probably be due to erratic rainfall and decline in water table in these areas. On the other hand, there has been a reduction in concentration of fallow lands in the districts such as Rohtas, West Champaran, Bhojpur, Saharsa, Madhubani, Muzaffarpur, Katihar, Araria, Sitamarhi, Siwan, Madhepura and Khagaria and so on; where ground water irrigation facilities have improved.
Common lands include barren and unculturable land, culturable waste land, permanent pastures and grazing land and land under miscellaneous trees and groves. The concentration of common land has been witnessed in certain districts like Vaishali, Bhaglpur, Khagaria, Katihar, Begusarai, Saharsa and Munger etc; thus it provides scope for redistribution of common lands to landless poor people so as to enable them to put these lands under efficient use.
Here it may be suggested that there is need of development of groundwater irrigation in the areas where larger concentration of current fallow lands exist so to enable the cultivators to put their fallow lands under proper cultivation.
Analysis of factors Affecting Current Fallow Lands in Bihar
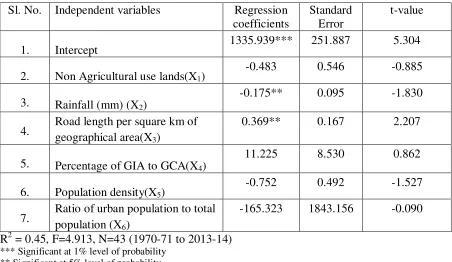
Over and again, relooking/analyzing the factual situation, one finds existence of several factors which are responsible for increase in fallow lands. One of the major factors is erratic rainfall, which affect the net sown area thus having a direct bearing on the area under current fallows and other fallows. The other factor may be envisaged as rising labour scarcity and consequently the hike in wage rates thus making cultivation of crop less profitable. It is further contemplated that increase in urban wage rates, expansion in non-farm opportunities and implementation of MNREGA may also result in the transfer of farm labour from agriculture sector, thereby pushing the accumulation of fallow lands. Inadequate capital and non-availability of timely credit facilities may also result in fallowing of lands
Table 5: Regression analysis of factors affecting Current fallow land in Bihar
Sl. No. Independent variables Regression coefficients
Standard Error
t-value
1. Intercept 1335.939*** 251.887 5.304
2. Non Agricultural use lands(X1)
-0.483 0.546 -0.885
3. Rainfall (mm) (X2) -0.175** 0.095 -1.830
4. Road length per square km of geographical area(X3)
0.369** 0.167 2.207
5. Percentage of GIA to GCA(X4) 11.225 8.530 0.862
6. Population density(X5)
-0.752 0.492 -1.527
7. Ratio of urban population to total population (X6)
-165.323 1843.156 -0.090
R2 = 0.45, F=4.913, N=43 (1970-71 to 2013-14)
*** Significant at 1% level of probability ** Significant at 5% level of probability
GIA: Gross Irrigated area, GCA: Gross Cropped Area
Factors Affecting Common Lands
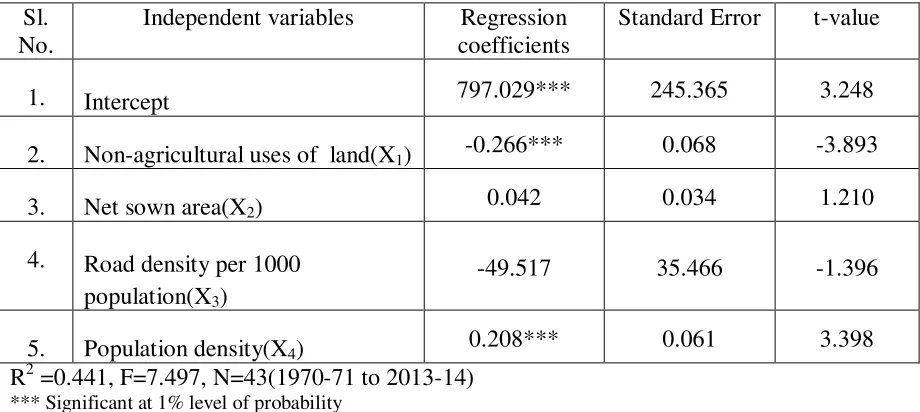
[image:13.595.67.527.284.490.2]The purpose of the analysis is to identify the determinants which affect the extent of common land in Bihar. The common lands comprises of barren and unculturable lands, culturable waste lands, permanent pastures & grazing land and land under miscellaneous trees and groves. An effort has been made to examine the factors responsible for changes in common lands by using regression analysis with the help of 43 years time series data (from 1970-71 to 2013-14) on common lands and related factors and henceforth the results of the analysis is presented in Table 6.
Table 6: Factors affecting common lands in Bihar
R2 =0.441, F=7.497, N=43(1970-71 to 2013-14)
*** Significant at 1% level of probability ** Significant at 5% level of probability
Note: Common lands include barren and unculturable land, culturable waste land, permanent pastures and grazing land and land under miscellaneous tree crops & groves
Out of four independent variables, the regression coefficient of two variables viz. land under non-agricultural uses (X1) and road density (X3) turned out to be negative and significant for
non-agricultural uses and non-significant for road density per thousand population. This reveals that rise in non-agricultural uses of lands has diminution effect on common lands, while road density did not exert significant impact on common lands. Further, it was interesting to mention here that net sown area and common land showed positive relation, the reason for this may probably be assigned to constant/regular increase in area under tree crops & groves (part of common land) cumulating for want of rainfall/erratic monsoon as well as scarcity of labours, thus resulting/leading to larger cost of production. On the other hand, the population density (X4) also emphasized the positive and significant impact on common
lands. It may be opined here that a sizeable proportion of population are migrating/ marching Sl.
No.
Independent variables Regression coefficients
Standard Error t-value
1. Intercept 797.029*** 245.365 3.248
2. Non-agricultural uses of land(X1) -0.266*** 0.068 -3.893
3. Net sown area(X2) 0.042 0.034 1.210
4. Road density per 1000 population(X3)
-49.517 35.466 -1.396
to different distant towns metropolitan cities or elsewhere for getting better employment opportunities and thus, owing to this fact that both population density and common lands ascertained positive relation despite increase in population density.
Conclusion
Conclusion may be drawn from the ongoing discussion that the net sown area in the state has continuously declined over the period under study. For further raising the income of cultivators, the only option is available to raise the cropping intensity or increase the area under crops more than once. In other words, it is possible through proper utilization of decreasing land availability. Rapid growth in area under non-agricultural uses has been observed for the purpose of settlement of ever-rising population and developmental activities. The most striking feature concerning the land use pattern in the state is that the current fallow land has escalated during the first study period of the present century (2001 to 2013-14). The reason for escalation in the current fallows may probably be given to a very low profit margin accruing in the cultivation of crops, probably due to erratic rainfall, higher wages of labour arising out of diversion of labour to MNREGA and for better employment opportunities in urban areas.
The rainfall has been found to be the most important determinant for current fallow lands, however, during the recent period (present century) the current fallow land registered increasing trend probably on account of erratic rainfall. On the other hand, the hypothesis is that the road length should have negative relation with current fallow but surprisingly the current fallows have developed positive and significant relation with road length, despite the increase in road length in the state this may probably be due to poor marketing facilities for the produce as well as migration of labour from the state to other states. The most important factor affecting the common lands has been identified as non-agricultural uses of land. The other factor population density showed positive and significant impact on common lands; it is perhaps due to migration of sizeable proportion of population to the other distant metropolitan cities and towns in the quest of better employment/ jobs.
may be neutralized and thus as a result, it may help to reduce the cost of production of growing crops.
Acknowledgement: The paper is drawn from the ICAR Social Science Network Project “Regional Crop Planning for Improving Resource Use Efficiency and Sustainability” funded by NIAP, New Delhi
References
Ramasamy C., R. Balasubramanian .and S.D. Sivakumar 2005. “Dynamics of Land Use Pattern with Special Reference to fallow lands-An Empirical Investigation in Tamil Nadu .”
Indian Journal of Agricultural Economics Vol 60 No. 4 Oct-Dec..
Singh, P. and A.K. Vashist 1997, “Dynamics of Land use Pattern in Bihar”, Agricultural Situation in India Vol 53 No. 11 February.
Subramanian, S.R., S. Krishnamurthy and P. Nasurudeen 1994. “Perspective Plan for Land Use in Tamil Nadu”, Department of Agricultural Economics, Tamil Nadu Agricultural Unversity, Coimbatore.
Sharm, U.K. and V.K. Pandey 1992. “Dynamics of Land Use in Different States of India”,
Agricultural Research Review, Vol. 5 No. 1, January-June.
Pandey, V.K. and S.K. Tiwari 1987. “Some Ecological Implications of Land Use Dynamics in Uttar Pradesh”, Indian Journal of Agricultural Economics Vol 42 No. 3 July-Sept.
Nadkarni, M.V. and R.S. Deshpande 1979. “Under-utilization of Land-Climatic or Institutional Factors” . Indian Journal of Agricultural Economics Vol 34 No. 2 April-June pp 1-16.