Hydrogen Dissolution and Structural Changes in Electrodeposited Cr Films
*1Yuichiro Miura
1;*2, Saori Yokota
2, Yuh Fukai
2and Tohru Watanabe
11Department of Applied Chemistry, Graduate School of Engineering, Tokyo Metropolitan University, Hachioji 192-0397, Japan
2Department of Physics, Chuo University, Kasuga, Bunkyo-ku, Tokyo 112-8551, Japan
Effects of hydrogen on the structure of electrodeposited Cr films have been investigated by combining X-ray diffraction and thermal desorption spectroscopy, systematically varying the plating conditions. A large amount of hydrogen was dissolved at high current densities in a Cr-rich bath at low temperatures, and caused structural changes from bcc to hcp and fcc hydrides with increasing hydrogen concentrations. Hydrogen dissolved in regular interstitial sites in the hcp and fcc hydrides desorbed at100C, but its certain fraction remained as bubbles and
desorbed at>800C leaving dimples on the surface.
(Received January 25, 2005; Accepted March 23, 2005; Published May 15, 2005)
Keywords: chromium, hydrogen, electrodeposition, structure, phase transformation, thermal desorption spectroscopy
1. Introduction
The dissolution of hydrogen is known to occur in some metals in the process of electrodeposition from aqueous solutions, and induce various changes in the properties of the film, including the crystal structure, the grain size, the internal stress, among others.1–4)Recently, it has come to be
recognized, as the electroplating has become more widely used in many different industries, that the presence of hydrogen in electrodeposited metals sometimes induce deteriorating effects and limits the reliability of the products. In order to solve these problems, understanding the basic properties of hydrogen in electrodeposited metals is indis-pensable.
The purpose of this paper is therefore to characterize the state of existence of hydrogen dissolved in the process of electrodeposition of metals, and investigate its effects on the structure of the film. For this purpose, Cr is one of the best choices because there is ample evidence that its electro-deposition is strongly affected by hydrogen: The current efficiency is low due to evolution of hydrogen; internal stresses probably built up by forced dissolution of hydrogen are so large as to initiate cracks, different crystal structures appear under different hydrogen deposition conditions,
etc.5,6) Among them the most prominent is the structural
change, namely that the hcp and fcc structures appear during electrodeposition and revert to the ordinary bcc structure in relatively short times after recovery to ambient
condi-tions.7–12) Many different factors are known to affect these
changes, includinge.g.the composition (additives included) of the electrolyte,8,9) the temperature and structure of the
substrate, application of pulsed currents,8) but no decisive
factors have been identified yet. We anticipate that the decisive factor here is the dissolution of hydrogen. One of the reasons for this conjecture is that we observed the appearance of hcp and fcc structures in our recent high hydrogen pressure experiments on Cr, and identified these phases as Cr–H alloys
of high hydrogen concentrations (H/Cr1).13) The phase
diagram obtained from the high-pressure experiment is reproduced in Fig. 1 for later reference.
The heat treatment under high hydrogen pressures and electrodeposition at certain cathodic overpotentials are thermodynamically equivalent in that both produce environ-ments of high hydrogen chemical potentials. A relation between the chemical potential of gaseous hydrogen and the cathodic overpotential is shown in Fig. 2. The overpotential is measured from the standard hydrogen electrode (SHE),i.e.
the potential of hydrogen electrode at 105Pa (1 atm) and
25C. It can be seen that overpotentials usually encountered in electrodeposition correspond to gaseous pressures of a few GPa. Thus we expect the overpotential applied in the electrodeposition to have the same effect and induce similar structural changes as in high-pressure experiments.
In the present experiment, we adopted simplest possible conditions for the electrodeposition, using a mixture of chromic acid and sulfuric acid for the electrolyte and amorphous Ni–P alloy for the substrate, and in this way
Fig. 1 The phase diagram of the Cr–H system.13)
*1This paper was originally published in Japanese in J. Japan Inst. Metals
68(2004) 552–557
[image:1.595.311.542.290.524.2]tried to isolate the effect of dissolved hydrogen by compar-ison with high-pressure experiments.
2. Experimental Method
The electrolytes of two different compositions were
adopted: Bath A; ordinary Sergent solution (CrO3 250 kg/
m3(2.5 mol/L) + H2SO42.5 kg/m3(0.025 mol/L)) and Bath
B; a more concentrated solution (CrO31000 kg/m3(10 mol/
L) + H2SO4 3.0 kg/m3 (0.031 mol/L)). The bath was
con-stantly stirred by a magnetic stirrer, and its temperature was set at every10C to within1C between 3 and 65C. For
the anode a Pt plate of2020mm in size was used, and for
observed by SEM (JEOL, JSM-6100), and the cross section of the film by SIM (Scanning Ion Microscope) after polishing by the focused ion beam (FIB) technique. For the analysis of hydrogen in the film, thermal desorption spectroscopy (TDS) was measured after removing the substrate by nitric acid. The
sample was placed in a quartz tube, evacuated to 2:7
104Pa, and the gas evolution in the course of heating to
1000C was measured at a rate of 1/12 K/s (5C/min).
3. Experimental Results and Discussion
3.1 Relation between the deposition condition and the structure of the film
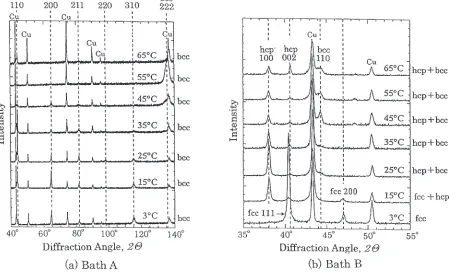
Figure 3 shows the XRD patterns of the films observed after deposition at different bath temperatures; Fig. 3(a) for Bath A and Fig. 3(b) for Bath B. In both cases, the current
density was fixed at 3000 A/m2 to facilitate comparison. In
Bath A, the structure was always bcc, whereas in Bath B, the structure changed from fcc at the lowest temperature 3C, to
[image:2.595.53.284.67.244.2]hcp + bcc above 25C.
Figure 4 shows the XRD patterns observed after
deposi-Fig. 2 A relation between the cathodic hydrogen potential and the chemical potential of gaseous hydrogen. Constructed from the calculation of Hemmeset al.14)
[image:2.595.75.524.487.761.2]tion in Bath B at 3C, at three different current densities. The structure was hcp at the lowest current density (1000 A/m2), and changed to fcc at higher current densities (3000, 5000 A/
m2). In fact, the films grown at high current densities
exhibited only one diffraction line, to be assigned either to fcc(111) or hcp(002), showing that these close-packed planes were grown in parallel to the substrate surface. Thus, in order to identify the structure, the XRD was re-measured on a
sample prepared by crashing the film of Case (b) (3C,
3000 A/m2). The result, reproduced in Fig. 5, shows
[image:3.595.56.290.72.352.2]un-ambiguously that the film consisted solely of the fcc phase without any admixture of other phases.
Figure 6 shows the structure of the film grown in Bath B as a function of bath temperature and current density. The bcc
structure is most stable at high temperatures and low current densities, which gives way to hcp and subsequently to fcc at lower temperatures and higher current densities. Films grown in Bath A always assumed the bcc structure.
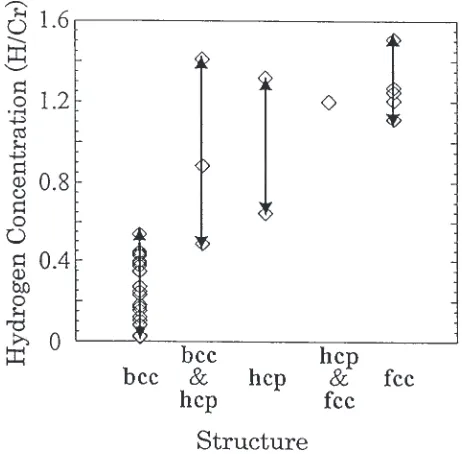
The thermal desorption of hydrogen was measured for all these films, for investigating the possible relation between the state of hydrogen and the crystal structure. Figure 7 shows the correlation between the total amount of desorbed hydro-gen and the structure of the films. The amount of hydrohydro-gen desorbed on heating to 1000C is the lowest in the bcc phase (x¼H/Cr¼0:30:3), and appreciably higher in hcp (x¼ 1:00:4) and fcc (x¼1:30:2). These results indicate that the dissolution of hydrogen is a primary cause of the observed structural changes of the deposited Cr film. The situation is very similar to what was observed in high-pressure experiments.13)
Thermal desorption spectra measured on samples of the three different structures are shown in Figs. 8(a)–(c). Note that the vertical scale of Case (a) is magnified by 100 times. For interpreting the results, it is useful to remember the TDS
Fig. 4 XRD patterns of Cr films electrodeposited in Bath B at three different current densities. The bath temperature was set at 3C.
Fig. 5 XRD pattern of the Cr film electrodeposited in Bath B at 3C and
3000 A/m2(Case (b) of Fig. 3), taken after pulverizing.
Fig. 6 Relation between the condition of electrodeposition and the structure of deposited films.
[image:3.595.309.543.73.216.2] [image:3.595.311.542.271.498.2] [image:3.595.54.283.397.571.2]data on samples prepared by heat treatments at high hydrogen pressures. There, sharp peaks observed at100C in the hcp and fcc structures were identified as the desorption of hydrogen on regular interstitial sites, a broad peak at200C in the bcc structure as desorption from Vac-H clusters, and a
gradual desorption above 800C as decomposition of H2
bubbles.13)Similar thermal desorption spectra were observed
films
Figure 1 shows that the hcp and fcc structures formed under high hydrogen pressures are unstable under ambient conditions, and indeed these structures were found to undergo gradual reversion to the bcc structure.
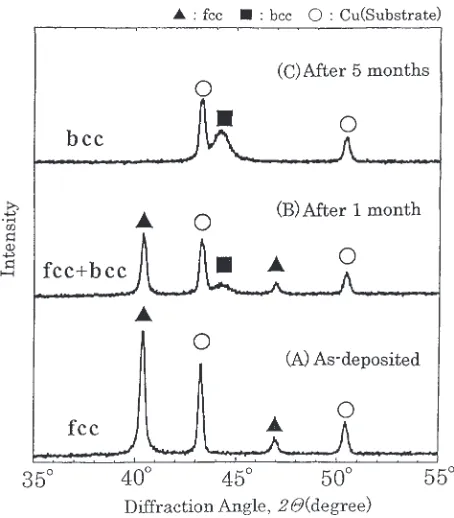
The temporal variation of the structure of a deposited film was examined by XRD, with the result shown in Fig. 9. At room temperature, a film initially of the fcc structure gradually decomposed, and eventually became the bcc structure after several months. With this structural change, a thermal desorption spectrum was also found to change, as shown in Fig. 10. The two spectra differ only in the
disappearance of the 100C peak after ageing; they look
very similar above 100C. This is understandable because, in the course of TDS measurement of the originally fcc film, the structure should have changed to bcc after 100C desorption. (In comparison to Fig. 8, a background increasing with increasing temperature is noticeable in Fig. 10. This is because the latter experiments were performed on samples of much smaller quantity, and therefore affected by a small gas evolution from the spectrometer. This background contribu-tion has been properly subtracted in evaluating the hydrogen contents inscribed.)
Fig. 8 Thermal desorption spectra of Cr–H alloys electrodeposited under three different conditions.
Fig. 9 XRD patterns of Cr films electrodeposited in Bath B at 3C and
[image:4.595.67.272.70.649.2] [image:4.595.313.540.498.757.2]3.3 Volume changes accompanying structural changes
The lattice parameter of bcc, hcp and fcc structures, derived from Figs. 3(a), 4(a) and 4(c), respectively, are compiled in Table 1, together with the atomic volume
(volume per formula unit CrHx) calculated therefrom. The
expansion of the atomic volume,ð2:40:1Þ 103nm3, in going from bcc to hcp/fcc structures is believed to be caused by dissolution of hydrogen. Comparison with H-induced volumes in various transition metals suggests that the observed lattice expansion corresponds roughly to the
stoichiometric composition x1. This is based on the
premises that the solubility in the bcc phase is negligibly small, and the reference volume of the three structures are nearly the same, the facts based on our previous high-pressure experiments13)and first-principles calculations.17)
Let us examine the implication of this H-induced volume expansion for the morphology of the film during hydrogen desorption. Figure 11 shows the surface of the films having the fcc structure, compared with the surface after reversion to bcc by hydrogen desorption. For a film prepared at a low current density (a), the surface remained smooth, showing that the lattice contraction took place uniformly. For films prepared at higher current densities (b) and (c), on the other hand, many dimples were observed, showing that a part of hydrogen formed bubbles before being desorbed.
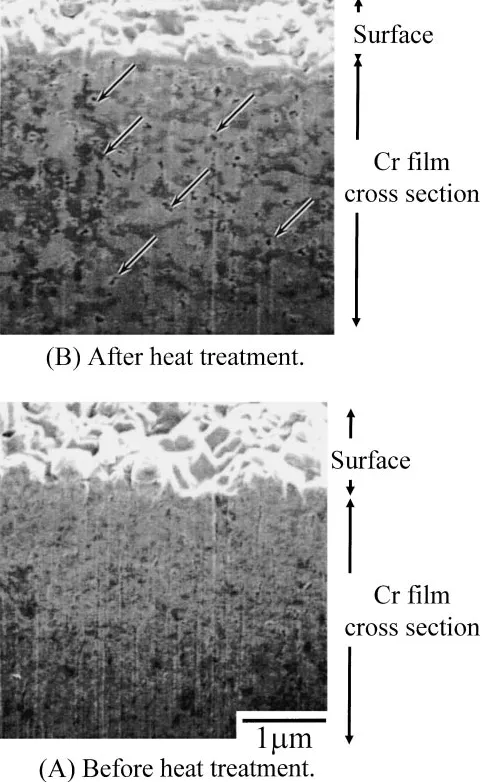
Figure 12 shows the SIM (Scanning Electron Microscope) image of the cross section of the films. As shown in Fig. 12(A), a sample, as deposited, consisted of small grains of100nm in size, and its heat treatment at 800C for 900 s induced grain growth as well as the formation of numerous
voids of 50nm in diameter. These microscopic
[image:5.595.303.545.58.493.2]observa-tions are consistent with the result of TDS, showing that a part of hydrogen form voids before being desorbed.
Fig. 10 Thermal desorption spectra of Cr films electrodeposited in Bath B at 3C and 3000 A/m2(Case (b) of Fig. 4); (A) as deposited, and (B) after ageing for1:3104ks (5 months).
Table 1 The lattice parameter and atomic volume of three structures appearing in electrodeposited Cr films.
Structure Lattice parameter Atomic volume
bcc a¼0:288nm 11:9103nm3 hcp a¼0:272nm 14:4103nm3
c¼0:444nm c=a¼1:63
[image:5.595.69.269.68.422.2]fcc a¼0:386nm 14:2103nm3
Fig. 11 Surface SEM images of Cr films electrodeposited in Bath B at 3C
[image:5.595.46.291.508.586.2]another method to produce high chemical potentials of hydrogen.
REFERENCES
1) H. Furuya, N. Hasegawa, Y. Misaki and Y. Tanabe: J. Met. Surf. Soc. Jpn.32(1981) 637–642.
2) T. Watanabe and T. Kanayama: J. Jpn. Inst. Met.:58(1994) 132–137. 3) Y. Tsuru: J. Surf. Finish. Soc. Jpn.54(2003) 35–39.
4) Ch. J. Raub: Plat. Surf. Finish., Sep. (1993) 30–38. 5) A. R. Jones: Plat. Surf. Finish., Apr. (1989) 62–66.
6) J.-H. Chai, D.-Y. Chang and S.-C. Kwon: Plat. Surf. Finish., June (1989) 80–82.
7) Y. Sakamoto: J. Jpn. Inst. Met.36(1972) 450–457.
8) R.-Y. Tsai and S.-T. Wu: J. Electrochem. Soc.137(1990) 3057–3060. 9) R.-Y. Tsai and S.-T. Wu: J. Electrochem. Soc.138(1991) 2622–2626. 10) T. Pearson and K. Dennis: Plat. Surf. Finish., Nov. (1989) 64–69. 11) A. D. Stock and K. I. Hardcastle: J. Inorg. Nucl. Chem.32(1970)
1183–1186.
12) M. Tkacz: Pol. J. Chem.71(1997) 1735–1741.
13) Y. Fukai and M. Mizutani: Mater. Trans.43(2002) 1079–1084. 14) H. Hemmes, A. Driessen and R. Griessen: J. Phys. C19(1986) 3571–
3585.
15) K. Ito, F. Fang and T. Watanabe: J. Jpn. Inst. Met.65(2001) 495–501. 16) Y. Fukai, M. Mizutani, S. Yokota, M. Kanazawa, Y. Miura and
T. Watanabe: J. Alloys Compd.356/357(2003) 270–273.
[image:6.595.49.292.75.466.2]17) P. A. Korzhavyi, I. A. Abrikosov, B. Johansson, A. V. Ruban and H. L. Skriver: Phys. Rev. B59(1999) 11693–11703.
Fig. 12 Cross sectional SEM images of Cr films electrodeposited in Bath B at 3C and 3000 A/m2(Case (b) of Fig. 4); (A) as deposited, and (B) after heat treatment at 800C for 900 s. The structure changed from fcc to bcc