Kink Band Formation and Its Effect on Recrystallization
in Ordered and Disordered Ni
3Fe Single Crystals
Tatsuya Okada
1, Hiroyuki Y. Yasuda
2;3, Tetsuya Watanabe
1;*,
Fukuji Inoko
4and Yukichi Umakoshi
21Department of Mechanical Engineering, Faculty of Engineering, The University of Tokushima, Tokushima 770-8506, Japan 2Division of Materials and Manufacturing Science, Graduate School of Engineering, Osaka University, Suita 565-0871, Japan 3Research Center for Ultra-High Voltage Electron Microscopy, Osaka University, Ibaraki 567-0047, Japan
4Emeritus Professor, The University of Tokushima
In order to study the influence of ordering on deformation and recrystallization, Ni3Fe single crystals, ordered and disordered by
appropriate heat treatments, were deformed in tension at room temperature and subsequently annealed at temperatures above the order-disorder transformation temperature. Both ordered and disordered single crystals exhibited a large elongation, while deformation microstructures were totally different. Kink bands formed only in the disordered single crystals. Recrystallization occurred along the kink bands. Many recrystallized grains hadh111i-rotation relationships with the kink band and were twin related to each other. In contrast, no recrystallized grain formed in the single crystal deformed in the ordered state. [doi:10.2320/matertrans.48.759]
(Received October 19, 2006; Accepted February 9, 2007; Published March 25, 2007)
Keywords: Ni3Fe, single crystal, ordering, tensile deformation, kink band, recrystallization
1. Introduction
A Ni3Fe alloy, the major ingredient of permalloy, exhibits
an order-disorder transformation at 776 K (Tc). FCC and L12
structures are stabilized above and below Tc, respectively.
We can obtain a disordered (FCC) alloy by water-quenching from high temperature, whereas a completely ordered (L12)
state is achieved by an appropriate isothermal treatment. Dislocation dissociation in a Ni3Fe alloy changes
depend-ing on whether the alloy is ordered or disordered. In a completely disordered (FCC) alloy, a (1/2)h110i perfect dislocation may dissociate into a pair of (1/6)h211iShockley partial dislocations. A stacking fault is formed between the two Shockley partials. On the other hand, dislocation dissociation in an ordered (L12) alloy is a bit more complex
because it involves the anti-phase boundary (APB). The deformation of an ordered alloy at room temperature is dominated by the glide of superlattice dislocations consisting of a pair of (1/2)h110iunit dislocations separated by an APB. The unit dislocations may further dissociate into Shockley partials.1) It is expected that the difference in dislocation dissociation between ordered and disordered alloys greatly affects their deformation microstructures. This difference will also affect recovery and recrystallization.
In this paper, we report on tensile deformation and recrystallization of ordered and disordered Ni3Fe single
crystals. The initial orientation of the single crystals was controlled so that the Schmid factor of the primary slip system was close to 0.5. We chose this orientation because kink bands (KBs) formed and recrystallization preferentially occurred along the KBs in aluminum single crystals of the same orientation.2–4)
Extensive research has been conducted and reviewed5,6)on the effect of ordering on deformation and recrystallization.
The Ni3Fe alloy is subjected to study because the alloy
exhibits large plastic strain.7–10)However, most research has
dealt with kinetics of recrystallization and change in textures. Our interest is to find how the ordering of Ni3Fe single
crystals affects kink band (KB) formation and recrystalliza-tion.
2. Experimental Procedures
Ni3Fe single crystals were grown by a floating zone
method. They were annealed at 1473 K for 8:6104s for
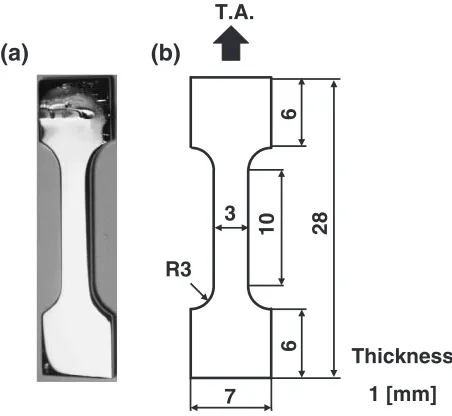
homogenization and slowly cooled. Samples for tensile deformation were spark-cut from the single crystals so that the tensile axis and wide surface were h149i and {121}, respectively. As shown in Fig. 1, the width, thickness and length of the gauge portion of the samples were 3 mm, 1 mm
T.A.
3
10
7
6
R3
Thickness
1 [mm]
(a)
(b)
6
28
Fig. 1 Ni3Fe single-crystal sample for tensile deformation.
*Undergraduate Student, The University of Tokushima. Present address:
[image:1.595.313.539.561.769.2]and 10 mm, respectively. A stereographic projection of the initial orientation is shown in Fig. 2. In Fig. 2, slip plane normal is represented by the triangular symbols P1 through P4. Here, P1, P2, P3 and P4 correspond to the primary, critical, conjugate and cross slip plane, respectively. Slip directions are represented by the elliptic symbols D1 through D6. Here, D1 is the primary slip direction. In Fig. 2, a bar put over a number indicates that the direction (or plane normal) is opposite to the one without a bar, e.g. D11 is the opposite direction to D1. A slip system is represented by a combina-tion of the slip plane and direccombina-tion. Schmid factors (m) of slip systems are summarized in Table 1. We should note that the Schmid factor of the primary slip system P1D1 (m¼0:47) is smaller than that of the P2D2 system (m¼0:48). The reason for this inconsistency will be explained in Section 3.2.
To obtain a fully ordered state, some samples were annealed at 699 K for3:6106s and cooled in the furnace. The other samples were annealed at 873 K for3:6103s and quenched into water to freeze a disordered state to ambient temperature. After mechanical polishing, the samples were electrolytically polished in 10 vol% sulfuric acid solution in
methanol at 243 K. We prepared five samples; two ordered samples (OR-1, OR-2) and three disordered ones (DI-1, DI-2 and DI-3). For OR-1 and DI-1, tensile tests were carried out with an intermission at strain of 0.4 to observe slip bands using a scanning electron microscope (SEM), JEOL JSM-6400. After the observation, the tensile test was resumed and strain of 0.8 in total was applied to both samples. Sample DI-2 was deformed to tensile strain of 0.6. Slip bands were examined with a SEM. An electron backscattering diffraction pattern (EBSP) analysis was carried out for DI-2 using a SEM JEOL JSM-5800 equipped with an EBSP system, TSL OIM3. These three samples (OR-1, DI-1 and DI-2) were annealed. The annealing conditions are summarized in Table 2. Orientation of recrystallized grains (RGs) was measured using an electron channeling pattern (ECP) apparatus attached to a JSM-6400. Two other samples (OR-2 and DI-3) were tensile-deformed until a decrease in the nominal stress was observed. Experimental conditions for all samples are summarized in Table 3. The initial strain rate of the tensile tests was3104s1.
3. Results and Discussion
3.1 Stress-strain curves
Figure 3 shows the stress-strain curves of the ordered (OR-2) and disordered (DI-3) samples. Both samples exhibited a large elongation; nominal tensile strain of 1.07 and 0.92 for the ordered and disordered samples, respectively. Nominal stress of the ordered sample was always higher than that of the disordered one by about 50%. The yield stress of ordered sample OR-2 was 82 MPa. A critical resolved shear stress (CRSS) of 39 MPa is derived by multiplying the yield stress
T.A.
P1
P2
D5
D3
D6
P3
P4
D1
D4
D2
P2 trace
P1 trace
Poles
<001> <011> <111>
[image:2.595.70.272.74.292.2]Fig. 2 Stereographic projection of initial orientation of samples. Traces of P1 and P2 slip are represented by solid and broken lines, respectively.
Table 1 Schmid factor of slip systems.
Slip plane Slip direction Schmid factor (m)
D1 0.47
P1 D3 0.18
D4 0.30
D2 0.48
P2 D4 0.26
D5 0.22
D2 0.18
P3 D3 0.06
D6 0.24
D1 0.21
P4 D5 0.11
D6 0.32
Table 2 Annealing conditions.
Sample Annealing
Temperature [K] Duration [s]
Recrystallized grains (RGs)
OR-1 1173 360 None
DI-2 1003 180 None
1073 180 None
1123 180 None
1173 180 None
1173 360 None
1173 360 None
DI-1 923 180 None
973 180 None
1023 180 None
1073 180 None
1123 180 1 RG
[image:2.595.303.549.83.270.2]1123 360 5 RGs
Table 3 Experimental conditions.
Sample No. Tensile strain Annealing Ordered OR-1 0.8 (intermission at 0.4) Annealed
OR-2 1.07 —
Disordered DI-1 0.8 (intermission at 0.4) Annealed
DI-2 0.6 Annealed
[image:2.595.304.549.305.383.2] [image:2.595.47.291.350.516.2]by the Schmid factor of 0.47 for primary slip system P1D1. This value is consistent with the CRSS of 38 MPs reported by Takasugiet al.8)
The stress-strain curve of ordered sample OR-2 exhibits hardening right from the yielding. For disordered sample DI-3, on the other hand, transition is observed at nominal strain of 0.2 from the easy glide region to the region with a higher hardening rate. Probably, this transition was due to the activation of the secondary slip system.
3.2 Deformation microstructures
The appearances of slip bands in ordered and disordered samples were totally different. SEM images of slip bands at tensile strain of 0.4 are shown in Figs. 4(a) and 4(b) for
ordered sample OR-1 and disordered sample DI-1, respec-tively. In OR-1, slip bands are so fine that we cannot resolve each band in this micrograph, except for several coarse bands. In contrast, slip bands in DI-1 are coarse. Probably, this difference was caused by different dislocation glide in ordered and disordered alloys. Korner11)reported dislocation
structures on the primary slip plane in both ordered and disordered Ni3Fe single crystals deformed in tension at room
temperature. In the ordered alloy, superlattice dislocations were arranged homogeneously on the slip plane, leading to very fine slip. On the other hand, in the disordered alloy, group motion of glide dislocations was predominant, causing very coarse slip. He attributed the latter to the interaction between dislocations and short range order, which was not completely suppressed.
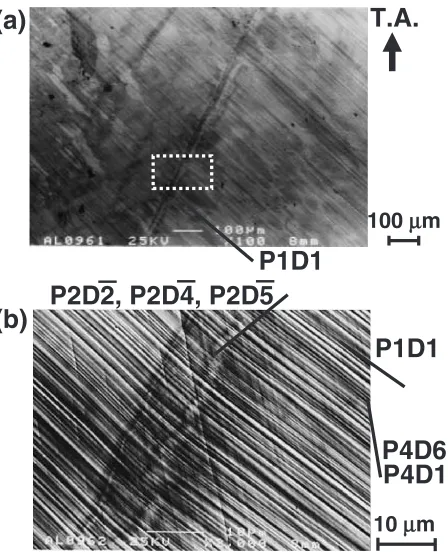
At higher strain, deformation bands formed only in the disordered samples. In the ordered samples, morphological features of slip bands remained almost the same as at lower strain. We did not observe deformation bands in the ordered samples. On the other hand, narrow deformation bands formed in the disordered samples with tensile strain larger than 0.6. Figures 5(a) and 5(b) are SEM images of disordered sample DI-1 at strain of 0.8. As shown in Fig. 5(a), the deformation bands make an angle of about 75with the trace of the primary slip plane P1. This arrangement indicates that such deformation bands are of KBs, not bands of secondary slip (BSS).12)In Fig. 5(b), slip bands corresponding to the P2 slip are observed in the KB. The activation of the P2D2 slip system rotates the crystal in the opposite direction to the rotation caused by primary slip system P1D1. To visualize this, SEM/EBSP measurements were carried out for disor-dered sample DI-2 with strain of 0.6. Figures 6(a) and 6(b)
0 50 100 150 200 250 300 350
0 0.2 0.4 0.6 0.8 0.92 11.07 1.2
OR-2
DI-3
Strain ε
Stress
σ
/ MPa
Fig. 3 Nominal stress-strain curves for ordered sample OR-2 and disordered sample DI-3.
P1D1
P4D6
P1D1
P4D6
10
µ
m
10
µ
m
T.A.
T.A.
T.A.
T.A.
(a)
(b)
P4D1
P4D1
Fig. 4 Slip bands of (a) ordered sample OR-1 and (b) disordered sample DI-1 at strain of 0.4.
P1D1
P1D1
P4D6
P2D2, P2D4, P2D5
100
µ
m
10
µ
m
T.A.
(a)
(b)
P4D1
[image:3.595.56.283.72.210.2] [image:3.595.316.540.73.349.2] [image:3.595.54.287.253.564.2]are an orientation map around a KB and ah001ipole figure of the orientation data, respectively. In Fig. 6(b), the h001i poles of the initial orientation of the sample are also plotted. Rotation occurred about one of the h001i axes close to the normal to the wide surface of the sample. Orientation distribution is about 10; this value is much smaller than the rotation of 30 associated with KBs in an aluminum single crystal of the same orientation at tensile strain of 0.3.2)It is
clear that the development of KBs in the present sample was in an early stage.
We usually assign primary (P1), critical (P2), conjugate (P3) and cross (P4) slip planes according to the initial orientation of single crystals for tensile deformation. In other words, such slip character is predictable from the initial orientation as long as the tensile axis exists inside the stereographic triangle, i.e. the initial orientation is not of a multiple slip one. The P1D1 slip system in our conventional assignment is the primary slip system and therefore has the largest Schmid factor. However, in the present paper, the P1D1 slip system (m¼0:47) has a bit smaller Schmid factor than the P2D2 slip system (m¼0:48). In all five samples examined in the present study, the P1D1 slip system (m¼
0:47) always activated first and dominated the deformation. Hence, we assigned P1D1 to the most activated slip system not to the one with the largest Schmid factor (m¼0:48).
The P1D1 slip system in the present study corresponds to the critical slip system in our conventional assignment according to the initial orientation (i.e.Schmid factor). Such anomaly was reported for thin (e.g. 1 mm thick) aluminum single crystals and polycrystals.13,14)Kitajima13)found that the most activated slip system was the critical slip system with the second largest Schmid factor and the shortest slip pass close to the normal to the wide surface of the samples. His findings are consistent with the present results.
3.3 Recrystallization
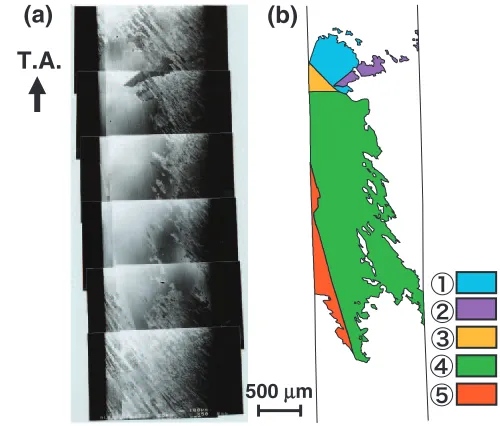
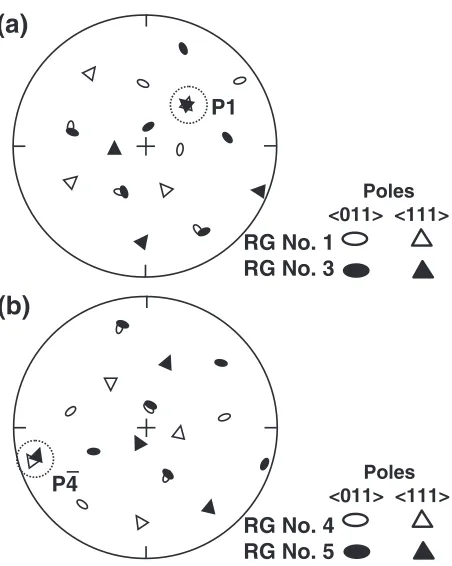
Among three annealed samples OR-1, DI-1 and DI-2, recrystallization occurred only in the disordered sample DI-2 with tensile strain of 0.8. No recrystallized grain (RG) was observed for OR-1 (strain: 0.8) and DI-1 (strain: 0.6) even after annealing at 1173 K. In DI-2, first RG formed after annealing at 1123 K for 180 s. Other four (five in total) RGs were found after annealing at the same temperature for another 360 s (see Table 2). Distribution of RGs in DI-2 is shown in Fig. 7. We colored RGs in Fig. 7(b) according to their orientation. Orientation of each RG was compared with that of the KB. The results are summarized in Table 4. Four RGs had h111i-rotation relationships with the KB, that is, orientation of the RG is related to that of the KB through rotation about one ofh111iaxes. The RGs having a common rotation axis are twin related to each other, that is, RG No. 1 and No. 3 (rotated about P1 normal), and RG No. 4 and No. 5 (rotated about P4 normal) are twins. In Fig. 8, orientation of these RGs is presented in stereographic projections.
Present results have some similarities with recrystalliza-tion in aluminum single crystals of the same orientarecrystalliza-tion; recrystallization preferentially occurred along KBs. In addition, most RGs hadh111irotation relationship with the orientation of KBs.2–4)The difference is that the
deformation-T.A.
20
µ
m
T.A.
001 pole
Initial orientation
(a)
(b)
Fig. 6 (a) EBSP orientation map around a kink band in disordered sample DI-2 at strain of 0.6. (b)h001ipole figure plotted from the orientation data of (a).
500 µm
T.A.
(a)
(b)
[image:4.595.55.289.73.308.2]Fig. 7 (a) SEM image of disordered sample DI-1 after annealing. (b) Schematic diagram of (a). Recrystallized grains are colored according to their orientation.
Table 4 Orientation relationships between recrystallized grains (RGs) and kink band. CW and CCW stand for clockwise and counterclockwise, respectively.
RG No. Rotation axis
Direction of rotation
[image:4.595.298.548.74.287.2] [image:4.595.306.547.388.474.2]Rotation angle [degree]
1 P1 normal CCW 14 Twin of RG No. 3
2 None
induced rotation of KBs in Ni3Fe was by far smaller than that
in aluminum. Also, the frequency of twin relations among RGs was much larger in Ni3Fe than that in aluminum,
although quantitative analysis is difficult owing to the limited number of RGs in the present study.
Finally, we should note again that RGs formed only along KBs in the disordered sample with large tensile strain of 0.8. Recrystallization did not occur in the disordered sample with relatively small strain (e.g. 0.6) and the sample deformed in the ordered state. The result indicates that the development of KBs is essential for recrystallization. We believe that the nucleation sites of recrystallization exist at the intersections between slip bands of the primary slip system and those of the critical slip system in deformation bands. Activation of minor slip systems may also be involved in the RG nucleation.15)
4. Summary
Ordered and disordered Ni3Fe single crystals were
deformed in tension and subsequently annealed at temper-atures above the order-disorder transformation temperature.
1) Both ordered and disordered single crystals exhibit a large elongation, approximately of 1. Nominal tensile stress of ordered single crystals was higher than that of disordered ones by about 50%.
2) Slip bands were very fine in ordered single crystals. In contrast, slip bands in disordered single crystals were coarse.
3) In all single crystals, the most activated slip system was the one with the second largest Schmid factor, that is, the critical slip system.
4) Kink bands formed in disordered single crystals with tensile strain larger than 0.6. In contrast, no deformation band was observed in ordered single crystals.
5) Recrystallized grains formed along kink bands in the disordered single crystal. They had h111i-rotation relationships with the orientation of the kink bands. Twin relations were found among recrystallized grains.
REFERENCES
1) M. Yamaguchi and Y. Umakoshi: Prog. Mater. Sci.34(1990) 1–148. 2) F. Inoko and K. Kashihara: J. Japan Inst. Metals56(1992) 361–370. 3) K. Kashihara, M. Tagami and F. Inoko: J. Japan Inst. Metals58(1994)
404–410.
4) F. Inoko, M. Tagami and K. Kashihara: J. Japan Inst. Metals58(1994) 494–500.
5) R. W. Cahn:Proc. 1989 Symp. on High Temperature Aluminides and Intermetallics, (TMS, 1990) pp. 245–270.
6) I. Baker: Intermetallics8(2000) 1183–1196.
7) A. E. Vidoz, D. P. Lazarevic´ and R. W. Cahn: Acta Metall.11(1963) 17–33.
8) T. Takasugi, T. Eguchi, M. Yoshida and O. Izumi: J. Japan Inst. Metals
53(1989) 34–41.
9) Y. Kaneno, A. Takahashi and T. Takasugi: Mater. Trans.47(2006) 1485–1491.
10) Y. Kaneno, A. Takahashi and T. Takasugi: Mater. Sci. Eng. A431
(2006) 328–338.
11) A. Korner: Acta Metall.33(1985) 1399–1406.
12) K. Higashida, J. Takamura and N. Narita: Mater. Sci. Eng.81(1986) 239–258.
13) S. Kitajima: Mem. Fac. Eng. Kyushu Univ.XX(1961) 105–196. 14) S. Kitajima and N. Ono: Phys. Status Solidi A149(1995) 201–211. 15) F. Inoko, T. Okada, M. Tagami and K. Kashihara:Proc. 21st Risø Int.
Symp. on Materials Science, (Risø National Laboratory, 2000) pp. 365– 370.
(a)
(b)
Poles <011> <111>
Poles <011> <111>
RG No. 1
RG No. 3
RG No. 4
RG No. 5
P1
P4
[image:5.595.57.283.70.353.2]